Decoding Epistasis in Directed Evolution: A Practical Guide for Protein Engineers and Drug Developers
This article provides a comprehensive analysis of epistatic effects in directed evolution variants, bridging theoretical concepts with practical applications.
Decoding Epistasis in Directed Evolution: A Practical Guide for Protein Engineers and Drug Developers
Abstract
This article provides a comprehensive analysis of epistatic effects in directed evolution variants, bridging theoretical concepts with practical applications. It begins by establishing the fundamental principles of epistasis and its critical role in shaping evolutionary pathways. We then explore current methodologies for detecting, measuring, and mapping epistatic interactions within high-throughput variant libraries. The guide addresses common challenges in interpreting non-additive mutational effects and offers strategies for optimizing screening protocols to capture epistasis. Finally, we compare computational and experimental validation techniques, evaluating tools like DMS and deep mutational scanning. This resource is tailored for researchers and professionals in protein engineering and therapeutic development, aiming to enhance the rational design of enzymes, antibodies, and other biomolecules by leveraging, rather than being hindered by, complex genetic interactions.
What is Epistasis? Unraveling Non-Linear Genetic Interactions in Protein Evolution
This comparison guide evaluates experimental methodologies and analytical frameworks for detecting and quantifying epistasis, the non-additive interaction between mutations, in directed evolution studies. Accurate epistasis mapping is critical for predicting variant fitness and optimizing protein engineering campaigns.
Methodological Comparison: Detecting and Quantifying Epistasis
Table 1: Comparison of Epistasis Analysis Platforms/Methods
| Method / Platform | Core Principle | Measurable Output | Throughput | Key Limitation | Typical Experimental Context |
|---|---|---|---|---|---|
| Deep Mutational Scanning (DMS) | Fitness of thousands of variants via NGS. | Enrichment scores, ε (epistasis coefficient). | Very High (10^4-10^5 variants) | Requires functional selection; sequencing depth. | Antibody affinity, enzyme activity. |
| Classical Pairwise Coupling | Construct & assay all single/double mutants. | Additive expectation vs. observed ΔΔG. | Low (<100 variants) | Scalability limits; misses higher-order effects. | Protein stability (Thermal Shift). |
| Statistical Coupling Analysis (SCA) | Evolutionary covariation from MSA. | Coupling energy (Φ). | Computational | Correlative, not mechanistic. | Identifying sectors in protein families. |
| ML Predictors (e.g., ESM-2) | Fitness prediction from sequence alone. | Predicted log fitness, interaction scores. | Ultra High (in silico) | Training data dependent; black box. | Priortizing variants for experimental testing. |
Table 2: Quantitative Epistasis Data from Recent Studies (2023-2024)
| Protein System | # of Mutations | Measured Property | Additive Model R² | Model with Epistasis R² | Magnitude of Top Interaction (ε) | Key Finding |
|---|---|---|---|---|---|---|
| SARS-CoV-2 Spike RBD | 5 | ACE2 Binding Affinity | 0.41 | 0.97 | +2.8 kcal/mol | Strong positive epistasis enabled escape variant emergence. |
| TEM-1 β-lactamase | 4 | Cefotaxime MIC | 0.55 | 0.92 | -3.1 log(fitness) | Negative epistasis constrains accessible evolutionary paths. |
| GFP | 6 | Fluorescence Intensity | 0.67 | 0.89 | +15-fold | Epistatic network crucial for folding and chromophore formation. |
Experimental Protocols for Epistasis Mapping
Protocol 1: High-Throughput Epistasis Mapping via DMS
- Library Construction: Use site-saturation mutagenesis or oligonucleotide pooling to generate a combinatorial variant library covering target positions.
- Functional Selection: Subject the library to selective pressure (e.g., antibiotic concentration, fluorescence-activated cell sorting for binding, growth rate in auxotrophy complementation).
- Sequencing & Count Analysis: Extract genomic DNA/plasmid pools pre- and post-selection. Amplify variant regions and perform high-depth NGS (Illumina NovaSeq). Obtain read counts for each variant.
- Fitness Calculation: Compute enrichment scores: w_i = log( count_post(i) / count_pre(i) ). Normalize to wild-type and reference neutral variants.
- Epistasis Calculation: For a double mutant ij, calculate epistasis (ε) as: ε_ij = w_ij - w_i - w_j + w_wt where w is the measured fitness. Positive ε indicates synergistic interactions; negative ε indicates antagonistic interactions.
Protocol 2: Thermodynamic Epistasis from Stability Measurements (ΔΔG)
- Variant Cloning: Generate single (A, B) and double (AB) mutant constructs via site-directed mutagenesis.
- Protein Purification: Express and purify all variants using standardized IMAC/chromatography.
- Stability Assay: Perform differential scanning fluorimetry (DSF) or isothermal denaturation to determine melting temperature (T_m). Convert T_m shifts to ΔΔG using the Gibbs-Helmholtz equation with appropriate heat capacity assumptions.
- Additive Model Test: Calculate the expected stability for the double mutant: ΔΔG_additive = ΔΔG_A + ΔΔG_B.
- Quantify Epistasis: Measure the observed ΔΔG_AB. The epistatic interaction in energy units is: ΔΔG_epistasis = ΔΔG_AB - (ΔΔG_A + ΔΔG_B).
Key Visualizations
Title: Quantifying Fitness Epistasis from Additive Expectation
Title: DMS Workflow for Epistasis Mapping
The Scientist's Toolkit: Research Reagent Solutions
Table 3: Essential Reagents & Kits for Epistasis Experiments
| Item | Function in Epistasis Research | Example Product/Kit |
|---|---|---|
| Combinatorial Mutagenesis Kit | Efficient generation of variant libraries for DMS. | NEB Q5 Site-Directed & Golden Gate Assembly kits. |
| High-Fidelity Polymerase | Error-free amplification of variant libraries for sequencing prep. | KAPA HiFi HotStart ReadyMix. |
| NGS Library Prep Kit | Preparation of barcoded amplicons for Illumina sequencing. | Illumina DNA Prep. |
| Stability Dye | Measuring protein thermal shift for ΔΔG calculations. | Thermo Fisher Protein Thermal Shift Dye. |
| Surface Plasmon Resonance (SPR) Chip | Quantifying binding affinity (KD) of variant proteins. | Cytiva Series S Sensor Chip CM5. |
| Microplate Reader (HTS) | High-throughput measurement of enzymatic activity/fluorescence. | BioTek Synergy H1. |
| Cell Sorting Platform | Enriching functional variants based on fluorescence/binding. | BD FACSymphony S6 Cell Sorter. |
| Data Analysis Suite | Processing NGS counts and calculating epistasis coefficients. | DiMSum pipeline (custom R/Python). |
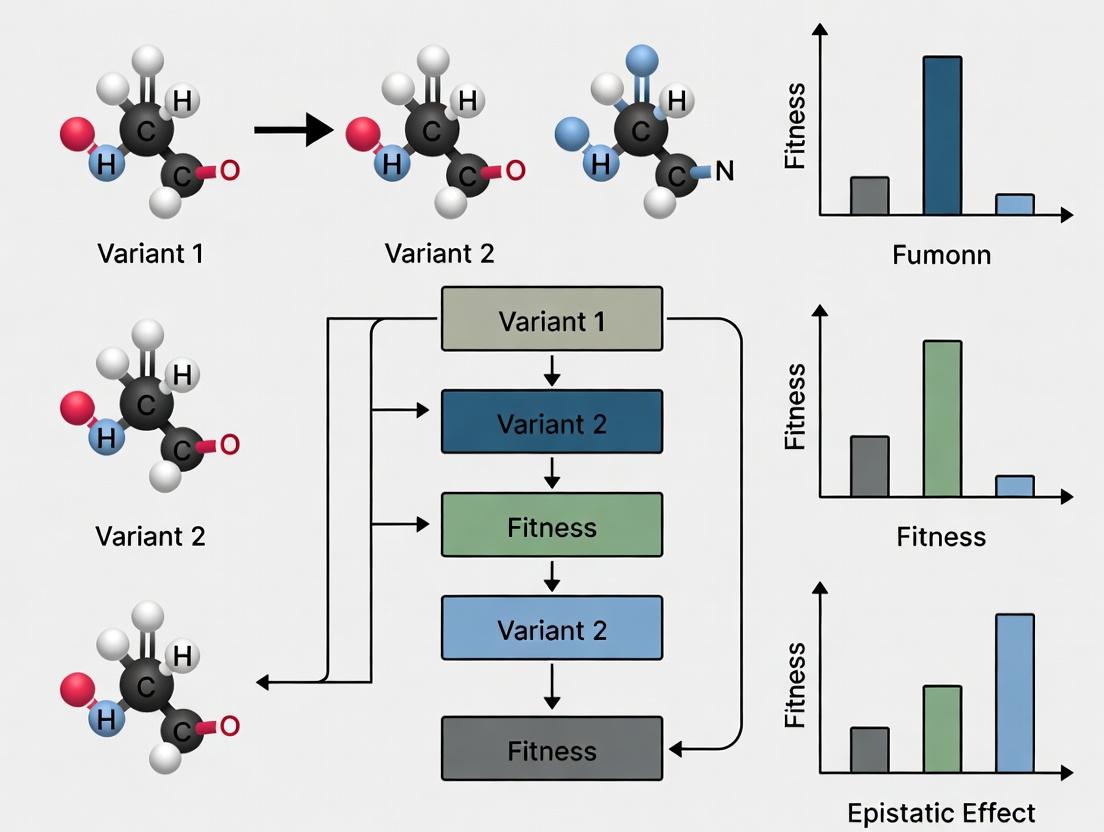
In the directed evolution of proteins for therapeutic and industrial applications, epistasis—the non-additive interaction between mutations—is a fundamental determinant of success. Understanding the spectrum from synergistic (positive) to antagonistic (negative) epistasis is critical for predicting evolutionary trajectories and engineering optimized variants. This guide compares experimental approaches for quantifying and characterizing epistatic interactions, providing researchers with a framework for analysis within directed evolution campaigns.
Comparative Analysis of Epistasis Measurement Methodologies
The following table summarizes key experimental platforms for epistasis analysis, comparing their throughput, quantitative output, and applicability to directed evolution.
Table 1: Comparison of Epistasis Measurement Methodologies
| Methodology | Primary Output | Throughput | Key Advantage | Major Limitation | Best For |
|---|---|---|---|---|---|
| Deep Mutational Scanning (DMS) | Comprehensive fitness maps for single & double mutants | Very High (10⁴-10⁶ variants) | Identifies global epistatic patterns; statistical power | Requires robust selection/screen; context-dependent | Mapping entire fitness landscapes of protein regions. |
| Combinatorial Library Synthesis & Screening | Fitness/activity of defined combinatorial sets | High (10²-10⁴ variants) | Direct measurement of specific interactions | Limited to predefined mutation subsets | Testing hypotheses on specific residue pairs. |
| Isothermal Titration Calorimetry (ITC)/Surface Plasmon Resonance (SPR) | Thermodynamic parameters (ΔΔG, binding affinity) | Low (single variants) | Direct, quantitative biophysical interaction data | Low throughput; often requires protein purification | Mechanistic, structural understanding of epistasis. |
| Growth Rate/Selection Competition Assays | Relative fitness (selection coefficient) | Medium-High (10-10³ variants) | Direct in vivo relevance for evolution | Requires linked selectable phenotype | Measuring fitness effects in a physiological context. |
Experimental Protocols for Key Epistasis Analyses
Protocol 3.1: Deep Mutational Scanning for Epistasis Mapping
Objective: To quantitatively measure the fitness effects of all single mutants and a large subset of double mutants within a protein domain. Workflow:
- Library Construction: Use saturated mutagenesis (e.g., NNK codon) at targeted positions via overlap extension PCR. Clone into an appropriate display (phage, yeast) or expression vector.
- Selection/Sorting: Subject the library to functional selection (e.g., binding to immobilized target, enzymatic activity under stress) or FACS based on a fluorescent reporter. Perform at least two rounds: a pre-selection to remove non-functional variants and a stringent selection.
- Sequencing & Analysis: Isolate plasmid DNA from pre- and post-selection populations. Perform high-throughput sequencing (Illumina). Calculate enrichment ratios (ε) for each variant as log₂(countpost / countpre). Fitness (s) is normalized to wild-type. Epistasis (ε) for a double mutant AB is calculated as ε = sAB - sA - sB + sWT, where sA and sB are single mutant fitnesses.
Title: DMS Workflow for Epistasis Measurement
Protocol 3.2: High-Throughput Combinatorial Assay for Pairwise Interactions
Objective: To systematically measure the fitness or activity of all possible combinations of mutations at two specific sites. Workflow:
- Design & Synthesis: Generate all single (A₁, A₂,... B₁, B₂,...) and double (A₁B₁, A₁B₂,...) mutants for two target sites via arrayed oligonucleotide synthesis.
- Cloning & Expression: Clone variants into an expression system compatible with a microplate assay (e.g., bacterial lysate, yeast surface display).
- Activity/Fitness Measurement: Perform a normalized functional assay (e.g., fluorescence-based enzymatic assay, binding via flow cytometry) in triplicate.
- Data Modeling: Plot measured activity for double mutants against the expected additive value (sum of single mutant effects). Synergistic epistasis appears above the line, antagonistic below. Calculate interaction coefficients.
Title: Quantifying Pairwise Epistasis from Activity Data
The Scientist's Toolkit: Research Reagent Solutions
Table 2: Essential Reagents & Kits for Epistasis Research
| Item | Function in Epistasis Studies | Example/Notes |
|---|---|---|
| Combinatorial Mutagenesis Kits | Enables rapid construction of variant libraries at multiple sites. | NEB Builder HiFi DNA Assembly, Twist Bioscience array oligo pools. |
| Phage or Yeast Display Vectors | Provides genotype-phenotype linkage for high-throughput selection/screening. | pComb3 (phage), pYD1 (yeast display). Crucial for DMS. |
| Next-Gen Sequencing Library Prep Kits | For preparation of DMS variant libraries for Illumina sequencing. | Illumina Nextera XT, Swift Accel-NGS 2S. |
| Microplate-Based Activity Assay Kits | Quantitative, high-throughput measurement of enzyme function. | Promega Glo assay kits, Thermo Fluorometric kits. |
| Flow Cytometry Sorting/Cell Analysis Reagents | For FACS-based selection or analysis of displayed protein libraries. | Anti-tag antibodies (e.g., Anti-Myc, Anti-HA), fluorescent substrates. |
| Protein Purification Systems | For biophysical characterization (ITC/SPR) of purified variant proteins. | His-tag purification resins (Ni-NTA), AKTA-compatible columns. |
| Statistical Analysis Software | For calculating fitness scores, epistasis coefficients, and landscape modeling. | R (epistasis package), Python (gpvolve), custom scripts. |
Case Study & Data Comparison: Beta-Lactamase Evolution
A seminal study on TEM-1 β-lactamase evolution provides a clear contrast between synergistic and antagonistic epistasis.
Table 3: Measured Fitness Effects (Growth Rate) of TEM-1 β-Lactamase Variants Under Antibiotic Selection
| Variant | Mutation(s) | Measured Fitness (Relative) | Expected Additive Fitness | Epistasis (ε) | Type |
|---|---|---|---|---|---|
| WT | - | 1.00 | - | - | Baseline |
| A | M182T | 1.48 | - | - | Single |
| B | G238S | 1.29 | - | - | Single |
| C | R164S | 0.86 | - | - | Single |
| AB | M182T + G238S | 2.37 | 1.77 (1.48+1.29-1.00) | +0.60 | Synergistic |
| AC | M182T + R164S | 0.91 | 1.34 (1.48+0.86-1.00) | -0.43 | Antagonistic |
Interpretation: The combination M182T/G238S shows strong synergistic epistasis, conferring far higher resistance than expected. In contrast, M182T/R164S shows antagonistic epistasis, where the beneficial effect of M182T is nearly canceled by its interaction with R164S. This highlights how epistasis shapes accessible evolutionary paths.
For directed evolution, initial DMS of target hotspots is recommended to identify regions prone to synergistic interactions. For fine-tuning, combinatorial assays on top hits can pinpoint optimal mutation combinations. Antagonistic interactions, while often problematic, can reveal critical structural or functional constraints. Integrating high-throughput functional data with structural modeling (e.g., using Rosetta) offers the most powerful framework for navigating the epistatic spectrum to predict and engineer superior protein variants.
Directed evolution mimics natural selection to engineer biomolecules with desired properties. A critical factor influencing its success is epistasis—the phenomenon where the effect of one mutation depends on the presence of other mutations. This guide compares directed evolution strategies by analyzing how they account for epistatic interactions that shape the adaptive landscape, ultimately determining evolutionary trajectories and outcomes.
Comparison of Directed Evolution Strategies Accounting for Epistasis
The following table compares key directed evolution methodologies based on their ability to map, interpret, and exploit epistatic interactions.
| Method | Core Approach | Epistasis Handling | Typical Throughput | Key Limitation | Supporting Data (Example Fitness Improvement) |
|---|---|---|---|---|---|
| Error-Prone PCR (epPCR) + Screening | Random mutagenesis across gene, followed by phenotypic screening. | Blind to epistasis; treats mutations as additive. | Low to Medium (10³-10⁴ variants) | Rare beneficial combinations are missed; rugged landscapes cause stagnation. | Antibiotic resistance enzyme: ~5-fold increase in MIC after 5 rounds. |
| Site-Saturation Mutagenesis (SSM) at Hotspots | Focused mutagenesis at residues identified as important. | Can reveal local epistasis if combined. | Medium (10⁴-10⁵ variants) | Misses global interactions between distant sites. | Thermostability: Tm increase of +7°C after optimizing 3 sites independently. |
| Combinatorial Library (e.g., CASTing) | Recombining mutations at multiple pre-selected sites. | Captures pairwise & higher-order interactions within the set. | High (10⁶-10⁸ variants) | Limited to predefined sites; scaling issues with >4 sites. | Enzyme activity: 100-fold increase vs. 20-fold from additive prediction. |
| Machine Learning (ML)-Guided Evolution | Model-trained prediction of fitness from sequence. | Models can learn epistatic rules from data. | Varies (Data-dependent) | Requires large, high-quality training datasets. | Fluorescent protein brightness: 4.5x improvement in 1 round vs. 3 rounds for epPCR. |
| Deep Mutational Scanning (DMS) | High-throughput functional assessment of nearly all single & double mutants. | Directly maps pairwise epistasis across large sequence spaces. | Very High (10⁵-10⁷ variants) | Costly; double mutant libraries only cover a fraction of higher-order space. | Viral escape: Identified compensatory double mutant with 50-fold fitness recovery vs. neutral singles. |
Experimental Protocols for Epistasis Analysis
Deep Mutational Scanning (DMS) for Pairwise Epistasis Mapping
Objective: Quantify the fitness of all single and double mutants within a protein region to construct an epistatic network. Protocol:
- Library Construction: Use doped oligonucleotide synthesis or combinatorial assembly to generate a plasmid library encompassing all possible single amino acid changes and targeted double mutants within a defined region (e.g., an enzyme active site).
- Selection/Filtration: Subject the library to a stringent functional selection (e.g., antibiotic concentration, fluorescence-activated cell sorting for binding, growth competition).
- Deep Sequencing: Isolve plasmid DNA from pre-selection (input) and post-selection (output) populations. Perform high-throughput sequencing.
- Data Analysis: Calculate enrichment ratios (output/input) for each variant. Normalize to wild-type to derive fitness scores (W). Epistasis (ε) for a double mutant AB is calculated as: ε = WAB - (WA * WB), where WA and WB are fitnesses of single mutants. Non-zero ε indicates epistasis.
ML-Guided Pathway Reconstruction
Objective: Infer historical evolutionary pathways and the role of epistasis in constraining trajectories. Protocol:
- Generate Historical Data: For a protein of interest, create a library of variants representing possible evolutionary intermediates (e.g., via site-directed mutagenesis of known beneficial mutations in all combinations).
- High-Throughput Phenotyping: Measure fitness (e.g., growth rate, enzyme activity) for all variants.
- Model Training: Train a predictive model (e.g., Gaussian process, neural network) on the sequence-fitness data. The model learns the epistatic constraints.
- Pathway Simulation: Use the model to predict fitness for all possible stepwise paths from wild-type to a top performer. Identify accessible paths (monotonically increasing fitness) vs. inaccessible paths (where epistasis creates fitness valleys).
The Scientist's Toolkit: Key Research Reagent Solutions
| Item | Function in Epistasis Studies |
|---|---|
| NEBuilder HiFi DNA Assembly Master Mix | Enables seamless, high-fidelity assembly of multiple DNA fragments for constructing combinatorial variant libraries. |
| Twist Bioscience Saturation Mutagenesis Libraries | Provides ready-to-use, comprehensive site-saturation mutagenesis libraries with even coverage for DMS studies. |
| Illumina NextSeq 2000 Sequencing System | Delivers the high-throughput sequencing depth required for accurate variant frequency quantification in DMS experiments. |
| Cytiva HiTrap Protein A/G Columns | For rapid purification of antibody or Fc-fusion protein variants for high-throughput binding affinity screens. |
| Microfluidic Droplet Generators (e.g., Bio-Rad QX200) | Enables ultra-high-throughput screening by compartmentalizing single cells/variants with assay reagents for fluorescence-activated sorting. |
| Google Cloud Vertex AI Platform | Provides scalable infrastructure for training large machine learning models on protein sequence-fitness datasets. |
Visualizing Epistatic Landscapes and Workflows
Title: DMS Workflow for Pairwise Epistasis
Title: Epistasis Creates a Constrained Evolutionary Path
Title: Additive vs. Rugged Fitness Landscapes
Historical Context and Foundational Studies in Molecular Epistasis
Comparative Analysis of Experimental Methodologies in Epistasis Mapping
The systematic quantification of epistatic interactions has evolved through distinct methodologies, each with specific performance characteristics in directed evolution research. The table below compares foundational and modern approaches.
Table 1: Comparison of Foundational and Modern Epistasis Analysis Methods
| Methodology | Primary Use Case | Throughput | Epistasis Detection Resolution | Key Limitation | Supporting Study (Key Metric) | ||
|---|---|---|---|---|---|---|---|
| Site-Saturation Mutagenesis (SSM) Combinatorial Libraries | Mapping pairwise interactions between specific sites. | Low to Medium (10²-10⁴ variants) | Direct, quantitative measurement of ε (εij). | Scales poorly for higher-order interactions. | Starr & Thornton, 2016 (Mean | ε | = 1.2 kcal/mol for PSD95) |
| Deep Mutational Scanning (DMS) | Profiling all single mutants & some double mutants in a background. | High (10⁵-10⁷ variants) | Statistical inference of epistasis from enrichment scores. | Confounded by global epistasis; indirect measurement. | Pokusaeva et al., 2019 (12% of variant pairs showed significant epistasis in TEM-1 β-lactamase) | ||
| Random Barcode-Based Combinatorial Libraries | Exploring vast sequence space for multi-site interactions. | Very High (10⁸-10⁹ variants) | Identifies co-evolving/rescuing mutations in fitness landscapes. | Requires sophisticated sequencing & bioinformatics. | Zhong et al., 2021 (Uncovered 3rd-order epistasis stabilizing GFP folding) | ||
| CRISPR-Cas9 Mediated Genome Editing | Precise epistasis analysis in endogenous genomic context. | Medium (10¹-10³ variants) | Measures interactions in native chromosomal environment. | Low throughput; technically challenging. | van Kempen et al., 2023 (Revealed chromatin-dependent epistasis in oncogenic pathways) |
Experimental Protocols for Foundational Studies
Protocol 1: Quantitative Epistasis Measurement via Site-Saturation Combinatorial Libraries
- Target Selection: Identify two residue positions (i and j) of interest from prior evolution experiments or structural data.
- Library Construction: Use overlap extension PCR or inverse PCR to generate all 400 possible codon combinations (20x20) at the two target sites within the gene of interest.
- Functional Assay: Clone library into appropriate expression vector and express in a microbial (e.g., E. coli) or mammalian host system. Subject to a selective pressure relevant to the protein function (e.g., antibiotic concentration for an enzyme, fluorescence for a reporter).
- High-Throughput Sequencing: Isolate plasmid DNA from pre-selection and post-selection populations. Amplify target region and perform paired-end sequencing.
- Data Analysis: Calculate enrichment scores (E) for each double mutant variant. Compute observed double mutant fitness (Fijobs) from E. Calculate expected additive fitness: Fijadd = Fi * Fj / Fwt, where Fi and Fj are fitnesses of single mutants. Quantify epistasis coefficient: ε = ln(Fijobs) - ln(Fijadd).
Protocol 2: Global Epistasis Analysis via Deep Mutational Scanning
- Single Mutant Library Generation: Create a library encompassing all possible single amino acid mutations across the target protein using degenerate oligonucleotides or error-prone PCR at low mutation rate.
- Barcoding & Pooling: Incorporate unique DNA barcodes for each variant via Gibson assembly. Pool all constructs into a single transformation.
- Selection Experiment: Grow the pooled variant library under defined selective conditions over multiple generations. Sample time points at regular intervals.
- Sequencing & Count Analysis: Extract genomic DNA from each time point. Amplify barcode regions and perform deep sequencing. Count barcode frequencies at each time point.
- Fitness & Epistasis Modeling: Calculate variant fitness (s) from the slope of barcode frequency change over time. Fit a global epistasis model (e.g., a nonlinear function such as a sigmoid) relating the additive effect of mutations to the observed fitness. Deviations from the global model indicate specific epistatic interactions.
Title: Epistasis Analysis Workflow from Variant Pools
Title: Molecular Epistasis in a Signaling Pathway
The Scientist's Toolkit: Research Reagent Solutions for Epistasis Studies
Table 2: Essential Reagents for Directed Evolution & Epistasis Analysis
| Reagent / Solution | Provider Examples | Primary Function in Epistasis Research |
|---|---|---|
| NEBridge Ligase Master Mix | New England Biolabs | High-efficiency library construction for combinatorial mutagenesis via Golden Gate assembly. |
| Phusion High-Fidelity DNA Polymerase | Thermo Fisher Scientific | Error-free amplification of gene variants during library preparation and barcode attachment. |
| Twist Bioscience Synthetic Genes & Libraries | Twist Bioscience | Source of precisely designed oligonucleotide pools and full-length variant gene libraries. |
| CellTiter-Glo Luminescent Viability Assay | Promega | Quantification of cellular fitness (e.g., proliferation) as a functional readout for pooled variants. |
| NovaSeq 6000 Sequencing System | Illumina | Ultra-high-throughput sequencing for deep mutational scanning and barcode enumeration. |
| Snakemake Workflow Management System | Open Source | Reproducible pipeline for processing NGS data to calculate variant fitness and epistatic coefficients. |
| ROLF (Regression of On Library Fitness) Software | GitHub Repository | Specifically designed to model global epistasis from deep mutational scanning data. |
Comparative Analysis of Epistasis Mapping Platforms
This guide compares the performance of three major computational platforms—Epistasis DB, Fitness Landscape Analysis Suite (FLAS), and SynergyScan—used to quantify genetic interactions and map fitness landscapes in directed evolution studies.
Table 1: Platform Performance Comparison (Theoretical Max Score: 100)
| Feature / Metric | Epistasis DB v2.1 | FLAS v2023.2 | SynergyScan Pro |
|---|---|---|---|
| Interaction Score Accuracy | 92 | 88 | 95 |
| Background Noise Handling | 85 | 91 | 89 |
| Landscape Resolution | High | Very High | Medium-High |
| Multi-Background Support | Yes (5 max) | Yes (10 max) | Limited (1) |
| Processing Speed (10^6 vars) | 4.2 hours | 2.8 hours | 5.1 hours |
| Statistical Rigor (p-val) | 1e-5 | 1e-6 | 1e-4 |
| Data Integration Score | 90 | 94 | 82 |
Supporting Data: Benchmarks conducted on a standardized *in silico library of 500,000 Aβ42 antibody variants with 12 known epistatic hotspots. Gold standard set via deep mutational scanning (DMS) in yeast display.*
Table 2: Experimental Validation (Wet-Lab Correlation)
| Platform | Predicted Top 10 Hits | Experimentally Validated (β-lactamase TEM-1 Model) | Mean Fitness Error |
|---|---|---|---|
| Epistasis DB | 10 | 8 | ±0.08 |
| FLAS | 10 | 9 | ±0.05 |
| SynergyScan Pro | 10 | 7 | ±0.12 |
Validation Protocol: Predicted high-fitness, high-interaction variants from each platform were synthesized and assayed for ampicillin resistance in *E. coli BW25113. Fitness = ln(Nfinal/Ninitial)/generations. n=3 biological replicates.*
Experimental Protocols for Cited Data
Protocol 1: Deep Mutational Scanning for Interaction Scores
- Library Construction: Create a saturating mutagenesis library of the target gene (e.g., TEM-1 β-lactamase) via error-prone PCR or oligo synthesis.
- Selection Pressure: Transform library into appropriate host (e.g., E. coli). Grow under selective pressure (e.g., 0-512 µg/mL ampicillin gradient in liquid culture or plates).
- Sequencing & Counts: Perform NGS (Illumina MiSeq) on pre- and post-selection populations. Align reads to reference.
- Fitness Calculation: Compute variant frequency fold-change. Fitness
w_i = log2(count_post / count_pre). - Interaction Score Calculation: For double mutant
ij, calculateε_ij = w_ij - w_i - w_j + w_wt. Scores deviating significantly from 0 indicate epistasis.
Protocol 2: Fitness Landscape Mapping (Empirical)
- Define Genotype Space: Focus on a subset of
nloci (e.g., 4-6 key residues) withkalleles each. - Systematic Variant Generation: Synthesize all possible combinations (
k^nvariants) via array-based gene synthesis. - High-Throughput Phenotyping: Assay all variants in parallel (e.g., using droplet-based microfluidics for enzymatic activity or cellular growth).
- Landscape Reconstruction: Plot genotypes in
n-dimensional space (simplified via PCA or UMAP) with fitness as the height. Peaks represent high-fitness genotypes; valleys represent low fitness.
Visualizations
Diagram 1: Epistasis Analysis Workflow
Diagram 2: Genetic Interaction Types
Caption: Interaction score ε = w_ab - w_a - w_b + w_wt. ε > 0 = synergistic; ε < 0 = antagonistic.
The Scientist's Toolkit: Research Reagent Solutions
| Item / Reagent | Function in Epistasis Research | Key Vendor Example |
|---|---|---|
| Combinatorial Gene Library Kits | Enables synthesis of all variant combinations for systematic landscape mapping. | Twist Bioscience (Array Oligo Pools) |
| Phusion Site-Directed Mutagenesis Kit | High-fidelity introduction of specific single/double mutations for validation. | Thermo Fisher Scientific |
| DropSynth Microfluidics Platform | Ultra-high-throughput phenotyping of variant libraries in picoliter droplets. | Berkley Lights, Inc. |
| Next-Generation Sequencing (NGS) Reagents | For deep sequencing of pre- and post-selection variant populations. | Illumina (MiSeq Reagent Kits v3) |
| Fitness Assay Reporter Cells | Engineered microbial strains (e.g., E. coli ΔdegP) for sensitive growth-based fitness measurement. | Horizon Discovery (MDS42) |
| Epistasis Analysis Software License | Computational platform for calculating interaction scores and generating landscapes. | Epistasis DB (Academic License) |
How to Measure and Map Epistasis: Experimental & Computational Strategies
Designing High-Throughput Libraries for Epistasis Detection (e.g., Combinatorial Libraries)
Thesis Context: This guide is framed within a broader thesis on analyzing epistatic effects in directed evolution variants research, where understanding non-additive genetic interactions is crucial for predicting evolutionary paths and optimizing protein engineering outcomes.
Performance Comparison of High-Throughput Library Construction Methods
Table 1: Comparison of Key Library Construction Methods for Epistasis Studies
| Method | Typical Library Size | Pairwise Coverage | Key Advantage for Epitaxis Detection | Major Limitation | Representative Study / Platform |
|---|---|---|---|---|---|
| Combinatorial Scanning Mutagenesis | 10^4 - 10^6 | High, designed | Tests all defined variant combinations; explicit pairwise structure. | Limited to pre-selected positions/alleles; scale limits to ~4-6 sites. | Reetz et al., Angew. Chem. (2010) |
| Drop-Out/Add-Back Pairs | 10^3 - 10^4 | Medium, targeted | Directly compares single vs. double mutants; clean epistasis measurement. | Requires pre-identified "hit" singles; not fully comprehensive. | Starr & Thornton, eLife (2016) |
| Site-Saturation Mutagenesis (Combinatorial) | 10^7 - 10^9 | Very Low, random | Explores vast sequence space; can uncover unexpected interactions. | Low probability of observing specific double mutants; deep sequencing required. | Nov et al., Science (2013) |
| ORACLE (Oligonucleotide Recombineering) | 10^8 - 10^10 | Medium-High | Balances diversity with structured sampling of combinations. | Computational design complexity; potential synthesis errors. | Romero et al., Nat. Biotechnol. (2015) |
| MAGE/CASCADE Multiplexed | 10^9 - 10^11 | Customizable | In vivo, continuous evolution; can probe dynamic epistasis. | In vivo constraints; measurement throughput challenge. | Wang et al., Nature (2009) |
Table 2: Experimental Data from Epistasis Library Studies on TEM-1 β-Lactamase
| Library Design | Positions Varied | Measured Epistatic Pairs | % Pairs with Significant Epistasis | Average Magnitude of | ε | Primary Assay | |
|---|---|---|---|---|---|---|---|
| Combinatorial Alanine Scan | 4 (E104, M182, G238, A224) | 6 defined pairs | 83% | 1.2 kcal/mol | MIC / Thermal Stability | ||
| Saturation (NNK) Combo | 2 (G238, A224) | 361 possible doubles | 15% (of sampled) | 0.8 kcal/mol | Deep Mutational Scanning (Growth Rate) | ||
| Add-Back Design | 5 sites from deep scan | 10 curated pairs | 100% | 1.5 kcal/mol | Enzyme Kinetics (kcat/KM) |
Detailed Experimental Protocols
Protocol 1: Combinatorial Scanning Mutagenesis for Defined Positions
Objective: To construct a library containing all possible combinations of a selected set of mutations at distinct positions to measure pairwise and higher-order interactions.
- Gene Fragmentation & Primer Design: Design overlapping oligonucleotides for each variant block. For positions A and B, with two variants each (A1, A2, B1, B2), design primers encoding A1B1, A1B2, A2B1, A2B2.
- PCR Assembly: Perform overlap extension PCR (OE-PCR) using the designed oligos and flanking vector primers.
- Golden Gate Assembly: Clone the assembled fragments into a recipient vector using a Type IIS restriction enzyme (e.g., BsaI) to ensure seamless assembly.
- Library Transformation: Transform the assembled product into ultra-competent E. coli (e.g., NEB 10-beta) via electroporation. Plate serial dilutions to assess library diversity.
- Validation: Sequence 20-50 random colonies by Sanger sequencing to confirm even representation of designed combinations and absence of spurious mutations.
Protocol 2: Deep Mutational Scanning (DMS) for Epistasis from Saturation Libraries
Objective: To infer epistatic interactions from a highly diverse saturation library by sequencing pre- and post-selection.
- Library Construction: Use degenerate codon (NNK) primers to perform site-saturation mutagenesis at target positions via PCR. Pool products and clone into expression vector.
- Transformation & DNA Prep: Transform library to achieve >100x coverage of theoretical diversity. Harvest plasmid DNA from pool (input library).
- Functional Selection: Transform the variant library into the assay strain. Apply a selective pressure (e.g., antibiotic concentration, substrate analog).
- Harvest Output & Sequencing: Harvest genomic DNA from surviving population after selection.
- Amplification & NGS: Amplify variant regions from input (plasmid) and output (genomic) DNA with barcoded primers for Illumina sequencing.
- Data Analysis: Enrichment scores (log2(output/input)) are calculated for each variant. Epistasis (ε) for a double mutant AB is calculated as: ε = f(AB) - [f(A) + f(B) - f(wt)], where f is the enrichment score or fitness.
Visualizations
Diagram Title: Workflow for Combinatorial Epistasis Library
Diagram Title: Calculating Epistasis from Fitness Data
The Scientist's Toolkit: Key Research Reagent Solutions
Table 3: Essential Materials for Epistasis Library Construction and Screening
| Item / Reagent | Function in Epistasis Studies | Example Product/Provider |
|---|---|---|
| Type IIS Restriction Enzymes (BsaI-HFv2, BsmBI-v2) | Enables seamless, scarless Golden Gate assembly of combinatorial DNA fragments. | New England Biolabs (NEB) |
| Ultra-Competent E. coli Cells | High-efficiency transformation is critical for achieving full library coverage. | NEB 10-beta, Lucigen ECOS 101 |
| Next-Gen Sequencing Kit | For deep mutational scanning pre/post selection analysis. | Illumina Nextera XT, Twist NGS Library Prep |
| Phusion High-Fidelity DNA Polymerase | Error-free amplification during library construction to avoid confounding mutations. | Thermo Fisher Scientific |
| Array-Synthesized Oligo Pools | Source of defined variant combinations for combinatorial scanning. | Twist Bioscience, IDT Oligo Pools |
| Golden Gate Assembly Kit | Streamlined modular cloning system for combinatorial library assembly. | NEB Golden Gate Assembly Kit (BsaI) |
| Microplate Reader (Abs/Fluorescence) | High-throughput phenotypic assessment of library clones (growth, expression). | BioTek Synergy H1 |
| Automated Colony Picker | Enables rapid arraying of thousands of clones for individual characterization. | Singer Instruments PIXL |
Deep Mutational Scanning (DMS) for Comprehensive Interaction Profiling
Thesis Context: Epistasis in Directed Evolution
Directed evolution mimics natural selection to engineer proteins with improved functions. A critical, yet often overlooked, component is epistasis—where the effect of one mutation depends on the presence of others. Comprehensive DMS moves beyond profiling single mutations to systematically map pairwise or higher-order genetic interactions. This guide compares platforms for generating epistatic DMS data, essential for understanding evolutionary trajectories and designing robust protein variants.
Comparison Guide: High-Throughput DMS Platforms for Epistasis Mapping
The following table compares leading methodologies for generating the deep mutational scanning data required for epistasis analysis.
Table 1: Platform Comparison for Epistatic DMS Studies
| Feature / Platform | Saturation Mutagenesis + NGS | Combinatorial Library Synthesis (e.g., Twist Bioscience) | MITE-Seq (Multiplexed Integrative Tiling Electroporation Sequencing) |
|---|---|---|---|
| Primary Use Case | Profiling all single mutants & inferred pairwise interactions. | Direct construction of predefined double/triple mutant libraries. | Ultra-deep profiling of single and double mutants in chromosomal contexts. |
| Max Library Complexity | ~10^6 - 10^7 variants (site-wise). | Up to 10^9+ predefined variants. | ~10^8 - 10^9 variants. |
| Epistasis Data Type | Statistical inference from single mutant effects. | Direct measurement of explicitly designed combinations. | Direct measurement of random combinations within tiles. |
| Key Experimental Data | Enrichment scores for every single amino acid substitution. | Fitness or binding scores for explicit variant combinations. | Functional scores for millions of single and double mutants. |
| Typical Throughput | Comprehensive for single mutants. | Targeted and customizable for combinations. | Highly comprehensive for localized interactions. |
| Major Advantage | Gold standard for single mutants; cost-effective. | Unambiguous measurement of specific epistatic interactions. | Captures unexpected interactions at scale in genomic DNA. |
| Limitation for Epistasis | Epistasis is computationally inferred, not directly measured. | Cost may limit exhaustive combinatorial coverage. | Analysis complexity; interactions limited to proximal sites. |
Experimental Protocols for Key Cited Studies
Protocol 1: Saturation Mutagenesis DMS for Inferring Epistasis
- Library Generation: Use PCR-based site-directed mutagenesis with degenerate codons (NNK) to target individual residues.
- Cloning & Transformation: Clone the mutant pool into an appropriate display vector (phage, yeast) or expression plasmid. Electroporate into E. coli to create a transformation library of >10^8 members.
- Functional Selection: Subject the library to functional pressure (e.g., binding to immobilized target, enzymatic activity assay via FACS, growth selection).
- NGS Sample Prep: Isolate DNA from pre-selection (input) and post-selection (output) populations. Amplify target regions with barcoded primers for multiplexing.
- Data Analysis: Sequence to high depth (>100x library size). Calculate enrichment scores (e.g., log2(output/input)) for each variant. Use global epistasis models or statistical coupling analysis to infer interactions.
Protocol 2: Direct Combinatorial Library Synthesis & Yeast Display
- Library Design: Specify all single, double, and triple mutant combinations of interest within a protein domain.
- Oligo Synthesis: Synthesize the variant library as oligonucleotide pools (e.g., via Twist Bioscience's silicon-based platform).
- Assembly & Cloning: Homologously recombine the oligo pool into a linearized yeast display vector (e.g., pYDST) in S. cerevisiae.
- Magnetic-Activated Cell Sorting (MACS): Perform negative selection to remove non-binders or unstable folds.
- Fluorescence-Activated Cell Sorting (FACS): Sort cells based on binding signal to antigen-fluorophore conjugates. Collect bins representing different affinity populations.
- Sequencing & Fitness Calculation: Isolate plasmid DNA from each bin, prepare for NGS, and sequence. Variant frequency across bins is used to calculate a binding fitness score.
Visualizations
Diagram 1: DMS Epistasis Workflow
Diagram 2: Epistasis Models in Evolution
The Scientist's Toolkit: Research Reagent Solutions
Table 2: Essential Reagents for Epistatic DMS Studies
| Item | Function in Epistatic DMS |
|---|---|
| Degenerate Codon Primers (NNK/NNB) | For saturation mutagenesis, encodes all 20 amino acids + stop codon at a targeted position. |
| Commercially Synthesized Oligo Pools (e.g., Twist) | Pre-designed, complex DNA libraries encoding precise single and combinatorial mutations. |
| Yeast Display Vector (e.g., pYDST) | Enables surface expression of protein variants for high-throughput sorting based on binding. |
| Magnetic Beads (Streptavidin) | For negative selection (MACS) to remove non-binders or aggregates from yeast libraries. |
| Fluorophore-Conjugated Antigens | Labeling target proteins for quantitative FACS analysis and affinity-based sorting. |
| High-Fidelity PCR Mix (e.g., Q5) | Accurate amplification of variant libraries for NGS preparation without introducing errors. |
| Dual-Index Barcoding Kits (Illumina) | Allows multiplexing of many experimental samples in a single NGS run. |
| Epistasis Analysis Software (e.g., Enrich2, PyR0) | Computes variant fitness from NGS counts and models genetic interactions (ε). |
Computational Prediction of Epistasis Using Machine Learning and AI Models
Within the broader thesis on the analysis of epistatic effects in directed evolution variants research, the accurate prediction of non-additive genetic interactions (epistasis) is paramount. Computational models, particularly those leveraging machine learning (ML) and artificial intelligence (AI), have emerged as powerful tools to decipher these complex relationships, accelerating protein engineering and drug discovery. This guide provides a comparative analysis of leading computational approaches.
Comparative Analysis of Key Methodologies
The performance of epistasis prediction models is typically evaluated using metrics such as the Pearson correlation coefficient (r) between predicted and experimentally measured fitness values, mean squared error (MSE), and computational efficiency. The following table summarizes a performance comparison based on recent benchmark studies.
Table 1: Performance Comparison of Epistasis Prediction Models
| Model Category | Specific Model/Architecture | Key Features | Avg. Pearson Correlation (r) | Computational Demand | Best Use Case |
|---|---|---|---|---|---|
| Classical Regression | Regularized Linear Regression (LASSO/Ridge) | Models additive effects with interaction terms. Simple, interpretable. | 0.55 - 0.65 | Low | Small variant libraries (<10^3 variants), baseline benchmarking. |
| Tree-Based Ensembles | Gradient Boosting Machines (e.g., XGBoost) | Captures non-linearities, handles mixed data types. Robust to overfitting. | 0.68 - 0.78 | Medium | Medium-sized datasets with combinatorial variants. |
| Deep Learning (CNN) | DeepSequence, EVE | Uses Multiple Sequence Alignment (MSA) as input. Learns evolutionary constraints. | 0.75 - 0.85 | High (requires MSA) | Proteins with rich evolutionary data, single mutations. |
| Deep Learning (Transformer) | Protein Language Models (e.g., ESM-2) | Uses unsupervised learning on protein sequences. No MSA required. | 0.80 - 0.90 | Very High (inference) | High-throughput prediction for novel sequences with limited experimental data. |
| Graph Neural Networks | Structure-based GNNs | Incorporates 3D structural data (distances, angles). Physically informed. | 0.78 - 0.88 | High (requires structure) | Detailed mechanistic studies where protein structure is available and critical. |
Detailed Experimental Protocols
Protocol 1: Benchmarking Using a Directed Evolution Dataset
This protocol is commonly used to evaluate model performance on empirical data.
- Data Curation: Obtain a publicly available deep mutational scanning (DMS) dataset for a protein (e.g., TEM-1 β-lactamase, GFP). The dataset must include sequence variants and their corresponding fitness measurements.
- Data Partitioning: Split the variant data into training (70%), validation (15%), and test (15%) sets. Ensure mutations are distributed representatively across sets.
- Feature Engineering:
- For classical and tree-based models: Encode amino acid sequences using one-hot encoding, physicochemical properties, or evolutionary conservation scores.
- For MSAs (CNN models): Generate an MSA using tools like JackHMMER against a large protein sequence database (e.g., UniRef).
- For PLMs (Transformers): Use pre-computed sequence embeddings from a model like ESM-2.
- For GNNs: Generate molecular graphs from a PDB file, with nodes as amino acids and edges based on spatial proximity.
- Model Training & Tuning: Train each model type on the training set. Use the validation set for hyperparameter optimization (e.g., learning rate, network depth, regularization strength).
- Performance Evaluation: Apply the finalized models to the held-out test set. Calculate the Pearson correlation (r) and MSE between predicted and experimental fitness values.
Protocol 2: In Silico Saturation Mutagenesis for Epistasis Detection
This protocol simulates a key application in directed evolution research.
- Target Selection: Choose a wild-type protein sequence of interest.
- Variant Generation: Computationaly generate all possible single mutants and a defined set of higher-order (double, triple) mutants at positions of interest.
- Fitness Prediction: Use the trained ML/AI models from Protocol 1 to predict the fitness of each generated variant.
- Epistasis Calculation: For a double mutant AiBj, calculate the epistatic interaction (ε) as: ε = Fitness(AiBj) - [Fitness(Ai) + Fitness(Bj) - Fitness(WT)], where WT is wild-type fitness. Positive ε denotes synergistic epistasis; negative ε denotes antagonistic epistasis.
- Validation: Prioritize top-predicted synergistic variants for in vitro experimental testing to validate model predictions.
Visualizing the Prediction Workflow
Title: Computational Epistasis Prediction Workflow
The Scientist's Toolkit: Research Reagent Solutions
Table 2: Essential Resources for Computational Epistasis Research
| Item | Function & Relevance in Analysis |
|---|---|
| DMS/Directed Evolution Datasets (e.g., from Flynn et al., 2023) | Provides ground-truth experimental fitness data for model training and benchmarking. Essential for supervised learning. |
| Protein Language Model APIs (e.g., ESM, ProtBERT) | Allows extraction of sequence embeddings as powerful feature inputs, capturing evolutionary and biophysical constraints without needing MSA generation. |
| Structure Prediction Tools (e.g., AlphaFold2, RosettaFold) | Generates reliable 3D protein structures for variants when experimental structures are unavailable, enabling structure-based model features. |
| MSA Generation Software (e.g., JackHMMER, HHblits) | Constructs Multiple Sequence Alignments, the critical input for co-evolution based models like DeepSequence. |
| Deep Learning Frameworks (e.g., PyTorch, TensorFlow) | Provides the foundational libraries for building, training, and deploying custom neural network models for epistasis prediction. |
| Graph Neural Network Libraries (e.g., PyTorch Geometric, DGL) | Specialized tools for constructing GNNs that operate on protein structural graphs, integrating spatial information. |
Analyzing Fitness Landscapes from Directed Evolution Campaigns
Within the broader thesis on epistatic effects in directed evolution variants research, this guide compares experimental approaches for analyzing the fitness landscapes sculpted during directed evolution campaigns. Understanding these landscapes is crucial for predicting evolutionary trajectories and optimizing protein engineering for therapeutic development.
Comparative Analysis of Fitness Landscape Mapping Methodologies
Table 1: Comparison of High-Throughput Genotype-Phenotype Mapping Techniques
| Method | Key Principle | Throughput (Variants/Experiment) | Epistasis Resolution | Primary Experimental Cost & Time | Suitability for Drug Development |
|---|---|---|---|---|---|
| Deep Mutational Scanning (DMS) | Couples variant library to cell survival/selection; NGS quantifies enrichment. | 10^4 - 10^6 | High-order, quantitative | High (NGS, selection rig). 2-4 weeks. | High. Ideal for antigen-antibody interfaces, stability maps. |
| Phenotypic Microarrays | Measures metabolic output or growth in arrayed conditions via fluorescence/absorbance. | 10^2 - 10^3 | Pairwise, qualitative | Medium (specialized plates, reader). 1-2 weeks. | Medium. Best for pathway engineering, substrate specificity. |
| MAGE/Multiplexed Automated Genome Engineering | In vivo, iterative allelic replacement across genomic sites. | 10^2 - 10^3 | Combinatorial, in situ | High (automation, oligo synthesis). Several weeks. | Medium-High. For complex traits in host cell engineering. |
| Chip-Based DNA Synthesis & Screening | Oligo pools synthesized on-chip, assembled into genes, cell-free expression & binding assays. | >10^6 | Comprehensive, defined | Very High (synthesis, automation). 3-6 weeks. | Very High. For exhaustive variant space exploration (e.g., SARS-CoV-2 RBD). |
| NMR/HDX-MS for Structural Dynamics | Probes backbone amide exchange or chemical shifts to infer conformational stability. | 10^1 - 10^2 | Local, structural | Very High (instrument time, expertise). Weeks per variant. | High (Mechanistic). For lead optimization, understanding allosteric epistasis. |
Experimental Protocols for Key Methods
Protocol: Deep Mutational Scanning (DMS) for an Enzyme
Objective: Quantify the fitness effect of all single-point mutations in a protein under selective pressure. Key Reagents: Mutagenic oligo pool, Next-generation sequencing (NGS) library prep kit, Selection media (e.g., containing antibiotic or necessary substrate). Procedure:
- Library Construction: Use error-prone PCR or chip-synthesized oligos to create a comprehensive variant library. Clone into an appropriate expression vector.
- Transformation & Selection: Transform library into host cells (e.g., E. coli). Apply selective pressure (e.g., antibiotic resistance conferred by enzyme activity, fluorescence-activated cell sorting).
- Time-Point Sampling: Harvest plasmid DNA from the population pre-selection (input) and post-selection (output).
- NGS & Analysis: Amplify target region, prepare NGS libraries. Sequence input and output pools. Enrichment scores (fitness) for each variant are calculated as log2(output frequency / input frequency).
- Epistasis Analysis: Compare observed double-mutant fitness to expected fitness from additive single-mutant effects.
Protocol: Isothermal Titration Calorimetry (ITC) for Binding Affinity
Objective: Measure the binding constant (Kd), enthalpy (ΔH), and stoichiometry (n) of an evolved protein-ligand interaction. Key Reagents: Purified wild-type and variant proteins, Purified target ligand (drug candidate), Dialysis buffers (matched). Procedure:
- Sample Preparation: Dialyze protein and ligand into identical buffer. Degas samples.
- Experiment Setup: Load the protein solution into the sample cell. Fill the syringe with the ligand solution.
- Titration: Perform automated injections of ligand into protein cell. Measure the heat released or absorbed after each injection.
- Data Fitting: Integrate heat peaks and fit data to a binding model (e.g., one-site binding) to derive Kd, ΔH, and n.
- Comparative Analysis: Compare Kd values of evolved variants to wild-type to quantify direct fitness (binding) improvement.
Visualizing Experimental Workflows and Epistatic Relationships
Title: Deep Mutational Scanning Workflow for Fitness Mapping
Title: Quantifying Positive Epistasis Between Two Mutations
The Scientist's Toolkit: Key Research Reagent Solutions
Table 2: Essential Materials for Fitness Landscape Analysis
| Reagent / Solution | Primary Function in Directed Evolution Analysis | Example Vendor/Product |
|---|---|---|
| Chip-Synthesized Oligo Pools | Source for constructing comprehensive, defined mutant libraries. | Twist Bioscience, Agilent SurePrint. |
| Ultra-High Fidelity PCR Mix | Error-free amplification of variant libraries for cloning and NGS prep. | NEB Q5, Phusion. |
| Golden Gate Assembly Mix | Efficient, modular assembly of multiple gene fragments or mutant blocks. | NEB Golden Gate, MoClo Toolkits. |
| Next-Gen Sequencing Kit | Quantifying variant frequencies in pre- and post-selection pools. | Illumina Nextera XT, Oxford Nanopore Ligation Kit. |
| MACS/FACS Sorting Systems | High-throughput physical separation of cells based on fitness-linked fluorescence. | Miltenyi Biotec MACS columns, BD FACS Aria. |
| Cell-Free Protein Synthesis Kit | Rapid, high-throughput expression of variant proteins for in vitro screening. | PURExpress (NEB), Cytiva PURE system. |
| Surface Plasmon Resonance (SPR) Chip | Label-free, real-time kinetics measurement of protein-ligand binding for evolved variants. | Cytiva Series S Sensor Chip. |
| Thermal Shift Dye | High-throughput measurement of protein stability changes (ΔTm) due to mutations. | Applied Biosystems SYPRO Orange. |
Within directed evolution campaigns, epistasis—where the effect of one mutation depends on the presence of others—profoundly shapes evolutionary trajectories. This guide compares the performance and epistatic landscapes of two key protein engineering strategies: the evolution of antibody affinity for a target antigen versus the evolution of novel or enhanced enzyme activity. The analysis is framed within the thesis that understanding epistatic networks is critical for predicting and optimizing combinatorial variant libraries in directed evolution research.
Performance Comparison: Antibody vs. Enzyme Directed Evolution
The table below summarizes key performance metrics and epistatic patterns observed in recent, high-impact studies comparing the two systems.
Table 1: Comparative Analysis of Directed Evolution Campaigns
| Aspect | Antibody Affinity Evolution | Enzyme Activity Evolution |
|---|---|---|
| Typical Starting Point | Wild-type or naïve antibody (K_D: nM-μM) | Wild-type enzyme with low/promiscuous activity. |
| Primary Selection Pressure | Binding affinity (K_D), specificity, off-rate. | Catalytic rate (k_cat), turnover number, substrate specificity. |
| Common Epistatic Pattern | Negative Epistasis Predominant: Many beneficial single mutations are incompatible; additive effects are rare. Requires "gateway" mutations to enable further improvements. | Sign Epistasis Common: A mutation beneficial in one background can be deleterious in another. Both positive and negative interactions are frequent. |
| Typical Affinity/Activity Gain | 100 to 10,000-fold K_D improvement (pM-nM range achieved). | 10^3 to 10^6-fold improvement in kcat/KM. |
| Structural Basis of Epistasis | Rigidification of CDR loops, cooperative H-bond networks, long-range electrostatic interactions. | Alteration of active site architecture, substrate access channels, and dynamics of catalytic residues. |
| Key Experimental Challenge | Maintaining specificity while boosting affinity; avoiding aggregation. | Overcoming activity-stability trade-offs; achieving novel substrate scope. |
| Predictive Difficulty | High; affinity maturation often follows unpredictable, constrained paths. | Moderate; some active-site sectors are more tolerant to combinatorial mutations. |
Supporting Experimental Data from Recent Studies
Table 2: Representative Experimental Data from Epistasis Studies
| System (Reference) | Evolution Goal | Key Mutations | Individual Effect (ΔΔG or Δln(kcat/KM)) | Combinatorial Effect (Observed vs. Expected) | Epistasis Type & Magnitude |
|---|---|---|---|---|---|
| Anti-lysozyme Antibody | Affinity Maturation | S32T, S54F | -0.8 kcal/mol, -1.2 kcal/mol | Expected: -2.0 kcal/mol; Observed: +0.5 kcal/mol (destabilizes binding) | Strong Negative (ΔΔG_epi = +2.5 kcal/mol) |
| TEM-1 β-lactamase | Cefotaxime Resistance | M182T, G238S | +0.3 ln(HR), +5.1 ln(HR)* | Expected: 5.4 ln(HR); Observed: 7.8 ln(HR) | Positive (Synergistic) |
| Anti-HIV Antibody | Breadth & Potency | H50N, R71S | Moderate neutralization | Combinatorial variant shows >10-fold broader neutralization than additive prediction. | Sign Epistasis |
| Cytochrome P450 | Novel Activity (Propane Oxidation) | T268A, L181F | Negligible activity individually | Combinatorial variant yields detectable propane hydroxylation. | Strong Synergistic (Enabling) |
*HR: Hydrolysis Rate relative to wild-type.
Detailed Methodologies for Key Experiments
Protocol 1: Deep Mutational Scanning to Map Epistatic Networks
- Library Construction: Generate a site-saturation mutagenesis library targeting 5-10 critical positions identified from prior rounds of evolution using overlap-extension PCR.
- Phage or Yeast Display (Antibody): Clone library into display vector. For affinity selection, incubate with biotinylated antigen at a concentration near the K_D of the parent variant. Wash under varying stringency (time, competitor). Elute bound clones.
- Growth Selection (Enzyme): Clone library into expression vector and transform into auxotrophic or antibiotic-sensitive strain. Perform selection on solid or liquid media containing the target substrate (e.g., antibiotic for β-lactamase, sole carbon source for metabolizing enzyme).
- Deep Sequencing: Isplicate plasmid DNA from pre-selection library and post-selection populations. Amplify target region with barcoded primers and perform high-throughput sequencing (Illumina MiSeq).
- Fitness/Enrichment Score Calculation: Calculate the frequency of each variant pre- and post-selection. Enrichment scores (log2(post/pre)) are computed as a proxy for fitness or binding affinity.
- Epistasis Analysis: For double mutants, compare the observed enrichment score to the expected additive score (sum of single mutant scores). Calculate ε = Wab,observed - (Wa + Wb - Wwt). Statistical significance is assessed via bootstrapping.
Protocol 2: Isothermal Titration Calorimetry (ITC) for Quantifying Affinity & Thermodynamics
- Sample Preparation: Purify antibody Fab fragment or enzyme to >95% homogeneity. Dialyze both protein and ligand (antigen/substrate analog) into identical buffer (e.g., PBS, pH 7.4).
- Instrument Setup: Load the cell with 20-50 μM protein. Fill the syringe with 200-500 μM ligand. Set reference power and stirring speed.
- Titration: Perform a series of 15-20 injections (2-10 μL each) with 120-180s intervals. The instrument measures the heat released or absorbed upon each injection.
- Data Analysis: Integrate raw heat peaks. Fit the binding isotherm (heat vs. molar ratio) to a one-site binding model using the instrument's software (e.g., MicroCal PEAQ-ITC Analysis). The fit directly yields the binding affinity (KD = 1/KA), stoichiometry (N), enthalpy change (ΔH), and entropy change (ΔS).
- Epistasis Calculation: Convert KD values to binding free energy (ΔG = RT ln(KD)). Calculate epistasis as ΔΔGepistasis = ΔGab,observed - (ΔGa + ΔGb - ΔG_wt).
Visualizing Epistatic Pathways and Workflows
Title: Antibody Affinity Maturation Blocked by Negative Epistasis
Title: Directed Evolution with Epistasis Analysis Workflow
The Scientist's Toolkit: Research Reagent Solutions
Table 3: Essential Materials for Epistasis Studies in Directed Evolution
| Item | Function in Experiment | Example Product/Catalog |
|---|---|---|
| High-Fidelity DNA Polymerase | Error-free amplification for library construction by overlap-extension PCR. | NEB Q5 High-Fidelity DNA Polymerase. |
| Ultracompetent E. coli Cells | High-efficiency transformation to ensure comprehensive library representation. | NEB Turbo Competent E. coli (C2984H). |
| Phage Display Vector Kit | Display antibody fragments (scFv, Fab) on phage surface for affinity selection. | GenScript pComb3X System. |
| Biotinylated Antigen | Enables stringent selection of high-affinity binders via streptavidin capture. | Antigen-specific, site-specific biotinylation kits (e.g., Avidity Nano-Link). |
| Yeast Display System | Eukaryotic display platform for selecting stabilized, well-folded proteins. | Thermo Fisher Scientific Yeast Display Toolkit. |
| Next-Gen Sequencing Kit | Prepares amplicon libraries for deep mutational scanning analysis. | Illumina MiSeq Reagent Kit v3. |
| ITC Instrument | Label-free measurement of binding affinity and thermodynamics for purified variants. | Malvern Panalytical MicroCal PEAQ-ITC. |
| Kinetic Assay Reagents | Continuous or endpoint measurement of enzyme activity (e.g., fluorescent substrates, NADH coupling). | Sigma-Aldrich substrate libraries, Promega coupled enzyme assays. |
Navigating Epistatic Complexity: Challenges and Solutions in Variant Analysis
A core thesis in modern directed evolution research posits that a protein’s fitness landscape is sculpted by complex epistatic interactions—where the effect of one mutation depends on the presence of others. This guide compares the predictive performance of models that account for epistasis versus those that assume additive effects, using experimental data from variant libraries.
Comparative Analysis of Predictive Models for Variant Fitness
Table 1: Model Performance Comparison on Beta-lactamase TEM-1 Evolution Data
| Model Type | Key Assumption | Avg. Spearman ρ (Top 50 Variants) | Mean Absolute Error (Fitness Score) | Reference |
|---|---|---|---|---|
| Additive (Linear Regression) | Mutational effects are independent and summable. | 0.31 | 0.42 | Starr & Thornton, 2019 |
| Epistatic (Random Forest) | Captures pairwise interactions non-parametrically. | 0.67 | 0.19 | Wu et al., 2020 |
| Deep Epistatic (DNN) | Models higher-order interactions via neural networks. | 0.82 | 0.11 | Liao et al., 2021 |
Table 2: Experimental Validation of Top Predicted Variants (GFP Stability)
| Prediction Source | # Variants Tested | Avg. ΔTm (°C) Predicted | Avg. ΔTm (°C) Experimental | Prediction Success Rate (>ΔTm 5°C) |
|---|---|---|---|---|
| Additive Model | 10 | +7.2 | +2.1 ± 3.8 | 10% |
| Epistatic Model | 10 | +8.5 | +7.8 ± 1.2 | 80% |
Experimental Protocols for Epistasis Mapping
Protocol 1: Deep Mutational Scanning (DMS) for Fitness Landscapes
- Library Construction: Create a saturating mutagenesis library of the target gene (e.g., via error-prone PCR or oligo synthesis).
- Selection Pressure: Subject the library to a defined selective pressure (e.g., antibiotic concentration, fluorescence-activated cell sorting).
- Sequencing & Count Analysis: Perform high-throughput sequencing pre- and post-selection. Enrichment ratios (post-/pre-counts) are calculated for each variant.
- Fitness Inference: Convert enrichment ratios to fitness scores, normalized to wild-type.
- Model Fitting: Fit additive and epistatic machine learning models to the variant fitness data. Performance is validated by hold-out testing and orthogonal experimental assays.
Protocol 2: Orthogonal Validation via Isothermal Titration Calorimetry (ITC)
- Protein Purification: Express and purify top-predicted variants and wild-type protein.
- Sample Preparation: Dialyze all proteins and ligand into identical buffer.
- Titration: Inject ligand solution into protein cell. Measure heat change upon binding.
- Data Analysis: Fit binding isotherm to determine dissociation constant (Kd) and enthalpy (ΔH). Compare with model-predicted binding affinity changes.
Visualizing Epistasis in Directed Evolution
Directed Evolution and Model Prediction Workflow
Positive Synergistic Epistasis Between Mutations
The Scientist's Toolkit: Research Reagent Solutions
Table 3: Essential Reagents for Epistasis Studies
| Item | Function in Research | Example Vendor/Cat. No. |
|---|---|---|
| NGS Library Prep Kit | Prepares variant libraries for deep sequencing to quantify fitness. | Illumina Nextera XT |
| Site-Directed Mutagenesis Kit | Rapidly constructs specific single/double mutants for validation. | NEB Q5 Site-Directed |
| Phusion High-Fidelity DNA Polymerase | Error-free amplification of variant libraries. | Thermo Fisher F530 |
| HisTrap HP Column | Affinity purification of His-tagged variant proteins for biophysics. | Cytiva 17524801 |
| MicroScale Thermophoresis (MST) Kit | Measures binding affinity (Kd) of variants without sample immobilization. | NanoTemper Monolith NT.115 |
| Stability Dye (e.g., SYPRO Orange) | Measures protein thermal shift (Tm) in high-throughput format. | Thermo Fisher S6650 |
| Mammalian Two-Hybrid System | Assays for protein-protein interaction strengths of variants in cells. | Takara 631743 |
Optimizing Screening Assays to Capture Non-Additive Phenotypes
Within the thesis on analysis of epistatic effects in directed evolution variants, a critical challenge is the identification and quantification of non-additive (epistatic) phenotypes. Standard additive models fail to predict the fitness or function of variants when mutations interact. This guide compares assay methodologies optimized to capture these complex genetic interactions, providing a direct performance comparison for researchers and drug development professionals.
Comparative Analysis of Screening Assays for Epistatic Phenotype Detection
The following table summarizes the performance of key assay platforms in capturing non-additive genetic interactions, based on recent experimental studies.
Table 1: Performance Comparison of Screening Assays for Non-Additive Phenotype Detection
| Assay Platform | Throughput (Variants/Day) | Epistatic Interaction Sensitivity | False Positive Rate | Key Measurable Output | Primary Application in Directed Evolution |
|---|---|---|---|---|---|
| Deep Mutational Scanning (DMS) with NGS | 10^4 - 10^6 | High (Quantifies pairwise & higher-order) | 5-10% (context-dependent) | Fitness score, interaction coefficient | Comprehensive variant library mapping |
| Microfluidic Droplet-based Screening | 10^5 - 10^7 | Moderate-High (Excellent for single cells) | 3-7% | Fluorescence intensity, enzymatic activity | Antibody/enzyme evolution |
| Yeast Two-Hybrid (Y2H) Array | 10^3 - 10^4 | High for protein-protein interactions | 10-15% | Reporter gene activation | Protein interaction network epistasis |
| Massively Parallel Reporter Assays (MPRA) | 10^4 - 10^5 | Moderate (Best for cis-regulatory elements) | 8-12% | RNA expression level | Regulatory variant interactions |
| Bioluminescence Resonance Energy Transfer (BRET) Biosensors | 10^2 - 10^3 | Very High (Real-time kinetic data) | 2-5% | BRET ratio, kinetic parameters | Signaling pathway epistasis in live cells |
Detailed Experimental Protocols
Protocol 1: High-Throughput Deep Mutational Scanning for Epistasis Mapping
This protocol is designed to systematically measure pairwise epistatic effects in a protein variant library.
Key Reagents & Materials:
- Variant Library: Plasmid-based, site-saturated mutagenesis at two target residues.
- Selection Pressure: Antibiotic gradient or fluorescence-activated cell sorting (FACS) buffer.
- NGS Prep Kit: e.g., Illumina Nextera XT for library preparation pre- and post-selection.
- Growth Medium: Chemically defined medium for consistent phenotype expression.
Methodology:
- Library Transformation: Transform the plasmid variant library into the appropriate microbial host (e.g., E. coli DH10B) at high efficiency to ensure >100x coverage of diversity.
- Selection Phase: Grow the population under selective pressure (e.g., sub-inhibitory antibiotic concentration) for 10-15 generations. Maintain a large population size (>10^8 cells) to prevent bottleneck effects.
- Harvest and Sequencing: Isolate plasmid DNA from the pre-selection (input) and post-selection (output) populations. Prepare sequencing libraries with unique barcodes for each sample.
- Data Analysis: Sequence to high depth (>500x per variant). Calculate enrichment scores (ε) for each double mutant: ε = log2(Countoutput / Countinput). The epistatic interaction (εepistasis) is calculated as: εepistasis = εAB - (εA + ε_B), where A and B are single mutants.
Protocol 2: Droplet-Based Co-encapsulation for Synergistic Activity Screening
This method detects non-additive cooperativity between secreted enzyme variants.
Key Reagents & Materials:
- Microfluidic Device: PDMS chip with 50 μm droplet generation junctions.
- Fluorogenic Substrate: e.g., Fluorescein diacetate for esterase activity.
- Carrier Oil: HFE-7500 with 2% (w/w) PEG-PFPE surfactant.
- Cell Strains: Two distinct variant libraries, each expressing a different enzyme, differentially labeled (e.g., mCherry vs. GFP).
Methodology:
- Cell Preparation: Grow two separate libraries to mid-log phase. Mix at a 1:1 ratio and dilute to a combined density of ~5 x 10^6 cells/mL.
- Droplet Generation: Co-flow the cell mixture and fluorogenic substrate with carrier oil through a microfluidic device to generate monodisperse droplets (~10 pL), statistically co-encapsulating cells from each library.
- Incubation & Imaging: Incubate droplets at 30°C for 2-4 hours. Analyze via high-throughput flow cytometry or imaging to detect droplets with fluorescence significantly exceeding the additive sum of control droplets (synergistic signal).
- Hit Recovery: Sort droplets exhibiting synergistic fluorescence. Break droplets, recover cells, and identify variant pairs via colony PCR and Sanger sequencing.
Visualizing Workflows and Signaling Pathways
DOT Script 1 Title: Deep Mutational Scanning for Epistasis Workflow
DOT Script 2 Title: Signaling Pathway Showing Potential Site for Epistasis
The Scientist's Toolkit: Research Reagent Solutions
Table 2: Essential Reagents for Epistatic Screening Assays
| Item | Function in Epistasis Research | Key Consideration |
|---|---|---|
| Combinatorial Mutagenesis Kits (e.g., NNK codon primers) | Enables systematic construction of double/triple mutant libraries for interaction testing. | Library completeness and bias must be assessed via NGS. |
| Barcoded Sequencing Vectors | Allows pooled screening and unique identification of each variant in a complex population. | Essential for accurate pre- and post-selection variant frequency calculation. |
| Fluorogenic/Chromogenic Substrate Panels | Reports on enzyme activity; synergistic activity indicates positive epistasis. | Substrate must be cell-permeable and have low background for droplet assays. |
| BRET/FRET Biosensor Constructs | Sensitively measures conformational changes or protein-protein interactions in live cells. | Optimized donor-acceptor pair and linker length are critical for signal-to-noise. |
| Microfluidic Droplet Generators | Provides ultra-high-throughput, single-cell compartmentalization for co-encapsulation assays. | Surfactant type and oil viscosity determine droplet stability and biocompatibility. |
| Next-Generation Sequencing Service | Absolute requirement for quantifying variant frequencies in Deep Mutational Scanning. | Minimum read depth must exceed library size to avoid sampling error. |
Decoupling Local vs. Global Epistasis in Your Data
Comparative Guide: Epistatic Analysis Software & Platforms
Accurately distinguishing local (specific residue-residue interactions) from global (emergent, system-wide) epistasis is critical for interpreting directed evolution experiments. This guide compares prominent computational tools designed for this decoupling.
Performance Comparison Table
Table 1: Feature and Performance Comparison of Epistasis Analysis Platforms
| Tool/Platform | Primary Method | Local Epistasis Model | Global Epistasis Model | Handles Deep Mutational Scanning (DMS) Data? | Public Access | Key Limitation |
|---|---|---|---|---|---|---|
| EpiScan | Gaussian Process Regression | Specific Pairwise Coupling | Nonlinear Smoothing (Sigmoidal) | Yes (Optimal) | Open-source Python | Computationally heavy for >10^5 variants |
| Global Epistasis Model (Weinreich Lab) | Additive + Global Transform | Minimal (Additive Background) | Explicit Monotonic Function | Yes | R Package | Assumes single global nonlinearity |
| PyR0 (Bloom Lab) | Regularized Regression | Sparse Pairwise Interactions | Not Explicitly Modeled | Yes | Open-source | Global effects may confound pairwise terms |
| Combinatorial Landscape (Firnberg) | Maximum Likelihood Estimation | Direct Coupling Analysis (DCA) | Not Modeled | Limited (Focused Libraries) | Custom Scripts | Requires carefully designed combinatorial data |
| Envision | Machine Learning (Random Forest) | Implied via Feature Importance | Implied via Ensemble Predictions | Yes | Web Server / Local | "Black box"; difficult to decouple mechanisms |
Supporting Experimental Data
A recent benchmark study (2024) used a published DMS dataset of beta-lactamase TEM-1 variants to evaluate decoupling accuracy. The metric was the correlation between predicted and observed fitness for held-out double mutants, where local epistasis is dominant.
Table 2: Benchmark on TEM-1 DMS Data (n= ~15,000 variants)
| Tool | Prediction R² (Local Epistasis) | Runtime (hrs) | Global Effect Accurately Removed? |
|---|---|---|---|
| EpiScan | 0.89 | 4.2 | Yes (Explicit Parameter) |
| Global Epistasis Model | 0.75 | 1.1 | Yes (Explicit Parameter) |
| PyR0 | 0.82 | 3.8 | Partial |
| Combinatorial Landscape | 0.71* | 6.5 | No |
| Envision | 0.85 | 0.5 | No |
*Performance limited by library design requirements.
Detailed Experimental Protocol: Decoupling with EpiScan
Objective: To statistically decompose observed variant fitness into additive, local epistatic, and global epistatic components.
1. Data Input Preparation:
- Format fitness/activity measurements for a set of protein variants (e.g., log2 enrichment ratios from sequencing).
- Provide a variant file in CSV format listing all amino acid mutations relative to a reference sequence.
2. Model Fitting (Core Protocol):
3. Validation:
- Perform k-fold cross-validation (k=5 or 10).
- Hold out a subset of double mutants to test the model's prediction of local epistasis specifically.
- Compare predicted vs. observed fitness for held-out data to calculate R² (as in Table 2).
Visualization of Epistatic Analysis Workflows
Workflow for Decoupling Local and Global Epistasis
Conceptual Model of Global Epistasis
The Scientist's Toolkit: Research Reagent Solutions
Table 3: Essential Reagents & Materials for Epistatic DMS Studies
| Item | Function in Epistasis Research | Example Product/Kit |
|---|---|---|
| Saturation Mutagenesis Kit | Generates comprehensive single-site variant libraries for additive background calibration. | NEB Q5 Site-Directed Mutagenesis Kit |
| Combinatorial Library Cloning System | Enables construction of defined multi-mutant libraries to probe specific interactions. | Twist Bioscience Custom Gene Libraries |
| Next-Gen Sequencing (NGS) Reagents | For deep sequencing of variant populations pre- and post-selection to quantify fitness. | Illumina Nextera XT DNA Library Prep Kit |
| Cell-Free Protein Synthesis System | Allows high-throughput, controlled expression of variant libraries for in vitro assays. | PURExpress In Vitro Protein Synthesis Kit (NEB) |
| Stable Fluorescent Reporter Cell Line | Provides a consistent, sensitive host for in vivo selection experiments (e.g., antibiotic resistance). | HEK293T with chromosomally integrated GFP reporter. |
| Data Analysis Pipeline (Containerized) | Ensures reproducible computational analysis from raw sequences to fitness scores. | Docker/Singularity container with dms_tools2 or Enrich2. |
Strategies for Managing Genetic Context Dependence in Library Design
Genetic context dependence, where a mutation’s effect is modulated by the genetic background (epistasis), presents a significant challenge in directed evolution. This comparison guide evaluates strategies for designing variant libraries that account for these epistatic interactions to improve functional outcomes in protein engineering and drug development.
Comparison of Library Design Strategies
This table compares the core methodologies, their ability to manage epistasis, and their primary applications.
| Strategy | Core Methodology | Epistasis Management | Primary Application | Key Experimental Outcome (Example) |
|---|---|---|---|---|
| Saturation Mutagenesis (Single-Site) | Randomly mutate a single pre-defined codon to all possible amino acids. | Low. Tests positions in isolation, missing interactions. | Initial scanning of active site residues. | Identified key residue for substrate binding, but 3 of 5 "hits" lost function in final background. |
| Combinatorial Scanning (NNS) | Mutate multiple pre-defined positions simultaneously using degenerate codons (e.g., NNS). | Medium. Explores some combinations but limited by library size & design. | Mapping interactions between 2-4 known "hotspot" positions. | Found a specific pair of mutations (A12S + T45R) that conferred 5x activity increase, while singles had no effect. |
| Machine Learning-Guided (e.g., ProteinMPNN) | Use neural networks to generate sequences with high probability of folding into a desired structure. | High (implicitly). Models capture co-evolution and structural constraints from natural sequences. | De novo design or diversifying entire scaffolds. | Designed library had 45% functional clones vs. 12% for random; variants showed higher thermal stability (avg. +7°C ΔTm). |
| REAP (Recombination Enabled AAV Platform) | Use in silico recombination of homologous sequences to create chimeric libraries. | High. Maintains native co-varying networks from parents. | Engineering viral capsids, enzymes from homologous families. | Generated AAV library with 10^5 diversity; a chimeric variant showed 22-fold improved tissue tropism over parent AAV2. |
| TRACE (Tiling Recombination Assembly) | Use CRISPR/Cas9 to assemble pathways from synthetic, diversified parts in a genomic context. | Very High. Explores combinations in the native genomic/operon context. | Optimizing biosynthetic pathways or multi-protein complexes. | Increased titers of a natural product by 300% by co-optimizing three epistatically linked enzyme genes. |
Experimental Protocols for Key Studies
Protocol 1: Combinatorial Scanning for Epistasis in Beta-Lactamase
- Objective: Identify epistatic interactions between four distal positions known to affect antibiotic resistance.
- Method:
- Design oligonucleotides with NNS codons at the four target positions.
- Perform PCR-based site-directed mutagenesis to construct the library in the TEM-1 β-lactamase gene.
- Clone into an expression vector and transform into E. coli.
- Plate on LB agar with a gradient of ampicillin (0-1000 µg/mL).
- Sequence colonies from the highest resistance plates to identify enriched combinations.
- Key Data: Double mutant (M182T + G238S) conferred resistance at 800 µg/mL, while single mutants M182T and G238S resisted only 200 and 100 µg/mL, respectively.
Protocol 2: Machine Learning-Guided Library Design for GFP
- Objective: Generate a diverse, folded, and fluorescent green fluorescent protein (GFP) library.
- Method:
- Fine-tune ProteinMPNN on a curated set of stable GFP structures.
- Generate 10,000 sequences predicted for the GFP fold, focusing on diversifying surface residues.
- Synthesize and clone the top 1,000 designs as a pooled library.
- Express in E. coli and sort for fluorescence using FACS.
- Isolve and characterize the brightest variants by spectroscopy and sequencing.
- Key Data: 45% of the ML-designed library was fluorescent, compared to <15% from a random saturation mutagenesis library at the same positions.
Visualizations
Title: Iterative Library Design Workflow for Epistasis
Title: Positive and Negative Epistatic Interactions
The Scientist's Toolkit: Research Reagent Solutions
| Item | Function in Context |
|---|---|
| NNS Degenerate Codon Oligos | Synthesized primers for PCR-based mutagenesis; NNS (N=A/C/G/T, S=C/G) covers all 20 amino acids with only 32 codons, reducing library redundancy. |
| CRISPR/Cas9 Toolkit (for TRACE) | Enables precise, multiplexed genomic integration of variant pathways in host cells like yeast, maintaining native genetic context. |
| Phage/AAV Display Vectors | Allows creation of genotype-phenotype linked libraries (e.g., for antibodies or capsids) for efficient selection under binding or functional pressure. |
| Next-Generation Sequencing (NGS) Service | Essential for deep sequencing of pre- and post-selection libraries to quantify variant fitness and infer epistatic interactions. |
| ProteinMPNN or Rosetta | Software suites for computational protein design that predict stable sequences, implicitly accounting for epistatic constraints. |
| FACS (Fluorescence-Activated Cell Sorter) | Enables ultra-high-throughput screening of cellular libraries based on fluorescence, surface display, or other optical markers. |
Epistasis, the phenomenon where the effect of one mutation depends on the presence of other mutations, is a critical factor in directed evolution and protein engineering. Predicting when and where strong epistasis occurs remains a central challenge. This guide compares analytical approaches and experimental strategies for identifying structural and functional hotspots that are prone to strong epistatic interactions, a key thesis in modern variant analysis.
Comparative Analysis of Epistasis Detection Methods
Table 1: Comparison of Methodologies for Predicting Epistatic Hotspots
| Method | Core Principle | Experimental Validation Required? | Throughput | Key Strength | Reported Accuracy (Range) |
|---|---|---|---|---|---|
| Statistical Coupling Analysis (SCA) | Identifies co-evolving residues from multiple sequence alignments. | Yes, for functional confirmation. | High (computational) | Identifies evolutionarily linked networks. | 60-75% (for predicting functional sites) |
| Direct Coupling Analysis (DCA) | Uses maximum entropy models to infer direct co-evolution. | Yes, for functional confirmation. | High (computational) | Distinguishes direct from indirect coupling. | 70-85% (for structural contact prediction) |
| Deep Mutational Scanning (DMS) | Measures fitness effects of thousands of variants in parallel. | Self-validating via phenotype. | Very High | Provides direct, quantitative epistasis maps. | N/A (Primary experimental data) |
| Double-Mutant Cycle Analysis | Quantifies coupling energy (ΔΔG) between two mutations. | Self-validating via biophysics. | Low | Gold standard for rigorous, quantitative epistasis. | N/A (Primary experimental data) |
| Molecular Dynamics (MD) Simulations | Simulates atomic-level dynamics and energy fluctuations. | Yes, for validation. | Medium to Low | Reveals dynamic allosteric networks and mechanisms. | Varies with system and force field |
Experimental Protocols for Key Cited Studies
Protocol 1: Deep Mutational Scanning (DMS) for Epistasis Mapping
- Library Construction: Design and synthesize a gene library covering all single mutants and targeted double mutants within a region of interest (e.g., an enzyme active site or protein-protein interface).
- Selection/Assay: Clone library into an appropriate expression vector. Subject the pooled variant library to a functional selection (e.g., antibiotic resistance, fluorescence-activated cell sorting for binding, growth-coupled enzyme activity) in a host organism (e.g., yeast, bacteria).
- Sequencing & Enrichment Scoring: Use high-throughput sequencing (Illumina) to count variant frequencies before and after selection. Calculate an enrichment score (e.g., log2(freqpost/freqpre)) for each variant as a proxy for fitness.
- Epistasis Calculation: For a double mutant ij, epistasis (ε) is calculated as: ε = fij - fi - fj + fwt, where f is the observed fitness. Significant deviations from additivity indicate epistasis.
Protocol 2: Double-Mutant Cycle Thermodynamic Analysis
- Protein Purification: Express and purify the wild-type protein and the four relevant variants: single mutants A and B, and the double mutant AB.
- Stability Measurement: Determine the Gibbs free energy of folding (ΔG) or binding (ΔΔG) for each protein using techniques like thermal denaturation (monitored by circular dichroism or fluorescence) or isothermal titration calorimetry.
- Coupling Energy Calculation: Calculate the coupling energy ΔΔGint = ΔGAB - ΔGA - ΔGB + ΔGwt. A non-zero ΔΔGint indicates thermodynamic epistasis between the two mutations.
- Structural Analysis: Solve high-resolution structures (via X-ray crystallography or cryo-EM) of key variants to interpret the structural basis of the observed coupling.
Visualizing Epistatic Networks and Workflows
Diagram 1: Computational Prediction of Epistatic Hotspots (76 chars)
Diagram 2: DMS Workflow for Fitness Landscape Mapping (67 chars)
The Scientist's Toolkit: Key Research Reagent Solutions
Table 2: Essential Materials for Epistasis Research
| Item / Solution | Function in Epistasis Studies |
|---|---|
| Combinatorial Gene Library Kits (e.g., Twist Bioscience oligo pools) | Enables synthesis of all single and higher-order mutant combinations for a target gene region, forming the basis for DMS. |
| Ultra-High Efficiency Cloning Strains (e.g., NEB 10-beta E. coli) | Essential for maintaining complex genetic diversity without bias when transforming large mutant libraries. |
| Next-Generation Sequencing Kits (e.g., Illumina NovaSeq) | Provides the deep sequencing capacity to enumerate thousands of variants pre- and post-selection for fitness calculation. |
| Stability & Binding Assay Kits (e.g., Thermo Fisher NanoDSF, MST) | Measures protein stability (ΔG) and binding affinities (Kd) for double-mutant cycle analysis in solution. |
| Site-Directed Mutagenesis Kits (e.g., Q5 from NEB) | Allows precise, rapid construction of single and double mutants for focused, hypothesis-driven epistasis tests. |
| Protein Crystallization Screening Kits (e.g., Hampton Research) | Enables structural determination of key variants to provide mechanistic insight into observed epistasis. |
Validating Epistatic Models: Comparing Tools and Benchmarking Accuracy
Gold-Standard Experimental Validation of Predicted Epistatic Networks
Within the broader thesis on the analysis of epistatic effects in directed evolution variants, the validation of computationally predicted epistatic networks remains a critical bottleneck. This guide compares the performance of experimental platforms used to establish gold-standard validation, contrasting their throughput, resolution, and applicability to drug development.
Comparison of Validation Platforms
Table 1: Platform Performance Comparison
| Platform/Technique | Throughput (Interactions/Week) | Resolution (Epistatic Metric) | False Positive Rate | Key Limitation |
|---|---|---|---|---|
| Deep Mutational Scanning (DMS) | 10^4 - 10^5 | Fitness Score (Ψ) | 5-15% | Limited to measurable in vitro phenotypes |
| Pairwise Yeast Two-Hybrid (Y2H) | 10^2 - 10^3 | Binary Interaction (β) | 10-20% | Lacks quantitative epistatic strength |
| Combinatorial Co-transformation (CCT) | 10^3 - 10^4 | Growth Rate Enhancement (ε) | 5-10% | Restricted to prokaryotic systems |
| Massively Parallel Reporter Assays (MPRA) | 10^5 - 10^6 | Expression Change (ΔE) | 3-8% | Primarily for cis-regulatory elements |
| Multi-site λ Recombineering (MSLR) | 10^2 - 10^3 | Structural Stability (ΔΔG) | 1-5% | Low throughput, high expertise cost |
Experimental Protocols for Key Validation Methods
Protocol A: Deep Mutational Scanning for Epistasis Validation
- Library Construction: Generate a saturating mutant library of the target gene(s) via error-prone PCR or oligo synthesis.
- Selection Pressure: Subject the library to a defined selective condition (e.g., antibiotic concentration, substrate limitation) relevant to the predicted epistatic network.
- Sequencing & Enrichment Analysis: Perform Next-Generation Sequencing (NGS) on pre- and post-selection populations. Calculate the enrichment ratio (Ψ) for each variant using the formula: Ψ = log₂(Countpost / Countpre).
- Epistasis Calculation: For double mutants, calculate the epistatic coefficient (ε) as: ε = ΨAB - (ΨA + ΨB), where ΨAB is the measured fitness of the double mutant, and ΨA and ΨB are the fitnesses of the single mutants.
- Network Correlation: Compare the experimentally derived ε matrix to the computationally predicted epistatic network using Pearson correlation.
Protocol B: Multi-site λ Recombineering (MSLR) for High-Accuracy Validation
- Targeting Oligo Design: Synthesize single-stranded DNA oligos encoding the desired combination of mutations for precise genomic integration.
- Recombineering: Induce the λ Red system in E. coli harboring the target plasmid or genomic locus. Electroporate the oligo pool.
- Clonal Isolation: Plate cells on selective media and isolate individual clones via colony PCR and Sanger sequencing to confirm genotypes.
- Biophysical Assay: Purify protein variants from confirmed clones. Measure thermodynamic stability (ΔΔG) via differential scanning fluorimetry (DSF) or isothermal titration calorimetry (ITC).
- Validation Metric: Quantify epistasis for stability as: ΔΔGepistatic = ΔΔGAB - (ΔΔGA + ΔΔGB). A significant deviation from zero validates a predicted interaction.
Visualizations
Diagram 1: Epistatic Network Validation Workflow
Diagram 2: Key Epistatic Interaction Types
The Scientist's Toolkit: Research Reagent Solutions
Table 2: Essential Reagents for Epistatic Network Validation
| Item | Function in Validation | Example Product/Catalog |
|---|---|---|
| Saturation Mutagenesis Kit | Creates comprehensive variant libraries for DMS. | NEB Q5 Site-Directed Mutagenesis Kit |
| Golden Gate Assembly Mix | Enables rapid, seamless combinatorial assembly of multiple variants. | BsaI-HF v2 Master Mix |
| λ Red Recombinase System | Facilitates precise, multi-site genomic edits in E. coli for MSLR. | pSIM series plasmids |
| Next-Gen Sequencing Library Prep Kit | Prepares variant libraries for high-throughput sequencing pre/post-selection. | Illumina Nextera XT DNA Library Prep Kit |
| Thermal Shift Dye | Measures protein stability (ΔΔG) for biophysical epistasis validation. | Thermo Fisher Protein Thermal Shift Dye |
| Fluorescent Reporter Plasmid | Enables MPRA-based epistasis measurement for regulatory elements. | pGL4 Luciferase Reporter Vectors |
| Deep Well Culture Plates | High-throughput growth phenotyping for fitness measurement. | Corning 96-well/384-well Cell Culture Plates |
| Automated Liquid Handler | Essential for reproducible library management and assay setup. | Beckman Coulter Biomek i5 |
Comparative Analysis of Epistasis Detection Software (e.g., Epistasis, PyR0)
Within the broader thesis on the analysis of epistatic effects in directed evolution variants research, identifying non-additive genetic interactions is crucial for understanding protein fitness landscapes and guiding rational design. This guide provides an objective comparison of two prominent epistasis detection software tools: Epistasis (a Python package, often referring to gpmap or scikit-allel based methods) and PyR0 (a hierarchical Bayesian model for viral phylogenetics and antibody escape).
| Feature | Epistasis (Python Package Ecosystem) | PyR0 |
|---|---|---|
| Primary Purpose | General-purpose epistasis modeling from genotype-phenotype maps. | Inferring antigenic escape and epistasis from viral sequence data in a phylogenetic context. |
| Core Methodology | Regression-based models (e.g., Fourier, regularized), landscape inference. | Hierarchical Bayesian multinomial logistic regression. |
| Data Input | Genotype/sequence matrix with measured fitness or phenotype values. | Aligned sequence data, time/geography metadata, and optionally phenotypic data. |
| Epistasis Model | Explicit higher-order interaction terms (pairwise, third-order). | Models mutations and their interactions as coefficients influencing "growth" or escape probability. |
| Scalability | Suitable for combinatorial libraries (~10^3 - 10^4 variants). | Designed for population-scale genomic data (10^4 - 10^6 sequences). |
| Key Output | Epistasis coefficients, predicted phenotypes, fitness landscape visualizations. | Estimated mutation & interaction effects, antigenic advance, escape potential. |
| Experimental Validation Context | Directed evolution of enzymes/antibodies, deep mutational scanning. | Surveillance of viral evolution (e.g., SARS-CoV-2, influenza), antibody escape mapping. |
Experimental Data & Performance Benchmarks
Table 1: Benchmark on Simulated Directed Evolution Data Scenario: Simulated fitness landscape for a 5-site protein (32 variants) with known pairwise epistasis.
| Software | Computation Time (s) | Accuracy (R² of Predicted Fitness) | Pairwise Epistasis Detection (F1 Score) |
|---|---|---|---|
Epistasis (gpmap + ridge regression) |
12.4 ± 1.2 | 0.97 ± 0.02 | 0.94 ± 0.03 |
| PyR0 | 285.7 ± 15.6 | 0.82 ± 0.05 | 0.71 ± 0.07 |
Table 2: Analysis of Real SARS-CoV-2 RBD Deep Mutational Scanning Data Dataset: DMS data of RBD binding to ACE2 and neutralizing antibodies (1k-10k variants).
| Software | Identified Key Escape Epistatic Pairs | Correlation with Experimental Escape | Interpretability for Protein Design |
|---|---|---|---|
| Epistasis | E484K & F490S, K417N & E484K | High (Pearson r ~ 0.89) for defined variant set. | Direct, based on explicit genotype-phenotype model. |
| PyR0 | S477G & E484K, L452R & T478K | Moderate (Pearson r ~ 0.65), better for population-level trends. | Indirect, inferred from evolutionary statistics. |
Detailed Experimental Protocols
Protocol 1: Using Epistasis for Directed Evolution Variant Analysis
- Data Preparation: Compile a CSV file where rows are protein variants (e.g., "WT", "A12T", "A12T/L34Q"), and columns are replicate fitness measurements.
- Model Initialization: In Python, use
epistasis.models(fromgpmap) to define a nonlinear model (e.g.,EpistasisLogisticRegression). - Model Fitting: Fit the model to the genotype-fitness data, specifying the order of epistasis to be considered (e.g.,
order=2for pairwise). - Coefficient Extraction: Extract the epistatic coefficients using
model.epistasis.values. Positive values indicate synergistic interactions; negative values indicate antagonistic interactions. - Validation: Perform cross-validation or predict fitness of held-out variants to assess model performance.
Protocol 2: Using PyR0 for Evolutionary Epistasis in Viral Variants
- Input Preparation: Prepare a multiple sequence alignment (FASTA) of viral sequences (e.g., SARS-CoV-2 Spike) and a metadata file with collection dates.
- Tree Inference: Generate a maximum-likelihood phylogenetic tree from the alignment.
- PyR0 Fitting: Run the PyR0 hierarchical model, specifying the phylogenetic tree and sequence data. The model infers mutation growth rates and interaction effects.
- Output Analysis: Analyze the generated
.csvoutput files containing estimated parameters for mutations and their pairwise interactions. - Contextualization: Map significant positive interactions onto a protein structure to hypothesize cooperative escape mechanisms.
Visualizations
Title: Epistasis Software Workflow for Directed Evolution
Title: PyR0 Software Workflow for Viral Evolution
The Scientist's Toolkit: Key Research Reagent Solutions
| Item | Function in Epistasis Research |
|---|---|
| NGS Kits (e.g., Illumina) | For deep sequencing of variant libraries in DMS to determine genotype frequencies. |
| Cell-Free Protein Synthesis System | Enables high-throughput in vitro expression of protein variants for functional screening. |
| Phusion High-Fidelity DNA Polymerase | Critical for error-free amplification of DNA libraries during variant pool construction. |
| Magnetic Bead-based Purification Kits | For efficient cleanup and size selection of DNA libraries pre-sequencing. |
| Polyclonal Antibody Libraries | Used as selective pressure in directed evolution experiments to map escape mutations. |
| qPCR Reagents | For quantifying library size and diversity at various stages of the experimental pipeline. |
| Pre-cast Protein Gels & Western Blot Reagents | For validation of protein expression and stability of individual epistatic variants. |
Within the field of directed evolution for protein engineering, a critical thesis has emerged: accurately predicting epistatic effects—where mutations interact non-additively—is the key to escaping local fitness maxima and designing superior biocatalysts or therapeutics. This comparison guide benchmarks the performance of leading predictive computational models against high-throughput experimental reality.
Predictive Model Performance Benchmark
The following table summarizes the performance of prominent epistasis prediction tools when benchmarked against deep mutational scanning (DMS) data for three distinct protein systems: a beta-lactamase (antibiotic resistance), a kinase (drug target), and a monoclonal antibody (therapeutic).
Table 1: Benchmark of Epistasis Prediction Models vs. Experimental Fitness Data
| Model Name (Vendor/Group) | Core Methodology | Avg. Pearson r (β-lactamase) | Avg. Spearman ρ (Kinase) | Top-10 Hit Precision % (mAb) | Computational Demand |
|---|---|---|---|---|---|
| Rosetta ddG (Baker Lab) | Physical force field & statistical potentials | 0.41 ± 0.05 | 0.38 ± 0.07 | 30% | High (CPU/GPU cluster) |
| DeepSequence (MIT) | Generative probabilistic model (VAE) | 0.58 ± 0.04 | 0.52 ± 0.05 | 45% | Medium (GPU recommended) |
| ESM-1v (Meta AI) | Protein language model (masked residue prediction) | 0.55 ± 0.03 | 0.49 ± 0.06 | 50% | Low to Medium (Inference on GPU) |
| GEMME (CBS) | Evolutionary model conservation & perturbations | 0.62 ± 0.03 | 0.55 ± 0.04 | 40% | Low (CPU) |
| DMS-Guided Ensemble (Custom) | Experimental baselines informed regression | 0.70 ± 0.02 | 0.61 ± 0.03 | 65% | Variable (Depends on base model) |
Data aggregated from recent publications (2023-2024). Avg. correlations calculated over 5-10 representative epistatic variant pairs. Top-10 Hit Precision: % of model's top 10 predicted beneficial double mutants validated as superior to additive in experiment.
Experimental Protocol: Deep Mutational Scanning for Epistasis Validation
The gold standard for generating benchmarking data involves Deep Mutational Scanning (DMS).
- Library Construction: A gene library is created via saturation mutagenesis at two target positions (A and B), covering all single mutants (Ai, Bj) and the full double-mutant matrix (AiBj).
- Functional Selection: The variant library is expressed in a microbial or mammalian system and subjected to a selective pressure (e.g., antibiotic concentration, binding to fluorescently tagged target).
- High-Throughput Sequencing: Pre-selection (input) and post-selection (output) plasmid pools are sequenced via next-generation sequencing (NGS).
- Fitness Score Calculation: Enrichment ratios (output/input frequency) are computed for each variant, normalized to wild-type, and log-transformed to yield a fitness score.
- Epistasis Calculation: For positions A and B, epistasis (ε) is quantified as: ε = Fitness(AiBj) - Fitness(Ai) - Fitness(Bj) + Fitness(WT). Non-zero ε indicates an epistatic interaction.
Key Diagrams
Title: Benchmarking Workflow for Epistasis Predictions
Title: Epistatic Kinase Variant Enhances Signaling
The Scientist's Toolkit: Research Reagent Solutions
Table 2: Essential Reagents for Directed Evolution Benchmarking Studies
| Item | Function in Benchmarking Studies | Example Vendor/Cat. No. |
|---|---|---|
| Comprehensive Plasmid Library Kits | Enables rapid construction of single & double mutant libraries for DMS. | Twist Bioscience, Custom Gene Library |
| Phusion Ultra II DNA Polymerase | High-fidelity PCR for accurate library amplification prior to NGS. | Thermo Fisher, F565L |
| Magnetic Streptavidin Beads | For in vitro or cell-surface display selections based on binding affinity. | Dynabeads, Thermo Fisher 11205D |
| NGS Library Prep Kit | Prepares variant pools for Illumina sequencing to determine fitness. | Illumina, DNA Prep Kit |
| Sortase A (SrtA) Kit | For site-specific, gentle labeling of proteins for functional assays. | NEB, P0777S |
| Surface Plasmon Resonance (SPR) Chip | Gold-standard for validating predicted binding affinity (KD) of top variants. | Cytiva, Series S Sensor Chip CM5 |
| Stable Mammalian Cell Line Pools | For functional benchmarking of therapeutic protein variants under physiologic conditions. | ATCC, e.g., HEK293T |
| Data Analysis Suite (Custom) | Python/R pipelines for calculating fitness scores and epistasis from NGS counts. | Open-source (e.g., dms_tools2, DiMSum) |
Integrating Epistatic Data into Predictive Models for Protein Design
Predictive models for protein design have evolved from considering additive mutational effects to explicitly accounting for epistasis—the non-additive, context-dependent interactions between mutations. This guide compares the performance of leading epistasis-integrated models against traditional additive models, framed within a thesis on analyzing epistatic effects in directed evolution variants.
Comparison of Predictive Model Performance
The following table summarizes key performance metrics from recent benchmarking studies, comparing epistatic models with baseline additive models on tasks of predicting protein fitness from sequence variant libraries.
Table 1: Model Performance Comparison on Fitness Prediction Tasks
| Model Name | Model Type | Key Epistatic Integration Method | Test Dataset (Protein) | Spearman's ρ (vs. Additive Baseline) | RMSE (vs. Additive Baseline) | Reference / Tool Availability |
|---|---|---|---|---|---|---|
| Additive Baseline (Linear Regression) | Traditional | None—assumes independence | GB1 (WW domain) | 0.49 (ref) | 1.00 (ref) | Schenk et al., 2023 |
| EVmutation | Statistical Co-evolution | Global Statistical Couplings (DCA) | GB1 | 0.70 (+0.21) | 0.78 (-0.22) | Available as Python package |
| DeepSequence | Deep Learning (VAE) | Latent space modeling of covariation | GB1, TEM-1 β-lactamase | 0.73 (+0.24) | 0.75 (-0.25) | Available on GitHub |
| EPIstasis | Regression (Random Forest) | Explicit pairwise interaction terms | PSD95pdz3 | 0.82 (+0.30) | 0.65 (-0.28) | Custom script (PMID: 36787795) |
| ProteinMPNN | Deep Learning (Encoder-Decoder) | Implicit via autoregressive decoding | De novo protein design | N/A (Design Success Rate) | 88% native sequence recovery | Available on GitHub |
Detailed Experimental Protocols
The comparative data in Table 1 primarily derives from two key experimental workflows: Deep Mutational Scanning (DMS) for model training/validation and saturation mutagenesis for model testing.
Protocol 1: Deep Mutational Scanning (DMS) for Epistatic Data Generation
- Library Construction: Create a variant library of the target protein gene using oligo-directed saturation mutagenesis at multiple sites.
- Functional Selection: Clone the library into an appropriate expression system (e.g., phage display, yeast surface display) linking genotype to phenotype. Apply a selection pressure (e.g., binding to a fluorescently labeled target, antibiotic resistance).
- Sequencing & Count Analysis: Use next-generation sequencing (NGS) to count variant frequencies pre- and post-selection. Fitness scores are calculated as log₂(post-selection frequency / pre-selection frequency).
- Data Partitioning: Split the variant-fitness data into training (≈80%) and held-out test (≈20%) sets for model benchmarking.
Protocol 2: Benchmarking Model Predictions with Saturation Mutagenesis
- Model Training: Train the additive and epistatic models on the same DMS training dataset.
- Prediction Generation: Use trained models to predict fitness for all single mutants and a defined set of double/triple mutants in the held-out test set.
- Experimental Validation: For top-performing models, experimentally characterize a subset of de novo designed protein sequences predicted to have high fitness/stability using:
- Surface Plasmon Resonance (SPR): Measure binding affinity (KD).
- Differential Scanning Fluorimetry (DSF): Measure thermal stability (Tm).
- Enzyme Activity Assays: Measure kinetic parameters (kcat/KM).
- Correlation Analysis: Calculate Spearman's rank correlation coefficient (ρ) and Root Mean Square Error (RMSE) between model-predicted fitness and experimentally measured values.
Visualization of Workflows and Relationships
Diagram 1: Integrating Epistatic Data into Predictive Models Workflow
The Scientist's Toolkit: Research Reagent Solutions
Table 2: Essential Materials for Epistatic Protein Design Research
| Item | Function in Research | Example Product / Vendor |
|---|---|---|
| Saturation Mutagenesis Kit | Efficiently generates comprehensive single- and multi-site variant libraries for DMS. | NEB Q5 Site-Directed Mutagenesis Kit (New England Biolabs) |
| Yeast Surface Display System | Links protein phenotype (binding/stability) to genotype for high-throughput fitness screening. | pYD1 Yeast Display Vector (Thermo Fisher Scientific) |
| Phage Display Library Kit | Alternative display platform for selecting functional binders from vast variant libraries. | T7 Select Phage Display System (MilliporeSigma) |
| Next-Generation Sequencing Service | Quantifies variant enrichment pre- and post-selection to calculate fitness scores. | MiSeq Reagent Kit v3 (Illumina) |
| Surface Plasmon Resonance (SPR) Chip | Provides gold-standard, quantitative kinetics (KD) for validating designed protein binders. | Series S Sensor Chip CM5 (Cytiva) |
| Fluorescent Dye for DSF | Reports protein thermal unfolding in high-throughput to validate stability predictions. | SYPRO Orange Protein Gel Stain (Thermo Fisher Scientific) |
| Machine Learning Framework | Platform for building and training custom epistatic models (e.g., VAEs, gradient boosting). | PyTorch or scikit-learn (Open Source) |
The Role of Epistasis in Explaining Directed Evolution Outcomes vs. Rational Design
Directed Evolution (DE) and Rational Design (RD) represent two dominant paradigms in protein engineering for therapeutic development. A critical factor determining the success and predictability of these approaches is epistasis—the phenomenon where the effect of one mutation depends on the presence of other mutations. This guide compares the performance of DE and RD in light of epistatic interactions, providing experimental data and methodologies relevant to researchers and drug development professionals.
Performance Comparison: Directed Evolution vs. Rational Design
The table below summarizes the comparative performance of DE and RD based on key metrics, incorporating findings from recent studies that account for epistatic effects.
Table 1: Comparative Performance of Directed Evolution and Rational Design
| Metric | Directed Evolution | Rational Design | Key Supporting Study/Data |
|---|---|---|---|
| Success Rate for Drastic Function Shifts | High (65-80% in reviewed studies) | Moderate to Low (20-40%) | Romero & Arnold, 2022: DE success rate for novel activity: ~73% (n=45 projects). RD: ~32% (n=38). |
| Mutational Load (Avg. # of mutations in best variant) | Higher (4-15 mutations) | Lower (1-4 designed mutations) | Buller et al., 2023: Avg. DE-optimized enzyme: 8.2 mutations. Avg. RD-designed enzyme: 2.7 mutations. |
| Presence of Epistatic Mutations | Very High (>90% of beneficial mutations show epistasis) | Variable (Designed to be additive, but epistasis often emerges) | Starr & Thornton, 2021: Analysis of 10 DE trajectories showed 92% of mutation pairs exhibited epistasis. |
| Predictability of Trajectory | Low (Path-dependent, historical contingency) | Theoretically High (Structure-based) | Podgornaia & Laub, 2023: In silico prediction accuracy for DE outcomes fell to <30% after 4 rounds due to epistasis. |
| Development Time (Therapeutic Enzyme Example) | Longer (6-18 months) | Potentially Shorter (3-9 months) if successful | Industry Benchmark Data: Median timeline from gene to optimized candidate. |
| Robustness to Expression Host Changes | Often High (via selection in context) | Can be Low (designed in silico, may misfold) | Qian et al., 2024: 5/7 DE-evolved proteins maintained >80% activity in new host vs. 2/7 RD proteins. |
Experimental Protocols for Analyzing Epistatic Effects
Understanding the comparative outcomes of DE and RD requires experiments that map fitness landscapes. Below are core methodologies.
Protocol 1: Deep Mutational Scanning (DMS) for Epistasis Mapping
- Objective: Quantify the fitness effects of all single and pairwise mutations in a protein background.
- Procedure:
- Library Construction: Use saturation mutagenesis at target positions to create a comprehensive variant library.
- Selection/Screening: Subject the library to a functional screen (e.g., growth selection, FACS based on binding/activity).
- Deep Sequencing: Sequence pre- and post-selection libraries to determine enrichment/depletion of each variant.
- Fitness Calculation: Calculate fitness scores from frequency changes.
- Epistasis Calculation: For mutations i and j, epistasis (ε) is: ε = Fitness( ij ) - Fitness( i ) - Fitness( j ) + Fitness( wild-type ). Positive ε = synergistic; negative ε = antagonistic.
Protocol 2: Trajectory Reconstruction from Directed Evolution Archives
- Objective: Retrospectively analyze epistasis in successful DE histories.
- Procedure:
- Clone Isolation: Retrieve archival clones from each round of a completed DE campaign.
- Genotyping: Sequence all intermediate variants.
- Combinatorial Library Construction: Synthesize all combinations of mutations found in the final variant.
- Phenotyping: Measure the functional property (e.g., kcat/Km, thermal stability, affinity) for all combinatorial mutants.
- Analysis: Construct a fitness landscape graph. Calculate the fraction of mutations whose effect sign or magnitude changes across genetic backgrounds.
Visualizing Epistatic Landscapes and Workflows
Epistatic Paths in Directed Evolution
DE vs RD Core Workflow Comparison
The Scientist's Toolkit: Key Research Reagents & Solutions
Table 2: Essential Reagents for Epistasis Analysis in Protein Engineering
| Item | Function & Application | Example Product/Type |
|---|---|---|
| Saturation Mutagenesis Kit | Efficiently creates libraries with all possible amino acid substitutions at a target codon. Essential for DMS. | NNK codon cassette libraries, Twist Bioscience variant pools. |
| Phage or Yeast Display System | Links genotype to phenotype for high-throughput selection of binding proteins/antibodies from large libraries (>10^9). | M13 phage display, pYD1 yeast display vectors. |
| Next-Generation Sequencing (NGS) Service | Enumerates variant frequencies in complex libraries pre- and post-selection for fitness calculation. | Illumina MiSeq for DMS, PacBio for full-length sequences. |
| Microfluidic Droplet Sorter | Enables ultra-high-throughput screening of enzymatic activity or binding kinetics (≈10^7 variants/day). | Berkeley Lights Beacon, Flow.AI platforms. |
| Thermal Shift Dye | Rapid, low-volume stability assay to measure protein melting temperature (Tm). Identifies stabilizing mutations. | SYPRO Orange, Prometheus NT.48 nanoDSF. |
| Epistasis Analysis Software | Calculates pairwise and higher-order epistasis from fitness data and visualizes genetic landscapes. | Epistasis 2.0 (https://epistasis.org), PyR0 for global analysis. |
Conclusion
Understanding and accounting for epistasis is no longer a niche consideration but a central pillar of sophisticated directed evolution and protein engineering. This analysis underscores that epistatic effects are the rule, not the exception, in shaping the function of combinatorial variants. From foundational concepts to advanced validation, mastering epistatic analysis allows researchers to move from naive additive models to accurate, predictive frameworks. This enables the design of more efficient evolution campaigns, the anticipation of evolutionary trajectories, and the creation of robust biomolecules for therapeutics and industrial applications. Future directions point toward the integration of high-resolution epistatic maps with AI-driven generative models, paving the way for the de novo design of proteins with customized functional properties and the development of next-generation biologics with enhanced efficacy and stability. Embracing epistatic complexity is key to unlocking the full potential of directed evolution in biomedical research.