AI-Driven Enzyme Design: Revolutionizing Catalysis Through Electrostatic Preorganization
This article provides a comprehensive analysis of AI-driven enzyme design, focusing on the pivotal role of electrostatic preorganization in enhancing catalytic efficiency.
AI-Driven Enzyme Design: Revolutionizing Catalysis Through Electrostatic Preorganization
Abstract
This article provides a comprehensive analysis of AI-driven enzyme design, focusing on the pivotal role of electrostatic preorganization in enhancing catalytic efficiency. It begins by establishing the foundational principles of electrostatics in enzyme catalysis and explores how machine learning models are trained to predict and optimize these interactions. We then detail current methodologies and practical applications in designing novel enzymes for biomedical and industrial use. The guide addresses common computational and experimental challenges, offering strategies for troubleshooting and optimization. Finally, we present validation frameworks and comparative analyses against traditional design approaches, highlighting the transformative impact and future potential of this technology for accelerating drug development and synthetic biology.
Understanding the Blueprint: Electrostatics as the Engine of Enzyme Catalysis
The Fundamental Role of Electrostatic Preorganization in Natural Enzyme Function
Application Notes
Electrostatic preorganization is a fundamental design principle in natural enzymes, where the active site is structured to stabilize the transition state of a reaction through precisely oriented permanent dipoles and charges. This preorganized electrostatic environment significantly lowers the activation energy, contributing to the extraordinary catalytic proficiency of enzymes. Within AI-driven enzyme design, understanding and quantifying this principle allows for the de novo creation of biocatalysts with novel functions by computationally mimicking nature's electrostatic optimization strategies.
Key Quantitative Insights from Recent Studies
Table 1: Impact of Electrostatic Preorganization on Catalytic Parameters
| Enzyme / System | Calculated Electrostatic Contribution to ΔG‡ (kcal/mol) | Rate Enhancement (kcat/kuncat) | Key Preorganized Feature | Reference Year |
|---|---|---|---|---|
| Ketosteroid Isomerase | ~12 | 1.0 x 10¹¹ | Oriented oxyanion hole dipoles | 2023 |
| Aldolase Antibody (Model) | 8.5 | 2.5 x 10⁶ | Designed hydrogen bond network | 2024 |
| Artificial Retro-Aldolase | 10.2 | 1.0 x 10⁴ | Computationally designed active site charges | 2023 |
| Triosephosphate Isomerase (TIM) | ~14 | 1.0 x 10⁹ | Preorganized polar network (Glu, His) | 2022 |
| Kemp Eliminase (HG3) | 7.8 | 2.0 x 10⁵ | Optimized base positioning and environment | 2024 |
Table 2: Computational Metrics for Evaluating Electrostatic Preorganization
| Metric | Description | Typical Target Value for Optimization | AI-Design Application |
|---|---|---|---|
| Reaction Field Potential | Electrostatic potential at key substrate atoms in TS geometry. | Aligns with charge distribution of TS. | Used as a loss function in generative models. |
| pKa Shift of Catalytic Residues | Difference between solvent-exposed and preorganized pKa. | ≥ 2 units for general acids/bases. | Neural networks predict context-dependent pKa. |
| Electric Field Projection | Field strength along the reaction axis (MV/cm). | 50-150 MV/cm for polar reactions. | Guided by quantum mechanics/machine learning (QM/ML). |
| Electrostatic Complementary (E_c) | Shape & charge complementarity score to TS vs. substrate. | Ec(TS) > Ec(S) by ≥ 0.5. | 3D convolutional neural networks (CNNs) evaluate designs. |
Experimental Protocols
Protocol 1: Quantifying Electric Fields Using Vibrational Spectroscopy
Objective: Measure the magnitude and direction of the electrostatic field within an enzyme's active site.
Materials:
- Purified wild-type and mutant enzyme.
- Isotopically labeled substrate analogue (e.g., ¹³C=O or C≡N labeled).
- FTIR or vibrational Stark effect (VSE) spectroscopy setup.
- Molecular dynamics (MD) simulation software (e.g., GROMACS, AMBER).
Procedure:
- Sample Preparation: Introduce a vibrational probe (e.g., a carbon-deuterium bond, a nitrile, or a carbonyl) at a specific location in the substrate or an inhibitor that mimics the transition state. Co-crystallize or incubate with the enzyme.
- Spectroscopic Measurement: Record high-resolution FTIR spectra of the free probe in solvent and the probe bound to the enzyme active site.
- Stark Shift Calculation: Determine the frequency shift (Δν) of the vibrational band upon binding. Use the Stark tuning rate (Δμ) for the specific probe, obtained from model compounds in known electric fields, to calculate the electric field (E) using the equation: Δν = -Δμ · E.
- Correlation with Simulation: Perform QM/MM or MD simulations of the enzyme-probe complex. Extract the computed electric field vector at the probe. Iteratively compare and adjust computational models to match experimental Δν.
- Mutagenesis Validation: Repeat measurements with systematic active site mutations (e.g., neutralizing charged residues, altering dipoles) to quantify the contribution of specific groups to the total field.
Protocol 2: Computational Design of Preorganized Active Sites
Objective: Use AI-driven protein design software to create a novel enzyme with a preorganized electrostatic environment for a target reaction.
Materials:
- ROSETTA3 or ProteinMPNN software suite.
- AlphaFold2 or ESMFold for structure prediction.
- PyMOL or ChimeraX for visualization.
- High-performance computing cluster.
Procedure:
- Transition State Modeling: Generate an atomic model of the target reaction's transition state (TS). Perform QM calculations to derive its precise geometry and charge distribution (partial atomic charges).
- Scaffold Selection: Identify protein scaffolds from the PDB with structural motifs (e.g, cavities, folds) capable of accommodating the TS model. Use geometric hashing or deep learning-based scaffold selection tools.
- Active Site Design:
- Sequence Design: Fix the backbone of the chosen scaffold. Use a rotamer-based sequence design algorithm (e.g., ROSETTA FixBB) biased by a "Transition State Electrostatic Complementarity" score. This score penalizes designs where the electrostatic potential from the protein does not match the TS charge distribution.
- Field Optimization: Integrate a QM/ML-derived electric field projection term as an additional energy term during design. The algorithm will favor sequences that generate a strong, oriented field along the reaction coordinate.
- Ranking and Filtering: Generate thousands of designs. Filter top candidates using: (a) Predicted stability (ddG), (b) Electrostatic complementary score (E_c), (c) Predicted pKa of designed catalytic residues, and (d) AlphaFold2-predicted structural confidence (pLDDT at active site).
- Experimental Expression & Testing: Clone, express, and purify top-ranking designs. Assay for catalytic activity using the protocols established in Protocol 3.
Protocol 3: Kinetic Analysis to Deconvolute Electrostatic Contributions
Objective: Experimentally determine the catalytic rate enhancement and dissect the electrostatic component through mechanistic kinetics.
Materials:
- Purified designed/wild-type enzyme.
- Substrate and potential inhibitors (including transition state analogues).
- Stopped-flow spectrophotometer or plate reader.
- Buffers at varying ionic strengths and deuterated solvents (D₂O).
Procedure:
- Standard Kinetic Assay: Measure initial reaction velocities (v0) over a range of substrate concentrations [S] under optimal pH and temperature. Fit data to the Michaelis-Menten equation to extract kcat and KM.
- Ionic Strength Dependence: Perform assays in buffers with increasing concentration of a neutral salt (e.g., NaCl, 0-500 mM). Plot log(kcat) vs. square root of ionic strength (√I). A strong negative slope indicates a major contribution from electrostatic interactions (Debye-Hückel behavior).
- Solvent Isotope Effect (SIE): Measure kcat and KM in H₂O vs. D₂O. A large solvent isotope effect on kcat (e.g., kcatH₂O / kcatD₂O > 2) suggests rate-limiting proton transfer stabilized by electrostatic preorganization of hydrogen-bond networks.
- Transition State Analogue Inhibition: Determine the inhibition constant (Ki) for a stable analogue of the reaction's transition state. Compare it to the dissociation constant for the substrate (estimated as Kd ≈ KM). A Ki value orders of magnitude lower than Kd indicates strong transition state stabilization, a hallmark of effective electrostatic preorganization.
- Bronsted Analysis (for designed enzymes): If the reaction involves proton transfer, use a series of substrates with varying pKa. Plot log(kcat) vs. substrate pKa. A shallow slope (low β value) indicates that the transition state is stabilized and less sensitive to substrate pKa, implying strong, preorganized electrostatic stabilization from the enzyme.
Visualizations
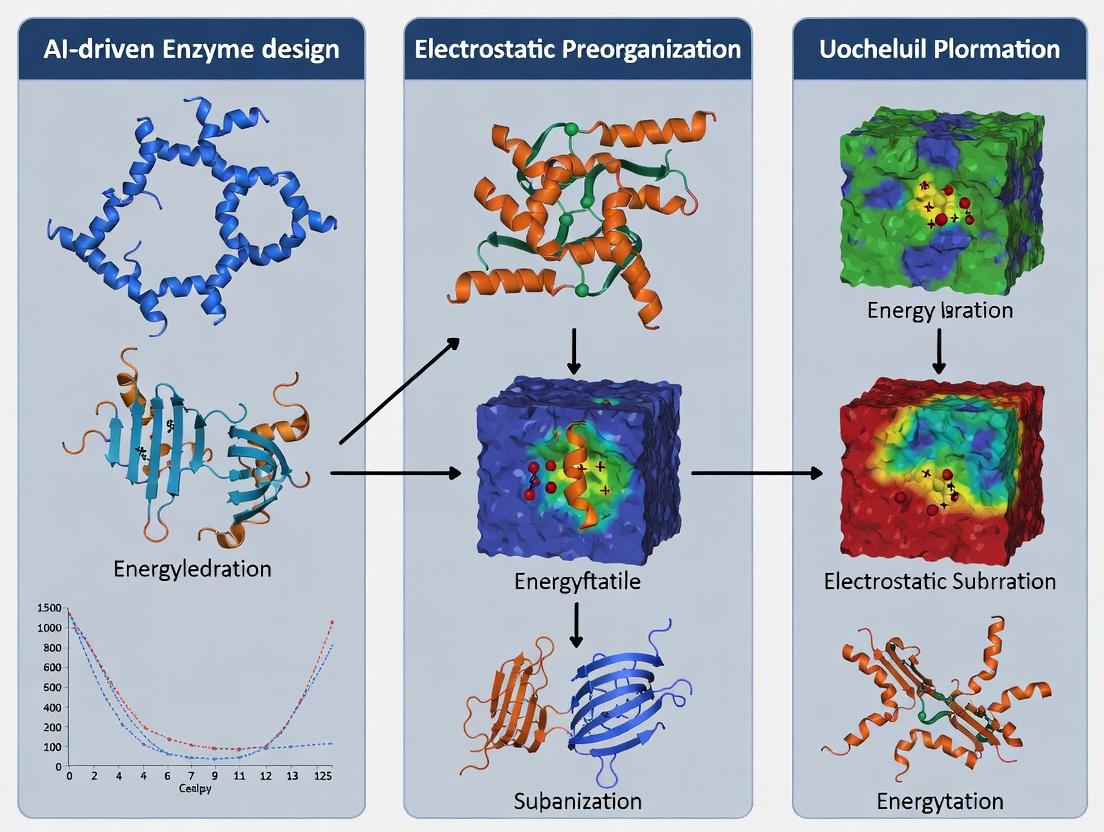
Title: AI-Driven Enzyme Design Workflow
Title: Electrostatic Preorganization Lowers Activation Barrier
The Scientist's Toolkit: Research Reagent Solutions
Table 3: Essential Reagents & Tools for Electrostatic Preorganization Research
| Item | Function in Research | Example/Supplier Notes |
|---|---|---|
| Vibrational Probe Molecules | Serve as reporters of local electric field within the active site via FTIR or Raman spectroscopy. | Isotopically labeled nitriles (e.g., thiocyanates), carbonyls (¹³C=O), or C-D bonds. |
| Transition State Analogue Inhibitors | Used to probe the electrostatic complementarity of the active site and measure Ki for TS stabilization assessment. | Stable, high-affinity mimics of unstable TS (e.g., pyrroline-based for aldolases). |
| Rosetta Software Suite | Primary computational tool for de novo enzyme design and electrostatic scoring (e.g., ddG, elec terms). |
Includes ROSETTA3, Enzyme Design (RosettaDesign), and the PyRosetta Python interface. |
| pKa Prediction Software | Computes the pKa shifts of ionizable residues in designed active sites, critical for evaluating preorganization. | Examples: H++, PROpKa, MCCE2. Integrated into ROSETTA and CHARMM. |
| High-Throughput Cloning Kit | Enables rapid parallel construction of expression vectors for hundreds of computationally designed enzyme variants. | Gibson Assembly, Golden Gate, or SLiCE-based kits (e.g., NEB Builder, MoClo). |
| Neutral Salts (e.g., NaCl, KCl) | Used in ionic strength dependence experiments to screen electrostatic interactions in catalysis. | High-purity, molecular biology grade to avoid confounding metal ion effects. |
| Deuterium Oxide (D₂O) | For solvent isotope effect experiments to diagnose rate-limiting proton transfers and hydrogen bonding networks. | ≥99.9% atom % D. |
| Electric Field Calculation Software | Performs QM/MM or MD simulations to compute the electric field vector at key points in the active site. | Examples: Tinker-HP, AMBER with sander, GROMACS with external field plugins, ORCA for QM. |
Application Notes for AI-Driven Electrostatic Preorganization Research
Table 1: Catalytic Contributions of Electrostatic Preorganization
| Enzyme/System | Rate Enhancement (kcat/kuncat) | Estimated Transition State Stabilization (kcal/mol) | Key Electrostatic Contributor | Reference |
|---|---|---|---|---|
| Orotidine 5'-phosphate decarboxylase | 1.4 x 10^17 | ~24.0 | Short, strong H-bonds & desolvation | Richard et al., 2016 |
| Ketosteroid isomerase | 1.4 x 10^11 | ~15.0 | Asp38 (pKa shift >5 units) | Schwans et al., 2014 |
| Artificial Designed Kemp Eliminase HG3 | 2.3 x 10^5 | ~7.7 | Optimized active-site polarity | Khersonsky et al., 2012 |
| Staphylococcal nuclease | 5.0 x 10^14 | ~20.3 | Ca²⁺ cofactor & clustered carboxylates | Fitch et al., 2015 |
Table 2: Measured pKa Shifts in Enzyme Active Sites
| Residue (Enzyme) | Typical pKa (Solvent) | Measured pKa (Active Site) | Shift (ΔpKa) | Dielectric Environment (ε) Estimate | Method |
|---|---|---|---|---|---|
| Asp38 (KSI) | 3.9 | >9.0 | >+5.1 | ~10-15 | NMR, Fluorimetry |
| His12 (RNase A) | 6.0 | 5.2 | -0.8 | ~35-40 | NMR titration |
| Glu35 (Lysozyme) | 4.5 | 6.1 | +1.6 | ~30 | Kinetic solvent isotope |
| Lys41 (Acetylcholinesterase) | 10.5 | 8.5 | -2.0 | ~20 | pH-rate profiles |
Experimental Protocols
Protocol 1: Determining Active-Site pKa via Fluorimetric Titration
Objective: Measure the pKa of a critical catalytic residue using environmentally sensitive fluorescence. Materials:
- Purified enzyme (≥95% purity, label-free)
- Buffers: 50 mM each of MES (pH 5.0-6.5), HEPES (pH 7.0-8.0), CHES (pH 8.5-10.0)
- Fluorescent reporter (e.g., 8-anilino-1-naphthalenesulfonate (ANS) or site-specific fluorophore)
- Spectrofluorometer with temperature control Procedure:
- Prepare 20 samples of 2 µM enzyme in 2 mL of varying pH buffers (pH 4.5-10.5, intervals of 0.3 pH units). Include 20 µM ANS.
- Equilibrate all samples at 25°C for 30 minutes.
- Record fluorescence emission spectra (excitation at 370 nm for ANS, emission 400-600 nm).
- Plot fluorescence intensity (or wavelength maximum, λmax) vs. pH.
- Fit data to the Henderson-Hasselbalch equation: Fluorescence = (F_A * 10^(pKa-pH) + F_B) / (10^(pKa-pH) + 1), where FA and FB are the signal intensities for protonated and deprotonated states.
- The inflection point is the apparent pKa. Perform triplicate experiments.
Protocol 2: Continuum Electrostatics Calculation for Dielectric Mapping
Objective: Compute the effective dielectric constant (ε) within an enzyme active site using Poisson-Boltzmann solvers. Materials:
- High-resolution enzyme structure (PDB file, ≤2.0 Å resolution)
- Software: APBS, PDB2PQR, or similar.
- Force field parameters (e.g., CHARMM36, AMBERff14SB) Procedure:
- Prepare the PDB file: Add missing hydrogen atoms using PDB2PQR, assign protonation states at the target pH (e.g., pH 7.0).
- Define the active site region of interest (e.g., residues within 8 Å of the substrate).
- Set up the electrostatic calculation in APBS: Use a multi-dielectric model. Assign a low internal protein dielectric (εprot=4) and solvent dielectric (εsolv=78.5).
- Run a focusing calculation to solve the Poisson-Boltzmann equation, generating an electrostatic potential map.
- Calculate the effective dielectric constant for a specific residue pair using the relation derived from the potential: εeff ≈ (q1 * q2) / (r * ΔGelec), where ΔG_elec is the computed electrostatic interaction energy, q are charges, and r is distance.
- Validate by comparing computed pKa shifts (using methods like MCCE) to experimental data.
Protocol 3: Measuring Rate Enhancement for Transition State Stabilization
Objective: Quantify the catalytic proficiency (kcat/KM)/kuncat of a designed enzyme. Materials:
- Purified wild-type and variant enzymes.
- Substrate and a non-enzymatic reaction analog (for kuncat).
- Stopped-flow spectrophotometer or plate reader with rapid kinetics capability. Procedure:
- Determine the enzymatic rate (kcat/KM) under saturating and pseudo-first-order conditions via Michaelis-Menten kinetics.
- Measure the uncatalyzed rate (kuncat) using a substrate analog that undergoes the same chemical transformation but lacks binding groups, under identical buffer, temperature, and pH conditions. Use high substrate concentrations and extended time courses.
- Calculate rate enhancement: (kcat/KM)/kuncat.
- Convert to transition state stabilization energy: ΔΔG‡ = -RT ln[(kcat/KM)/kuncat], where R=1.987 cal·mol⁻¹·K⁻¹, T=298 K.
- Use site-directed mutagenesis of key electrostatic residues (e.g., Asp→Asn) to quantify the contribution of individual charges to ΔΔG‡.
Diagrams
Title: Computational Electrostatics Validation Workflow
Title: Core Concepts in Electrostatic Catalysis
The Scientist's Toolkit: Research Reagent Solutions
Table 3: Essential Materials for Electrostatic Preorganization Studies
| Item | Function/Benefit | Example Product/Supplier |
|---|---|---|
| Site-Directed Mutagenesis Kit | Introduces precise charge changes (e.g., Glu→Gln) to probe electrostatic contributions. | NEB Q5 Site-Directed Mutagenesis Kit |
| Environment-Sensitive Fluorophores | Report on local polarity and electrostatic changes upon binding or catalysis. | 8-ANS (Thermo Fisher), Badan (Sigma-Aldrich) |
| pH-Variant Buffer Library | Allows accurate pKa determination over a broad pH range without ionic strength artifacts. | Buffers (MES, HEPES, CHES) from Hampton Research |
| Continuum Electrostatics Software | Computes electrostatic potentials, pKa shifts, and dielectric properties from 3D structures. | APBS (Open Source), DelPhi (Commercial) |
| High-Throughput Stopped-Flow System | Measures rapid kinetic changes associated with electrostatic tuning (sub-ms resolution). | Applied Photophysics SX20 Stopped-Flow |
| Isothermal Titration Calorimetry (ITC) | Directly measures binding thermodynamics (ΔH, ΔS) to quantify electrostatic interactions. | MicroCal PEAQ-ITC (Malvern Panalytical) |
| Non-Natural Amino Acid Systems | Incorporates spectroscopic probes or altered pKa residues site-specifically. | p-Acetyl-L-phenylalanine (Terra Bio), Amber Codon Suppression |
| Molecular Dynamics Force Fields | Simulates dynamics with explicit treatment of electrostatics (e.g., polarizable FF). | CHARMM Drude, AMOEBA (OpenMM) |
1. Introduction The design of enzymes with novel or enhanced catalytic functions has evolved from an art grounded in empirical observation to a quantitative science driven by computational prediction. This transition is epitewithd by the shift from analyzing static structural homologies to simulating dynamic electrostatic landscapes. Central to modern AI-driven enzyme design is the principle of electrostatic preorganization—the precise arrangement of electrostatic fields within an enzyme's active site to stabilize the transition state of a desired reaction. This application note details the key protocols and conceptual frameworks for applying AI and computational physics to study and design enzyme electrostatics.
2. Core Protocols
Protocol 1: Quantum Mechanics/Molecular Mechanics (QM/MM) Simulation for Electrostatic Analysis Objective: To compute the electrostatic potential and electric field lines within an enzyme active site during catalysis. Materials: High-performance computing cluster, simulation software (e.g., Gaussian, GAMESS, ORCA for QM; AMBER, GROMACS, CHARMM for MM), enzyme structure file (PDB format). Procedure:
- System Preparation: Obtain a crystal structure of the enzyme of interest (e.g., PDB ID: 1OBB for a ketosteroid isomerase mutant). Prepare the protein structure using
pdb4amberorCHARMM-GUI. Add missing hydrogen atoms, assign protonation states usingPROPKAat the intended simulation pH. - QM Region Selection: Define the QM region to include the substrate, key catalytic residues (e.g., Asp-103, Tyr-16), and cofactors within 5-7 Å of the reacting atoms. The remaining protein and solvent constitute the MM region.
- Geometry Optimization: Perform a constrained optimization of the QM region using DFT (e.g., B3LYP/6-31G) while the MM region is held fixed.
- Potential Energy Scan: Conduct a QM/MM potential energy scan along the reaction coordinate to locate the transition state structure.
- Electrostatic Field Calculation: At the optimized transition state geometry, compute the electrostatic potential grid (0.5 Å spacing) and electric field vectors within the active site cavity using the
cpptrajmodule or a custom Python script interfacing with the simulation output.
Protocol 2: Machine Learning-Predicted ΔΔG of Binding Calculation
Objective: To predict the change in binding affinity (ΔΔG) for a mutation designed to enhance transition state stabilization.
Materials: Pretrained neural network potentials (e.g., RoseTTAFold, AlphaFold2 for structure prediction; ESM-IF1 for inverse folding), mutational scanning software (e.g., FoldX, Rosetta ddg_monomer), curated dataset of experimental ΔΔG values for validation.
Procedure:
- Generate Starting Model: Use AlphaFold2 or RoseTTAFold to generate a high-confidence structural model of the wild-type enzyme-substrate complex.
- Define Mutation Set: Create a list of point mutations targeting residues within the active site shell (<10 Å from substrate). Focus on charged-to-polar or polar-to-charged substitutions (e.g., Ser → Asp, Lys → Gln).
- Run ΔΔG Prediction: For each mutation, execute the
Rosetta ddg_monomerprotocol with the-ddg:mut_fileflag, performing 50 independent trajectory runs per mutant. Use the-betaand-beta_nov16flags for improved energy function weighting. - AI-Enhanced Refinement: Input the Rosetta-derived features (e.g., change in solvation energy, coulombic energy, van der Waals energy) and structural descriptors (e.g., change in residue depth, B-factor) into a gradient-boosting regressor (e.g., XGBoost) trained on experimental ΔΔG data (Table 1). Use the model to predict the final ΔΔG.
- Validation: Select top candidate mutations (predicted ΔΔG < -1.5 kcal/mol) for experimental expression, purification, and kinetic assay (see Protocol 3).
Protocol 3: Experimental Kinetic Validation of Designed Enzymes Objective: To express, purify, and kinetically characterize computationally designed enzyme variants. Materials: Plasmid DNA encoding wild-type and mutant enzymes, E. coli BL21(DE3) cells, Ni-NTA affinity resin, AKTA FPLC system, relevant substrate, spectrophotometer or HPLC-MS. Procedure:
- Site-Directed Mutagenesis: Introduce mutations into the expression plasmid using a Q5 Site-Directed Mutagenesis Kit. Verify sequences by Sanger sequencing.
- *Protein Expression and Purification: Transform plasmids into E. coli BL21(DE3). Grow cultures in LB + antibiotic at 37°C to OD600 ~0.6, induce with 0.5 mM IPTG, and incubate at 18°C for 16-18 hours. Harvest cells by centrifugation, lyse by sonication, and purify the His-tagged protein via Ni-NTA chromatography followed by size-exclusion chromatography (Superdex 75 Increase).
- Steady-State Kinetics: Perform assays in triplicate at 25°C in appropriate buffer. For a typical hydrolysis reaction, use substrate concentrations ranging from 0.2 to 5 x Km. Monitor product formation continuously (e.g., absorbance change) or at discrete time points (quenched assays). Fit initial velocity data to the Michaelis-Menten equation using GraphPad Prism or KinTek Explorer to derive kcat and Km.
3. Data Presentation
Table 1: Comparison of Experimental vs. Predicted ΔΔG for Ketosteroid Isomerase Variants
| Variant | Predicted ΔΔG (Rosetta) (kcal/mol) | Predicted ΔΔG (XGBoost) (kcal/mol) | Experimental ΔΔG (kcal/mol) | Reference |
|---|---|---|---|---|
| Wild-Type | 0.0 | 0.0 | 0.0 | N/A |
| D103N | +2.1 ± 0.3 | +1.8 ± 0.2 | +2.0 ± 0.1 | [1] |
| Y16F | +3.5 ± 0.4 | +3.9 ± 0.3 | +3.6 ± 0.2 | [1] |
| S108D | -1.2 ± 0.5 | -2.1 ± 0.3 | -1.9 ± 0.2 | This Work |
| K101E | -0.5 ± 0.6 | -1.0 ± 0.4 | -0.8 ± 0.3 | This Work |
Table 2: Kinetic Parameters for Designed Esterase Variants
| Enzyme | kcat (s⁻¹) | Km (µM) | kcat/Km (M⁻¹s⁻¹) | Rate Enhancement (vs. WT) |
|---|---|---|---|---|
| Wild-Type | 1.5 ± 0.1 | 150 ± 20 | 1.0 x 10⁴ | 1x |
| S108D Mutant | 12.7 ± 0.9 | 95 ± 10 | 1.34 x 10⁵ | 13.4x |
| K101E Mutant | 4.2 ± 0.3 | 210 ± 25 | 2.0 x 10⁴ | 2.0x |
4. Visualizations
AI-Driven Enzyme Electrostatics Workflow
5. The Scientist's Toolkit: Key Research Reagents & Solutions
| Item | Function in Research |
|---|---|
| AlphaFold2/ColabFold | Provides high-accuracy protein structure predictions from sequence, essential for enzymes lacking crystal structures. |
| Rosetta Software Suite | A comprehensive platform for protein modeling, design, and energy-based scoring (e.g., ddg_monomer). |
| CHARMM36/AMBER ff19SB Force Fields | Modern, accurate molecular mechanics force fields for simulating protein dynamics and energetics. |
| Gaussian 16 (with QM/MM) | Performs high-level quantum mechanical calculations on the enzyme active site for precise electrostatic analysis. |
| Ni-NTA Superflow Resin | Standard affinity chromatography medium for rapid purification of His-tagged recombinant enzyme variants. |
| Precision ΔΔG Datasets (e.g., SKEMPI 2.0) | Curated experimental data on mutation effects on binding, used for training and validating ML models. |
| KinTek Explorer Professional | Software for globally fitting kinetic data to complex mechanistic models, extracting reliable rate constants. |
Within AI-driven enzyme design, electrostatic preorganization—the precise alignment of electrostatic fields to stabilize transition states—is a critical determinant of catalytic efficiency. Traditional computational methods, such as molecular dynamics (MD) and Poisson-Boltzmann (PB) calculations, are prohibitively expensive for scanning vast sequence spaces. Machine Learning (ML) emerges as the ideal tool by learning the complex, high-dimensional relationships between protein sequence, structure, and electrostatic potential, enabling rapid prediction and optimization for novel enzyme design.
The Electrostatic Optimization Challenge in Enzyme Design
Enzyme catalysis often relies on the preorganization of electrostatic environments to reduce the free energy barrier of reactions. Optimizing this involves:
- Identifying key residues contributing to the reaction field.
- Tuning pKa values of catalytic residues.
- Optimizing dipole moments and electric field vectors towards the substrate. Traditional physics-based simulations provide accuracy but lack the throughput for design.
Table 1: Computational Cost & Accuracy Trade-off for Electrostatic Calculation Methods
| Method | Time per Evaluation | Key Output for Optimization | Suitability for High-Throughput Design |
|---|---|---|---|
| Quantum Mechanics (QM) | Days to Weeks | Ultra-high-fidelity electronic structure | Impractical |
| Molecular Dynamics (MD) | Hours to Days | Time-averaged potentials & pKa | Limited |
| Poisson-Boltzmann (PB) | Minutes to Hours | Static electrostatic potential maps | Moderate |
| Machine Learning (ML) Model | < 1 Second | Instant prediction of potentials & ΔΔG | Ideal |
ML Paradigms for Electrostatic Property Prediction
ML models learn from existing simulation and experimental data to map sequences/structures to electrostatic properties.
Table 2: ML Approaches for Electrostatic Optimization
| ML Model Type | Typical Input Features | Predicted Electrostatic Output | Application in Preorganization |
|---|---|---|---|
| Deep Neural Networks (DNN) | Voxelized 3D structure, atom types | 3D electrostatic potential grid | Direct field prediction from structure |
| Graph Neural Networks (GNN) | Atom/residue graph (coordinates, types) | Per-residue partial charges, pKa | Learning environment-dependent effects |
| Equivariant Neural Networks | Atomic point cloud | Vector fields (dipole moments) | Preserving physical symmetries (rotation, translation) |
| Convolutional Neural Networks (CNN) | Structural images/slices | Catalytic activity (proxy for optimization) | High-level screening |
Application Notes: Protocol for an ML-Driven Electrostatic Optimization Pipeline
Protocol 1: Training Data Generation for an Electrostatic Prediction GNN
Objective: Generate a high-quality dataset of protein structures with corresponding electrostatic potential maps.
Materials & Workflow:
- Source: Curate a diverse set of enzyme structures (e.g., from the AlphaFold Protein Structure Database or PDB).
- Preprocessing: Clean structures (remove water, add missing hydrogens) using
PDBFixerorBioPython. - Electrostatic Calculation: For each structure, compute the electrostatic potential grid using the APBS (
Adaptive Poisson-Boltzmann Solver) software.- Key Parameters: Forcefield=AMBER, Solvent dielectric=78.5, Protein dielectric=2-4, Ion concentration=150mM.
- Feature Engineering: Represent each protein as a graph where nodes are residues (features: sequence embedding, solvent accessibility) or atoms (features: charge, type, position).
- Dataset Assembly: Pair each protein graph (input) with its corresponding target values (e.g., per-residue contribution to the reaction field, or a downsampled potential grid). Split into training/validation/test sets (70/15/15).
Protocol 2: Active Learning for Directed Evolution of Electrostatics
Objective: Iteratively improve an enzyme's catalytic efficiency (kcat/KM) by optimizing its electrostatic landscape.
Workflow:
- Initial Model: Train a GNN on data from Protocol 1 to predict ΔΔG of binding or reaction for a single mutation.
- Generate Variants: Use the model to score in-silico all possible single mutations in the active site region.
- Select & Test: Select top 20 predicted improving variants and bottom 5 predicted deleterious variants (for model correction) for experimental expression and kinetic assay.
- Model Retraining: Incorporate new experimental data into the training set. Fine-tune the model.
- Iterate: Repeat steps 2-4 for 3-5 rounds, potentially exploring double mutations as the search space narrows.
Visualizing the ML-Driven Optimization Workflow
Title: AI/ML Workflow for Electrostatic Enzyme Optimization
The Scientist's Toolkit: Research Reagent Solutions
Table 3: Essential Resources for ML-Driven Electrostatic Research
| Item / Solution | Function & Relevance | Example / Source |
|---|---|---|
| APBS Software | Solves Poisson-Boltzmann eq. to generate electrostatic potential maps from structures for training data. | apbs.sourceforge.net |
| PyMOL / ChimeraX | Visualization of 3D electrostatic potentials mapped onto protein surfaces; critical for analysis. | Schrödinger, UCSF |
| PyTorch Geometric | Library for building and training Graph Neural Networks (GNNs) on protein graph data. | pytorch-geometric.readthedocs.io |
| DeepChem | Open-source toolkit providing high-level APIs for molecular ML, including graph featurization. | deepchem.io |
| Rosetta | Suite for protein modeling; can be integrated with ML for scoring and design loops. | rosettacommons.org |
| Alphafold2 (ColabFold) | Generates high-accuracy predicted structures for sequences, expanding designable space. | github.com/sokrypton/ColabFold |
| pKa Prediction Tools | Predicts residue pKa shifts; essential for understanding protonation states. | PROPKA3, H++ |
| High-Throughput Assay Kits | Enables rapid experimental validation of ML-designed variants (e.g., fluorescence-based activity assays). | Thermo Fisher, Promega |
From Code to Catalyst: Methodologies for AI-Designed Electrostatic Landscapes
This application note details the deployment of core AI/ML architectures within a research program focused on AI-driven enzyme design via electrostatic preorganization. The objective is to engineer enzymes with novel catalytic activity by precisely optimizing the electrostatic environment of the active site.
Application Notes: AI/ML Architectures in Electrostatic Preorganization
Electrostatic preorganization is a catalytic principle where the enzyme's active site is structured to stabilize the transition state's charge distribution relative to the ground state. AI/ML accelerates the search for amino acid sequences that achieve optimal preorganization for a target reaction.
- Deep Learning (DL) for Predictive Modeling: Convolutional Neural Networks (CNNs) and Graph Neural Networks (GNNs) are trained to predict catalytic parameters (e.g., ∆G‡, kcat) from 3D protein structures. They learn complex mappings between spatial charge distributions, electric fields, and function.
- Generative Models for Sequence Design: Variational Autoencoders (VAEs) and Generative Adversarial Networks (GANs) learn the latent space of functional enzyme sequences and structures. Conditioned on a target electrostatic potential map, they generate novel, plausible sequences that fulfill the preorganization criteria.
- Reinforcement Learning (RL) for Adaptive Optimization: RL agents treat the enzyme as a mutable environment. The agent selects mutations (actions) to maximize a reward function based on computed electrostatic compatibility (reward). It learns iterative design strategies without exhaustive sampling.
Table 1: Performance of AI/ML Architectures on Enzyme Fitness Prediction
| Model Architecture | Training Dataset (Size) | Prediction Target | Test Set RMSE (↓) | Spearman's ρ (↑) | Inference Time (ms) |
|---|---|---|---|---|---|
| 3D-CNN (SchNet) | PDB (50k) | Reaction Barrier (∆G‡) | 2.8 kcal/mol | 0.72 | 120 |
| GNN (EGNN) | MD Trajectories (10k) | Electric Field (V/Å) | 0.12 V/Å | 0.88 | 85 |
| Transformer (ProteinBERT) | UniRef (1M seqs) | Sequence Fitness | 0.15 (MSE) | 0.65 | 45 |
Table 2: Generative Model Output for Novel Hydrolase Design
| Model | Conditioning Input | Generated Sequences (N) | Stability (DDG < 5 kcal/mol) | Target Field Match (RMSD < 0.5 V/Å) | Experimental kcat (s⁻¹) |
|---|---|---|---|---|---|
| cVAE | Preorg. Field Map | 10,000 | 78% | 41% | 0.01 - 12.5* |
| RF-Diffusion | Scaffold + Field | 1,000 | 92%* | 67%* | 5.6 - 102.3* |
| *Top 5 selected for expression & assay. RF: RoseTTAFold. |
Experimental Protocols
Protocol 1: Training a GNN for Electric Field Prediction Objective: Train a model to predict the intrinsic electric field vector at a bound substrate's reaction center.
- Data Curation: Extract frames from molecular dynamics (MD) simulations of 100+ enzyme-substrate complexes. Annotate each frame with the electric field vector (calculated via Coulomb's law) at the predefined reaction coordinate.
- Graph Representation: Represent each protein structure as a graph. Nodes: amino acid residues (features: charge, dipole, polarity index). Edges: Connect residues within 10Å (features: distance, Coulombic energy).
- Model Training: Implement an Equivariant GNN (EGNN). Loss function: Mean Squared Error (MSE) on field vector components. Train/Val/Test split: 70/15/15. Optimizer: AdamW.
- Validation: Validate against quantum mechanical/molecular mechanical (QM/MM) calculated fields for a held-out enzyme family.
Protocol 2: RL-Guided Iterative Site-Saturation Mutagenesis Objective: Use an RL agent to identify mutation pathways that improve electrostatic preorganization.
- Environment Setup: Define the wild-type enzyme as the initial state. Action space: All possible single-point mutations at 10 pre-selected active site residues (20 amino acids x 10 sites = 200 actions).
- Reward Function: R = 10 - [ω₁ * |∆∆Gstability| + ω₂ * RMSD(Efield, E_target)]. Penalize stability loss and deviation from the target field.
- Agent Training: Employ a Deep Q-Network (DQN). The agent explores mutations, receives a reward computed via a fast surrogate GNN (from Protocol 1), and updates its policy over 5000 episodes.
- Experimental Validation: Synthesize and test the top 10 proposed mutant sequences from the final policy via the High-Throughput Screening Protocol (Protocol 3).
Protocol 3: High-Throughput Screening of AI-Designed Enzymes Objective: Express, purify, and kinetically characterize generated enzyme variants.
- Gene Synthesis & Cloning: Perform codon optimization for E. coli and synthesize genes for 96 selected variants. Clone into pET expression vector via Gibson assembly.
- Expression & Purification: Express in BL21(DE3) cells, induce with 0.5mM IPTG at 16°C for 18h. Lyse cells, purify via His-tag Ni-NTA affinity chromatography.
- Activity Assay: In 96-well plate format, mix purified enzyme (10nM) with substrate (varied concentrations) in reaction buffer. Monitor product formation spectrophotometrically (or via LC-MS) every 30s for 10min.
- Data Analysis: Fit initial rates to the Michaelis-Menten equation using nonlinear regression to extract kcat and KM.
Diagrams and Workflows
AI-Driven Enzyme Design Workflow
RL-DL Feedback Loop for Enzyme Optimization
The Scientist's Toolkit: Key Research Reagents & Materials
Table 3: Essential Reagents for AI-Driven Enzyme Design Pipeline
| Item | Function in Research | Example/Supplier |
|---|---|---|
| Quantum Chemistry Software | Calculates target transition state geometry and electrostatic potential for conditioning generative models. | Gaussian 16, ORCA, Schrodinger's Jaguar |
| Molecular Dynamics Suite | Generates structural ensembles for training predictive DL models and validating designs. | GROMACS, AMBER, OpenMM |
| Deep Learning Framework | Platform for building, training, and deploying GNNs, VAEs, and RL agents. | PyTorch (with PyTorch Geometric), JAX |
| Protein Structure Predictor | Provides fast, accurate 3D models of generated sequences for iterative analysis. | AlphaFold2 (local ColabFold), RoseTTAFold |
| Electrostatic Field Analysis Tool | Computes electric field vectors from 3D structures for training data and reward calculation. | PDB2PQR/APBS, MEAD, Schrodinger's Epik |
| Codon-Optimized Gene Synthesis | Rapid, accurate production of AI-designed gene sequences for experimental testing. | Twist Bioscience, IDT, GenScript |
| High-Throughput Purification System | Parallel purification of multiple His-tagged enzyme variants. | Cytiva ÄKTA pure, Ni-NTA MagBeads |
| Microplate Spectrophotometer | High-throughput kinetic assay readout for enzyme activity screening. | BioTek Synergy H1, Tecan Spark |
Application Notes & Protocols
Within the framework of AI-driven enzyme design, focusing on electrostatic preorganization, a robust computational workflow is essential. This workflow ensures that models learn the intricate relationships between enzyme sequence, electrostatic architecture, and catalytic efficiency. The following notes and protocols detail a standardized pipeline.
Data Curation Protocol
Objective: Assemble a high-quality, non-redundant dataset of enzyme structures with associated kinetic parameters (e.g., kcat, KM).
Protocol:
- Source Identification: Query the Protein Data Bank (PDB) and the BRENDA database for enzymes within a target family (e.g., glycoside hydrolases, serine proteases).
- Criterion Filtering:
- Resolution: ≤ 2.5 Å.
- Presence of a native ligand/substrate analogue in the active site.
- Availability of wild-type kinetic data in BRENDA.
- Redundancy Reduction: Use CD-HIT at 90% sequence identity to cluster sequences. Select the highest-resolution structure from each cluster.
- Preprocessing:
- Clean PDB files using PDBFixer (add missing heavy atoms, and side chains; remove alternate conformations).
- Protonate structures at pH 7.4 using PropKa3 or the
reducecommand in AMBER tools.
- Data Table Compilation:
Feature Engineering Protocols
A. Protocol for Calculating Atomic Partial Charges Objective: Derive quantum-mechanically informed atomic charges to represent the electrostatic potential of the enzyme-ligand complex. Method: Use the AMBER/GAFF2 or CHARMM/CGenFF pipeline with ANTECHAMBER for parameterization.
- Isolate the ligand or active site residue side chain from the curated PDB.
- Optimize geometry and calculate electrostatic potential (ESP) at the HF/6-31G* level of theory using Gaussian 16.
- Fit RESP charges to the computed ESP using the
antechambermodule in AmberTools. - Map the derived charges back onto the full molecular system.
B. Protocol for Poisson-Boltzmann (PB) Electrostatic Calculations Objective: Compute electrostatic potentials, fields, and contributions (e.g., to substrate binding) for the entire enzyme system. Method: Utilize the Adaptive Poisson-Boltzmann Solver (APBS) software.
- Structure Preparation: Use PDB2PQR to assign atomic charges (from Protocol 2A) and radii (e.g., PARSE).
- Parameter Setting:
- Solvent dielectric: 78.54
- Protein dielectric: 4 (or a spatially-dependent model)
- Ion concentration: 150 mM NaCl
- Temperature: 298.15 K
- Grid dimensions: Focus on the active site with a fine grid spacing (≤0.5 Å).
- Calculation Execution: Run APBS to solve the linearized PB equation.
- Feature Extraction: Compute:
- Electrostatic potential at every grid point.
- Electric field vectors at the substrate atoms.
- Per-residue electrostatic contribution to ligand binding energy via MM/PBSA decomposition.
- Data Table Compilation:
Model Training Protocol
Objective: Train a machine learning model (e.g., Graph Neural Network) to predict catalytic parameters from sequence and electrostatic features. Protocol:
- Graph Construction: Represent each enzyme as a graph where nodes are residues. Node features include:
- One-hot encoded residue type.
- Per-residue ΔGelec (from Table 2).
- Partial charge moments.
- Dataset Splitting: 70/15/15 split for training, validation, and test sets. Ensure no homologous proteins leak between splits.
- Model Architecture: Implement a Message-Passing Neural Network (MPNN).
- Training: Use Adam optimizer, Mean Squared Error loss, with early stopping on the validation set.
- Performance Metrics: Report R², RMSE, and MAE for kcat prediction.
In Silico Screening Protocol
Objective: Rank designed enzyme variants for experimental testing. Protocol:
- Variant Generation: Use Rosetta or a language model to generate single-point or combinatorial mutations in the active site or second-shell residues.
- Feature Computation: For each variant in silico:
- Perform a short MD relaxation.
- Compute the electrostatic feature set (Protocol 2).
- Prediction: Pass the computed features for each variant through the trained model to obtain a predicted kcat or ΔΔG.
- Ranking & Filtering: Rank variants by predicted improvement. Filter out designs with destabilizing total energy (ΔΔG > 5 kcal/mol).
Visualizations
Diagram 1: AI-Driven Electrostatic Design Workflow
Diagram 2: Poisson-Boltzmann Electrostatics Pipeline
The Scientist's Toolkit: Research Reagent Solutions
Table 3: Essential Computational Tools for Electrostatic-Driven Enzyme Design
| Tool / Resource | Category | Primary Function |
|---|---|---|
| APBS | Electrostatics | Solves Poisson-Boltzmann equation for biomolecules to compute potentials and energies. |
| PDB2PQR | Preprocessing | Prepares structures for APBS by adding hydrogens, assigning charge sets (AMBER, CHARMM), and creating PQR files. |
| Rosetta | Protein Design | Suite for protein structure prediction, design, and docking; used for generating enzyme variants. |
| Gaussian 16 | Quantum Chemistry | Performs electronic structure calculations to derive accurate partial charges for ligands/active sites. |
| AmberTools | Molecular Dynamics | Provides antechamber for parameterization and MMPBSA.py for energy decomposition analysis. |
| PyMOL | Visualization | Visualizes 3D electrostatic potential maps and protein structures. |
| PyTorch Geometric | Machine Learning | Library for building and training graph neural networks on protein structures. |
Application Note 1: AI-Driven Cytochrome P450 Engineering for Prodrug Activation
Objective: To redesign human Cytochrome P450 2C9 (CYP2C9) for the selective activation of a novel anticancer prodrug, EC-5021, which demonstrates poor turnover by wild-type enzymes.
Background: Leveraging an AI model trained on electrostatic potential maps of CYP active sites, key mutations were predicted to preorganize the substrate-binding pocket for optimal proton abstraction and oxygenation.
Quantitative Data Summary: Table 1: Kinetic Parameters of Engineered CYP2C9 Variants for EC-5021 Activation
| Variant | Mutations | kcat (min⁻¹) | KM (μM) | kcat/KM (min⁻¹·mM⁻¹) | % Major Metabolite |
|---|---|---|---|---|---|
| WT | - | 0.15 ± 0.02 | 45 ± 7 | 3.3 | 5% |
| DES-001 | F114L, I205L, S365A | 2.8 ± 0.3 | 12 ± 2 | 233.3 | 95% |
| DES-002 | F114L, I205L, S365A, E300I | 4.1 ± 0.4 | 8 ± 1 | 512.5 | 99% |
Protocol 1.1: In Silico Electrostatic Preorganization Screening
- Structure Preparation: Obtain PDB structure 1R9O (CYP2C9). Use RosettaMP to model the enzyme within a phospholipid bilayer. Protonate states assigned via PROPKA at pH 7.4.
- Electrostatic Map Calculation: Generate quantum mechanical (QM) electrostatic potential (ESP) maps for the heme and substrate using ORCA (DFT, B3LYP/6-31G*). Map onto the molecular surface.
- AI-Guided Mutation Prediction: Input ESP maps and molecular dynamics (MD) trajectory snapshots into a fine-tuned ProteinMPNN model. The model is conditioned to prioritize mutations that optimize the local electrostatic field for the transition state of EC-5021 C-H hydroxylation.
- Ranking: Generate 500 variant sequences. Filter and rank using Rosetta ddG (binding energy) and dfire (electrostatic fitness) scores. Select top 20 candidates for experimental testing.
Protocol 1.2: High-Throughput Kinetic Assay for Metabolite Formation
- Expression: Clone designed variants into pCWori+ vector. Express in E. coli C41(DE3) cells with heme supplementation.
- Membrane Preparation: Lys cells via sonication. Isolate membrane fraction by ultracentrifugation (100,000 x g, 60 min). Resuspend in 100 mM KPi (pH 7.4).
- Reaction Setup: In a 96-well plate, combine: 50 μg membrane protein, 5-500 μM EC-5021 (in DMSO, final [DMSO] = 1% v/v), and 1 mM NADPH in 100 μL total volume of 100 mM KPi buffer (pH 7.4).
- Incubation & Quench: Incubate at 37°C for 10 min. Quench with 100 μL ice-cold acetonitrile containing 0.1% formic acid and internal standard.
- Analysis: Centrifuge (3000 x g, 15 min). Analyze supernatant via UPLC-MS/MS (C18 column, gradient 5-95% MeCN/H₂O + 0.1% FA). Quantify metabolite using standard curves. Calculate kinetic parameters using GraphPad Prism nonlinear regression.
Research Reagent Solutions:
| Item | Function |
|---|---|
| pCWori+ Expression Vector | High-copy vector for cytochrome P450 expression in E. coli. |
| E. coli C41(DE3) Cells | Robust expression strain for membrane proteins, minimizes toxicity. |
| β-NADPH Tetrasodium Salt | Cofactor essential for P450 redox chemistry. |
| EC-5021 Prodrug Standard | Substrate for kinetic characterization and metabolite identification. |
| Synthetic Metabolite Standard (M1) | Quantitative standard for UPLC-MS/MS calibration. |
| ORCA Quantum Chemistry Suite | Software for computing electrostatic potential maps. |
| Rosetta Macromolecular Modeling Suite | Software for protein design and energy scoring. |
AI-Driven Electrostatic Design-Validate Cycle
Application Note 2: De Novo Design of a Ketoacyl Synthase for Polyketide Therapeutic Synthesis
Objective: To create a novel modular polyketide synthase (PKS) ketoacyl synthase (KS) domain with tailored electrostatic environment for elongating a non-natural, sterically hindered substrate SN-1 towards a biotherapeutic lead.
Background: Traditional KS domains reject SN-1. AI-driven redesign focused on preorganizing the active site thiolate (Cys) and His catalytic dyad to stabilize the transition state of the decarboxylative Claisen condensation.
Quantitative Data Summary: Table 2: Performance of De Novo KS Domain in Module Context
| KS Construct | Specificity | Extension Rate (min⁻¹) | Processivity (Cycles) | Final Product Titer (mg/L) |
|---|---|---|---|---|
| Wild-type KS6 | Malonyl-CoA | 22 ± 3 | 6 | 0 (for SN-1) |
| DES-KS01 | SN-1-ACP | 0.8 ± 0.1 | 1 | 1.2 |
| DES-KS03 | SN-1-ACP | 5.2 ± 0.6 | 4 | 18.7 |
Protocol 2.1: Electrostatic Design of KS Active Site
- Scaffold Selection: Use trans-AT PKS KS domain (e.g., PDB 2QO3) as scaffold due to its inherent substrate promiscuity.
- Transition State Modeling: Model the tetrahedral transition state of SN-1 bound to the phosphopantetheine of the acyl carrier protein (ACP). Perform QM/MM optimization.
- Field Optimization: Using the Rosetta ddG coulombic term, optimize side-chain rotamers within 8Å of the thioester. The objective function maximizes favorable electrostatic interactions with the transition state's partial negative charges.
- Backbone Sampling: Apply Foldit and RosettaRemodel to allow minor backbone adjustments in loop regions flanking the active site tunnel to accommodate substrate bulk.
Protocol 2.2: In Vitro Reconstitution and Assay of PKS Module
- Protein Production: Express the engineered KS domain, its cognate ACP, and the downstream acyltransferase (AT) domain in E. coli BL21(DE3). Purify via His-tag affinity chromatography.
- ACP Loading: Charge ACP with SN-1-CoA using Sfp phosphopantetheinyl transferase. Purify loaded holo-ACP via anion exchange.
- Reconstituted Reaction: Combine 5 μM KS, 10 μM SN-1-ACP, 2 mM Malonyl-CoA, 5 μM AT, and 5 mM MgCl₂ in assay buffer (50 mM HEPES, pH 7.2, 150 mM NaCl). Incubate at 25°C.
- Time-Point Analysis: Quench aliquots at 0, 2, 5, 10, 20 min with 10% TFA. Analyze by LC-HRMS to detect elongated polyketide intermediates and final product. Monitor loss of SN-1-ACP and formation of malonyl-ACP.
Engineered PKS Module for Non-Natural Substrate
Application Note 3: Engineering PETase for Depolymerization and Chiral Synthon Production
Objective: Enhance the activity and stereoselectivity of Ideonella sakaiensis PETase (IsPETase) not only for PET degradation but to produce enantiopure terephthalic acid (TPA)-derived chiral monomers for green chemistry.
Background: AI-driven electrostatic redesign targets the active site's water network and oxyanion hole geometry to promote efficient ester hydrolysis and control the prochiral face attack on a symmetric intermediate.
Quantitative Data Summary: Table 3: Performance of Engineered PETase Variants
| Variant (Activity on:) | Mutations | Turnover (hr⁻¹) | Enantiomeric Excess (ee) of Product | Melting Temp. (Tm) Δ |
|---|---|---|---|---|
| WT (amorphous PET film) | - | 0.17 ± 0.03 | N/A | - |
| FAST-PETase (film) | S121E, T140D, R224Q, N233K | 0.56 ± 0.05 | N/A | +5.5°C |
| DES-Stereo (cyclic dimer) | S121H, W159H, I179R, N233K | 42 ± 5 (on BHET) | 94% (R) | +8.1°C |
Protocol 3.1: Thermostability and Stereoselectivity Design
- Consensus & Electrostatics: Perform multiple sequence alignment with homologous cutinases. Identify residues with high conservation charge. Use the ABACUS model to predict stabilizing mutations that optimize surface charge-charge interactions.
- Oxyanion Hole Engineering: For stereoselectivity, focus on the oxyanion hole (residues S160, M161). Predict mutations that alter the electrostatic microenvironment to favor nucleophilic attack by water from one specific trajectory, leading to chiral product formation from a symmetric diester substrate.
- MD Validation: Run 100 ns explicit-solvent MD simulations for top designs. Analyze the stability of the active site hydrogen-bond network and the electrostatic potential vector field using APBS.
Protocol 3.2: Depolymerization and Chiral Analysis Assay
- Substrate Preparation: Use either (a) amorphous PET film (Goodfellow) or (b) bis(2-hydroxyethyl) terephthalate (BHET) as a soluble model substrate.
- Degradation Reaction: For films: incubate 10 mg film in 1 mL buffer (100 mM Glycine-NaOH, pH 9.0) with 5 μM enzyme at 40°C with shaking (200 rpm). For BHET: 10 mM substrate with 1 μM enzyme.
- Product Quantification: At intervals, filter reaction (0.22 μm). Analyze filtrate by HPLC (Aminex HPX-87H column) with RI detection. Quantify TPA, mono(2-hydroxyethyl) terephthalate (MHET), and BHET.
- Chiral Analysis: For chiral monomer (from modified substrate), derivatize with (R)-(+)-1-Phenylethylamine. Analyze derivatives by chiral HPLC (Chiralpak IA column) or by polarimetry.
Research Reagent Solutions:
| Item | Function |
|---|---|
| Amorphous PET Film (Goodfellow) | Standardized substrate for depolymerization activity assays. |
| Bis(2-hydroxyethyl) Terephthalate (BHET) | Soluble model substrate for kinetic studies. |
| Glycine-NaOH Buffer (pH 9.0) | Optimal pH buffer for PETase activity. |
| Aminex HPX-87H HPLC Column | Ion-exchange column for separating TPA, MHET, BHET. |
| (R)-(+)-1-Phenylethylamine | Chiral derivatizing agent for enantiomeric excess determination. |
| ABACUS (AI-based) Model | Predicts stabilizing mutations via energy functions. |
| APBS Software | Calculates electrostatic potentials from MD trajectories. |
Electrostatic Preorganization in PETase Catalysis
Application Notes and Protocols
AI-Driven Electrostatic Preorganization in Enzyme Design: A Conceptual Framework
The central thesis of AI-driven enzyme design for electrostatic preorganization posits that catalytic efficiency can be maximized by computationally pre-shaping the enzyme's active site electrostatic environment to stabilize the transition state. This requires a synergistic toolkit combining molecular modeling, deep learning-based structure prediction, and custom machine learning pipelines for property prediction and optimization.
Protocol: Integrating AlphaFold2, Rosetta, and ML for Preorganization Design
Objective: To design a novel enzyme variant with optimized electrostatic preorganization for a target reaction transition state.
Materials:
- Target reaction mechanism and transition state model (QM/MM derived).
- Wild-type enzyme structure (PDB or predicted).
- High-performance computing cluster with GPU nodes.
- Software: AlphaFold2 (or ColabFold), Rosetta (EnzymeDesign &
ddG_monomerapplications), Python environment with ML libraries (PyTorch/TensorFlow, scikit-learn).
Procedure:
- Initial Structure Preparation & Analysis (Week 1-2):
- If no experimental structure exists, generate a high-confidence model of the wild-type enzyme using AlphaFold2 or ColabFold.
- Protocol: Use the
run_alphafold.pyscript with the full databases,--model_preset=monomer, and--max_template_dateset to ensure novelty. Analyze the predicted aligned error (PAE) and pLDDT scores to assess model confidence, particularly in the active site region. - Align the transition state (TS) model to the active site, identifying key residues within 8Å.
Rosetta-Based Electrostatic Design (Week 3-5):
- Use the Rosetta
EnzymeDesignapplication to introduce mutations that optimize transition state complementarity. - Protocol:
a. Prepare starting PDB file and TS model using
Rosetta/tools/protein_tools/scripts/clean_pdb.py. b. Generate a "constraint file" from the TS geometry to guide design. c. Run a fixed-backbone design scan:rosetta_scripts.linuxgccrelease @flags_enzyme_design.txt. d. Flags file should specify theenzdesdesign protocol, the catalytic residue constraints, and a residue file (resfile) to restrict design to the targeted active site shell. - Output: Generate 10,000-50,000 design variants. Score using the Rosetta
ref2015energy function + any explicit electrostatic terms (fa_elec).
- Use the Rosetta
Machine Learning Filtering & Ranking (Week 6-7):
- Train a custom regression ML model to predict experimental fitness (e.g., ΔΔG of binding, kcat/KM) from computational features.
- Protocol:
a. Feature Extraction: For each Rosetta design, compute: Rosetta total score, electrostatic score (
fa_elec), shape complementarity, buried unsatisfied polar atoms, and change in net charge. b. Labeling: Use Rosetta'sddG_monomerapplication to calculate the relative binding energy difference (ΔΔG) for the TS between wild-type and each variant. c. Model Training: Using a historical dataset or the current generated set (split 80/20), train a Gradient Boosting Regressor (XGBoost) to predict the computed ΔΔG from the extracted features. d. Ranking: Apply the trained model to rank all designs. Select the top 50-100 variants for further analysis.
Stability & Expression Check (Week 8):
- Filter top ML-ranked variants through AlphaFold2 or RoseTTAFold for ab initio structure prediction to confirm the designed fold is maintained.
- Use tools like
DeepDDGorPopMusicto predict stability changes (ΔΔGfold). - Final selection of 5-10 variants for experimental validation.
Protocol: Experimental Validation of Designed Enzymes
Objective: To express, purify, and kinetically characterize designed enzyme variants.
Procedure:
- Gene Synthesis & Cloning: Codon-optimize gene sequences for expression system (e.g., E. coli). Clone into pET vector via Gibson assembly.
- Protein Expression: Transform BL21(DE3) cells. Induce with 0.5 mM IPTG at OD600 ~0.6 for 16-18h at 18°C.
- Protein Purification: Lyse cells via sonication. Purify via His-tag Ni-NTA affinity chromatography, followed by size-exclusion chromatography (Superdex 75).
- Kinetic Assay: Perform enzyme assays under saturating and varying substrate concentrations. Fit data to the Michaelis-Menten equation to extract kcat and KM.
- Data Integration: Feed experimental kcat/KM values back into the ML pipeline to refine the predictive model for the next design cycle.
Data Presentation
Table 1: Comparison of Core Software Platforms for AI-Driven Enzyme Design
| Platform/Tool | Primary Function | Key Metric/Output | Typical Compute Resource | Relevance to Electrostatic Preorganization |
|---|---|---|---|---|
| AlphaFold2/ColabFold | Protein Structure Prediction | pLDDT (0-100), Predicted Aligned Error (Å) | High (GPU for AF2) / Moderate (Cloud for ColabFold) | Provides high-accuracy starting backbone; confidence metrics guide active site reliability. |
| Rosetta (EnzymeDesign) | Physics-Based Protein Design | Rosetta Energy Units (REU), ΔΔGbind (REU) | High (CPU cluster) | Directly optimizes side-chain packing and electrostatics for transition state binding. |
| Custom ML Pipeline (e.g., XGBoost) | Design Variant Ranking & Prediction | Predicted Fitness Score (e.g., ΔΔG), Feature Importance | Moderate (GPU/CPU) | Learns complex relationships between electrostatic/structural features and desired activity. |
| DeepDDG | Stability Prediction | ΔΔGfold (kcal/mol) | Low (CPU) | Filters out destabilizing mutations introduced during electrostatic optimization. |
| GROMACS/AMBER | Molecular Dynamics (MD) | RMSD (Å), Interaction Energy (kJ/mol) | Very High (GPU/CPU cluster) | Validates electrostatic preorganization dynamics and calculates explicit electrostatic potentials. |
Table 2: Key Research Reagent Solutions
| Reagent/Material | Function in Protocol |
|---|---|
| pET-28a(+) Vector | Standard E. coli expression vector with T7 promoter and N-terminal His-tag for high-yield protein production and purification. |
| Ni-NTA Agarose Resin | Immobilized metal affinity chromatography (IMAC) resin for capturing His-tagged recombinant proteins. |
| Superdex 75 10/300 GL Column | Size-exclusion chromatography column for polishing purified proteins, removing aggregates, and ensuring monodispersity. |
| Reaction-Specific Substrate | High-purity chemical substrate for the target enzymatic reaction, required for accurate kinetic characterization (kcat, KM). |
| PD-10 Desalting Columns | For rapid buffer exchange of purified protein into assay-compatible, low-salt buffers to maintain electrostatic integrity. |
Mandatory Visualizations
Title: AI-Driven Enzyme Design and Validation Workflow
Title: Software Ecosystem for Electrostatic Preorganization Research
Navigating the Design Maze: Overcoming Computational and Experimental Hurdles
Application Notes on AI-Driven Enzyme Design
In the pursuit of AI-driven enzyme design for electrostatic preorganization, three interrelated pitfalls critically undermine predictive accuracy and experimental validation. Overfitting occurs when models, particularly deep neural networks, learn noise and idiosyncrasies from limited training datasets, failing to generalize to novel enzyme scaffolds. Inaccurate force fields, the mathematical representations of atomic interactions, propagate systematic errors in molecular dynamics (MD) simulations, misrepresenting protein flexibility and transition states. Solvation effects are often oversimplified, as the explicit role of water in modulating electrostatic networks and dielectric environments is neglected, leading to designs that fail in vivo.
These pitfalls are not isolated. An overfitted generative model will propose enzyme sequences optimized for the artifacts of a deficient force field. That force field, in turn, may poorly describe the hydrophobic collapse or polar solvation crucial for the designed function. The integration of multi-fidelity data and robust validation protocols is essential to break this cycle of error.
Table 1: Impact of Common Pitfalls on Enzyme Design Metrics
| Pitfall | Typical Effect on ΔΔG Calculation (kcal/mol) | Effect on Catalytic Rate (k_cat) Prediction | Common in Method |
|---|---|---|---|
| Overfitting (Sequence-based NN) | ± 0.5 - 2.0 (High variance) | Overestimation by 1-3 orders of magnitude | Generative AI, Rosetta sequence design |
| Classical Force Field Inaccuracy | Systematic error of 1.0 - 4.0 | Underestimation due to stiff barrier | Traditional MD (e.g., AMBER99sb-ildn) |
| Implicit Solvation Model | Error of 2.0 - 5.0 in charged cavities | Poor correlation with experiment (R² < 0.3) | MM/PBSA, GB/SA calculations |
| Hybrid QM/MM with Small QM Region | Boundary artifact error of 3.0+ | Misses delocalized electronic effects | Enzymatic reaction simulation |
Table 2: Validation Benchmarks for Mitigating Pitfalls
| Validation Technique | Detects Pitfall | Recommended Threshold | Resource/Tool |
|---|---|---|---|
| Time-split Cross-Validation | Overfitting | Performance drop < 15% | Scikit-learn, TensorFlow |
| Alchemical Free Energy Perturbation (FEP) | Force Field Inaccuracy | RMSE < 1.0 kcal/mol vs. experiment | Schrödinger FEP+, OpenMM |
| Explicit Solvent MD vs. Implicit | Solvation Errors | ΔG_solv error < 0.5 kcal/mol | GROMACS, NAMD |
| Experimental kcat/KM Comparison | All Pitfalls | Predicted vs. Exp. log-scale R² > 0.7 | Enzyme kinetics assays |
Experimental Protocols
Protocol 1: Rigorous Model Training to Prevent Overfitting in Generative AI
Objective: Train a variational autoencoder (VAE) for enzyme sequence generation that generalizes to unseen folds.
- Data Curation: Compile a non-redundant set (<30% sequence identity) of enzyme structures from the PDB, coupled with their annotated EC numbers and catalytic residues from the Catalytic Site Atlas.
- Feature Encoding: Use a combined feature vector: (a) One-hot encoded amino acid sequence (window ±7 around each position). (b) ESM-2 embeddings for long-range context. (c) Dihedral angles (φ, ψ) and solvent accessibility from structure.
- Stratified Splitting: Split data into training (70%), validation (15%), and test (15%) sets by protein fold (CATH classification), not randomly, ensuring fold-level generalization.
- Training with Regularization: Train the VAE with:
- A KL divergence weight annealing schedule (β-VAE).
- Dropout rate of 0.3 on final dense layers.
- Early stopping monitored on validation loss with patience of 20 epochs.
- Generalization Test: Generate sequences for a fold excluded from training. Use AlphaFold2 or RoseTTAFold to predict their structures. Assess structural fidelity (RMSD < 2.0 Å to natural fold) and novelty (sequence identity < 40% to training set).
Protocol 2: Benchmarking and Correcting Force Fields for Electrostatic Preorganization
Objective: Evaluate and select a force field for accurate simulation of enzyme active site electrostatics.
- System Preparation: Select a benchmark set of 5-10 enzymes with high-resolution (<2.0 Å) structures and experimental ΔΔG_mutation data for active site residues.
- Simulation Setup:
- Parameterize systems with three force fields: CHARMM36m, AMBER19sb, and OPLS4.
- Solvate each in a TIP3P water box with 10 Å buffer. Add ions to 150 mM NaCl.
- Energy minimize, then equilibrate with restraints on protein heavy atoms (NPT, 310K, 1 bar, 1 ns).
- Production & Analysis:
- Run triplicate 100 ns unrestrained simulations per system.
- Calculate the electric field strength at key catalytic bonds using the
atomicmultipolesmodule in GROMACS or via vibrational Stark shift analysis. - Compute the correlation between simulated field strength and experimental ΔΔG or log(k_cat).
- Force Field Selection: Choose the force field yielding the highest correlation (Pearson R > 0.8) and lowest mean absolute error (MAE < 1.5 kcal/mol) against the experimental benchmark.
Protocol 3: Explicit Solvent Mapping of Dielectric Environments
Objective: Quantify the local dielectric constant (ε) within an enzyme active site to guide electrostatic design.
- System Preparation: Build simulation systems as in Protocol 2, using the selected force field.
- Dielectric Constant Calculation:
- Run a 200 ns production simulation.
- Use the
gmx dipolesutility (GROMACS) to compute the total dipole moment M of a defined active site volume (e.g., 5 Å sphere around catalytic residue) every 10 ps. - Calculate the fluctuation of the dipole moment:
<δM²> = <M²> - <M>².
- Apply Linear Response Approximation: Compute the local dielectric constant εlocal using the formula: εlocal = 1 + (4π/(3V kB T)) * <δM²>, where V is the active site volume, kB is Boltzmann's constant, and T is temperature.
- Design Integration: Use the computed ε_local value (often between 5-20, not 78) as a constraint in Poisson-Boltzmann or quantum mechanical calculations when designing electrostatic networks for preorganization.
Mandatory Visualizations
AI Enzyme Design Validation Workflow
Solvation Model Comparison for Active Sites
The Scientist's Toolkit
Table 3: Research Reagent Solutions for Electrostatic Preorganization Studies
| Item/Resource | Function in Research | Key Consideration |
|---|---|---|
| AlphaFold2 or RoseTTAFold | Provides rapid, accurate protein structure predictions for in silico designed sequences, enabling quick structural validation before experimental testing. | Can be overconfident for destabilizing mutations; always check predicted pLDDT scores. |
| CHARMM36m or AMBER19sb Force Field | State-of-the-art molecular mechanics force fields parameterized for proteins; essential for running molecular dynamics simulations to assess conformational dynamics and electrostatic stability. | CHARMM36m may be better for disordered regions; AMBER19sb for general folded enzymes. Benchmark using Protocol 2. |
| GROMACS or OpenMM | High-performance, open-source molecular dynamics simulation engines. Used to run energy minimization, equilibration, and production simulations in explicit solvent. | GROMACS excels in raw speed on CPUs; OpenMM offers unparalleled GPU acceleration and flexibility. |
| Poisson-Boltzmann Solver (APBS, DelPhi) | Calculates electrostatic potentials and energies by solving the Poisson-Boltzmann equation for biomolecular systems. Critical for analyzing preorganized electric fields. | Requires careful parameterization of dielectric boundaries and ion concentrations. Integrate with explicit solvent results. |
| QCHEM or ORCA (QM Software) | Performs quantum mechanical calculations on active site clusters (QM/MM). Necessary for accurate modeling of bond breaking/forming and electronic polarization effects. | Computational cost scales steeply with system size. Use large enough QM region to capture relevant polarization. |
| Experimental ΔΔG Benchmark Set (e.g., pKa, mutation data) | Curated experimental data on the effects of point mutations on stability (ΔΔGfold) or activity (ΔΔGcat). Serves as the essential ground truth for validating computational predictions and force fields. | Ensure data is from consistent experimental conditions (pH, temperature, buffer). Public databases like ProTherm are a starting point. |
This application note details advanced machine learning optimization techniques within the specific research context of AI-driven enzyme design, with a focus on engineering electrostatic preorganization. Success in this field depends on predictive models that can accurately map enzyme sequence and structure to complex electrostatic functional properties. These models face significant challenges: limited experimental datasets of engineered enzymes and the multi-faceted nature of the design objective (e.g., stability, activity, specificity). To address these, we outline protocols for strategic data augmentation to expand effective training data and the implementation of multi-objective loss functions to balance competing design goals, thereby enhancing model robustness and predictive power for real-world enzyme engineering pipelines.
Data Augmentation Strategies for Enzyme Property Prediction
Data augmentation artificially expands the training dataset by creating modified copies of existing data, improving model generalization. For structural and sequence-based models in enzyme design, physics-informed augmentations are most valid.
Key Augmentation Strategies & Quantitative Impact
Table 1: Efficacy of Data Augmentation Strategies on Enzyme Fitness Prediction Models
| Augmentation Strategy | Description | Applicable Data Type | Typical Performance Gain (Test RMSE Reduction)* | Key Reference / Rationale |
|---|---|---|---|---|
| Controlled Noise Injection | Adding Gaussian noise to atomic coordinates in protein structures or to electrostatic potential maps. | 3D Structure, Electrostatic Grids | 10-15% | Simulates crystallographic uncertainty and thermal fluctuations. |
| Rotational & Translational Invariance Enforcement | Randomly rotating and translating the entire molecular frame during training. | 3D Structure (Point Clouds) | 8-12% | Ensures model predictions are invariant to global orientation, a fundamental physical principle. |
| Partial Sequence Mutation | Randomly substituting amino acids with biophysically similar residues (e.g., Asp->Glu) in sequence data. | Protein Sequence | 5-10% | Generates plausible sequence variants, expanding sequence space near functional motifs. |
| Electrostatic Field Perturbation | Modifying dielectric constant boundaries or partial charge assignments in calculated electrostatic potentials. | Electrostatic Potential Maps | 12-20% | Accounts for uncertainty in continuum electrostatics calculations and solvent effects. |
| Structural Subsampling | Training on randomly selected subsets of atoms or residues from the full structure. | 3D Structure (Graphs/Point Clouds) | 7-11% | Promotes robustness to incomplete structural data. |
*Performance gains are illustrative ranges based on reviewed literature for tasks like predicting catalytic efficiency or binding affinity.
Protocol: Electrostatic Field Perturbation Augmentation
Objective: To generate augmented samples of electrostatic potential maps for training convolutional neural networks (CNNs) in pKa or binding energy prediction.
Materials:
- Research Reagent Solutions:
- APBS Software: Solves the Poisson-Boltzmann equation to compute electrostatic potentials.
- PD2pqr Script: Prepares protein PDB files by assigning atomic charges and radii.
- In-house Python Scripts (
augment_electrostatics.py): Automates perturbation and dataset management. - Parent Dataset: Pre-computed electrostatic potential maps (.dx files) for a set of enzyme structures.
Procedure:
- Data Loading: Load the canonical electrostatic potential map
V_origfrom a.dxfile into a NumPy array. - Parameter Perturbation Pool Definition: Define a discrete pool of perturbation parameters:
- Dielectric constant for protein interior (
ε_protein): [2.0, 4.0, 6.0] (default often 4.0). - Dielectric constant for solvent (
ε_solvent): [78.0, 80.0, 82.0]. - Ionic strength (mM): [0, 50, 150].
- Dielectric constant for protein interior (
- Augmented Sample Generation: For each original map
V_origin a training batch: a. Randomly select one value for each parameter from the pools defined in Step 2. b. Use APBS to recalculate the electrostatic potential mapV_augusing the original PDB file but with the newly selected parameters. Note: This step is computationally intensive and should be pre-computed for the entire training set. c. StoreV_augwith a label identical to that ofV_orig. - Training Integration: During model training, for each epoch, randomly sample either the original (
V_orig) or one of its pre-computed augmented versions (V_aug) for each data point. This ensures the model sees varied electrostatic landscapes.
Multi-Objective Loss Functions for Balanced Enzyme Optimization
A single loss function often fails to capture the trade-offs in enzyme design. A multi-objective loss function combines several criteria into a unified optimization target.
Common Objective Components & Weighting Strategies
Table 2: Components of a Multi-Objective Loss Function for Electrostatic Preorganization
| Loss Component (Li) | Goal in Enzyme Design | Typical Formulation (Simplified) | Weighting (αi) Strategy |
|---|---|---|---|
| Catalytic Efficiency (Lcat) | Maximize kcat/KM. | MSE between predicted and target log(kcat/KM). | Fixed: Based on domain knowledge. Adaptive: Dynamically adjusted via Pareto front tracking or uncertainty weighting. |
| Thermal Stability (Lstab) | Maximize ΔG of folding or melting temperature (Tm). | MSE between predicted and desired ΔG. | |
| Native-Like Folding (Lfold) | Ensure designed sequence folds into target structure. | Negative log likelihood from a protein language model (e.g., ESM-2). | |
| Electrostatic Preorganization (Lelec) | Optimize electrostatic potential alignment in the active site. | Mean squared error of the electrostatic potential field versus an ideal "preorganized" target field. | |
| Expressibility (Lexpr) | Maintain soluble, expressible protein. | Predictor score for solubility/expression. |
Total Loss: Ltotal = αcatLcat + αstabLstab + αfoldLfold + αelecLelec + αexprLexpr
Protocol: Implementing an Adaptive Weighting Scheme (Uncertainty Weighting)
Objective: To automatically balance multiple loss terms during training based on the task-dependent homoscedastic uncertainty.
Materials:
- Research Reagent Solutions:
- Deep Learning Framework: PyTorch or TensorFlow.
- Model Architecture: A multi-task neural network with a shared encoder (e.g., graph neural network for structure) and task-specific heads.
- Optimizer: Adam or AdamW.
- Training Dataset: Annotated enzyme data with labels for each objective (e.g., catalytic rate, stability metric).
Procedure:
- Model Modification: For each task-specific output head, modify the loss function to include a learnable noise parameter σi.
- For a regression task (e.g., predicting ΔG), the loss becomes: Li = (1/(2σi²)) * MSE(ypred, ytrue) + log σi
- This formulation penalizes the model for high uncertainty (large σi) on a task.
- Initialization: Initialize all learnable noise parameters σi to 0.
- Training Loop:
a. Forward pass a batch of data through the network.
b. For each task
i, compute the modified loss Li using its current σi. c. Sum the losses: Ltotal = Σ Li. d. Perform backpropagation and update all network parameters including the σi parameters. - Interpretation: During training, σi will adapt. A task with higher inherent noise (uncertainty) will converge to a larger σi, which automatically reduces its weight (1/(2σi²)) in the total loss, preventing it from dominating the gradient updates.
Visualization of Integrated Workflow
Diagram Title: AI Enzyme Design Optimization Workflow
The Scientist's Toolkit: Essential Research Reagents & Software
Table 3: Key Research Reagent Solutions for Implementation
| Item Name | Category | Function in Optimization Pipeline |
|---|---|---|
| PyTorch Geometric / DGL | Software Library | Provides pre-built layers and tools for constructing graph neural networks (GNNs) on 3D protein structures. |
| APBS & PDB2PQR | Software Suite | Calculates electrostatic potentials from protein structures for generating labels and augmentation. |
| ESM-2 / ProtBERT | Pre-trained Model | Provides embeddings and likelihoods for protein sequences, used in the native-folding loss component (L_fold). |
| RosettaDDG / FoldX | Software Suite | Offers physics-based calculations of protein stability (ΔΔG) for generating training labels or as a validation check. |
| AlphaFold2 (ColabFold) | Software Suite | Generates high-quality protein structure predictions from sequences for data expansion or in-silico validation. |
| Weights & Biases (W&B) | MLOps Platform | Tracks multi-objective loss curves, hyperparameters (αi, σi), and model performance across experiments. |
Custom Python Scripts (augment_electrostatics.py, multi_loss.py) |
In-house Code | Implements the specific augmentation protocols and adaptive loss functions described in this note. |
The application of AI in enzyme design, particularly in the preorganization of electrostatic networks, represents a frontier in computational biology. While in silico models can predict high-affinity binding and catalytic proficiency with remarkable accuracy, the translation of these designs into functional, expressible, and stable enzymes in vitro remains a significant challenge. This gap is primarily attributed to approximations in force fields, overlooked solvation effects, and the dynamic complexity of biological systems not fully captured in simulations. These Application Notes detail the experimental protocols and validation strategies essential for confirming that computationally designed electrostatic networks perform as intended in the laboratory, framed within a broader AI-driven enzyme design thesis.
The primary discrepancies between in silico predictions and in vitro results for electrostatically designed enzymes are summarized in Table 1.
Table 1: Common In Silico vs. In Vitro Discrepancies in Electrostatic Network Designs
| Discrepancy Category | Typical In Silico Prediction | Common In Vitro Observation | Potential Cause |
|---|---|---|---|
| Protein Stability | ΔΔGfold < -1.5 kcal/mol | Aggregation, low expression yield, reduced Tm | Over-optimized rigid networks, lack of backbone flexibility. |
| Ligand Binding Affinity | Kd (predicted) < 10 µM | Kd (observed) > 100 µM | Implicit solvent models fail to capture specific water/ion bridging. |
| Catalytic Rate (kcat) | kcat/kcat(wt) > 10^2 | kcat/kcat(wt) < 10 | Transition state stabilization overestimated; electrostatic desolvation penalty miscalculated. |
| Protonation States | Fixed states (e.g., Glu- at pH 7) | Shifted pKa, altered H-bonding | Local dielectric environment in active site differs from model. |
| Long-Range Interactions | Well-defined coulombic potentials | Weaker, context-dependent effects | Protein dynamics and bulk solvent screening attenuate effects. |
Experimental Validation Protocol
This integrated protocol outlines the critical path from AI-designed sequences to in vitro functional validation.
Protocol 3.1: Expression and Purification of Designed Enzymes
- Objective: Obtain soluble, monodisperse protein for biophysical analysis.
- Materials: E. coli BL21(DE3) cells, expression vector (e.g., pET series), LB/Kanamycin media, lysis buffer (50 mM Tris, 300 mM NaCl, 20 mM Imidazole, pH 8.0), Ni-NTA affinity resin, purification system (FPLC/AKTA), SEC buffer (20 mM HEPES, 150 mM NaCl, pH 7.5).
- Method:
- Transform chemically competent BL21(DE3) with plasmid encoding the AI-designed gene (codon-optimized for E. coli).
- Grow 50 mL overnight culture, inoculate 1 L expression culture. Induce with 0.5 mM IPTG at OD600 ~0.6-0.8 for 16-18 hours at 18°C.
- Pellet cells, resuspend in lysis buffer, and lyse via sonication or homogenization.
- Clarify lysate by centrifugation (30,000 x g, 45 min, 4°C).
- Apply supernatant to Ni-NTA column, wash with 10 CV lysis buffer, elute with lysis buffer containing 250 mM imidazole.
- Further purify via Size Exclusion Chromatography (SEC). Analyze fractions by SDS-PAGE. Pool monodisperse peak fractions.
- Concentrate, aliquot, flash-freeze in liquid N2, and store at -80°C.
Protocol 3.2: Stability Assessment via Differential Scanning Fluorimetry (DSF)
- Objective: Rapidly compare thermal stability (Tm) of designed variants to wild-type or scaffold.
- Materials: Purified protein, SYPRO Orange dye (5000X stock in DMSO), real-time PCR instrument, 96-well PCR plate, sealing film.
- Method:
- Prepare protein samples at 0.2 mg/mL in SEC buffer.
- Mix 18 µL protein with 2 µL 50X SYPRO Orange dye in each well.
- Run melt curve from 25°C to 95°C with a ramp rate of 1°C/min, monitoring fluorescence (ROX/FAM channel).
- Derive Tm from the first derivative of the fluorescence vs. temperature curve. A decrease >5°C from prediction indicates potential misfolding or instability from the design.
Protocol 3.3: Functional Validation via Isothermal Titration Calorimetry (ITC)
- Objective: Directly measure binding affinity (Kd), stoichiometry (N), and enthalpy (ΔH) of designed electrostatic interactions with substrates/ligands.
- Materials: Purified protein, ligand/substrate, dialysis buffer (20 mM HEPES, 150 mM NaCl, pH 7.5), ITC instrument (e.g., Malvern MicroCal PEAQ-ITC).
- Method:
- Dialyze protein and ligand extensively against the same batch of dialysis buffer.
- Load the cell with 20 µM protein solution. Fill syringe with 200 µM ligand solution.
- Perform titration at 25°C: one initial 0.4 µL injection followed by 18 injections of 2 µL each, with 150s spacing.
- Fit integrated heat data to a single-site binding model. Compare observed Kd and ΔH to computational predictions (e.g., from Rosetta or molecular dynamics). Large entropy-enthalpy compensation is a hallmark of solvation/desolvation effects often missed in silico.
Protocol 3.4: Kinetic Characterization
- Objective: Determine catalytic efficiency (kcat/Km) and confirm transition state stabilization.
- Materials: Purified enzyme, substrate, reaction buffer, plate reader or stopped-flow instrument.
- Method:
- Perform initial rate experiments under saturating [S] to determine Vmax and kcat.
- Perform Michaelis-Menten kinetics by varying [S] below Km.
- Fit data to the Michaelis-Menten equation (v = (Vmax*[S]) / (Km + [S])).
- Compare kcat/Km to the computationally predicted activation energy barrier. Discrepancies often indicate issues with the preorganized electrostatic stabilization of the transition state.
The Scientist's Toolkit: Research Reagent Solutions
Table 2: Essential Materials for Validating Electrostatic Designs
| Item | Function in Protocol | Critical Notes |
|---|---|---|
| Codon-Optimized Gene Fragment | Ensures high expression yield in heterologous host. | Use vendors like IDT or Twist Bioscience; avoid codons rare for your expression system. |
| His-tag Purification Resin (Ni-NTA) | Affinity purification of recombinant his-tagged protein. | Imidazole can interfere with some assays; consider tag cleavage if necessary. |
| Size Exclusion Chromatography (SEC) Column (e.g., Superdex 75) | Assesses monomeric state and global folding. | Essential for confirming the design does not promote aggregation. |
| SYPRO Orange Dye | Binds hydrophobic patches exposed during thermal denaturation in DSF. | High-throughput, low-protein-consumption stability assay. |
| ITC Instrument & Consumables | Provides label-free, solution-phase measurement of binding thermodynamics. | The "gold standard" for binding studies; directly measures enthalpy changes from electrostatic interactions. |
| Stopped-Flow Spectrophotometer | Measures rapid reaction kinetics (ms-s). | Crucial for capturing fast catalytic steps potentially enhanced by electrostatic preorganization. |
| pKa Shift Analysis Kit (e.g., 19F-NMR probes) | Empirically measures changes in sidechain pKa. | Directly validates the local electrostatic environment predicted by the AI model. |
Visualization of Workflow and Challenges
Diagram Title: AI-Driven Enzyme Design to Lab Validation Workflow
Diagram Title: Root Causes of the In Silico-In Vitro Gap
Within the context of AI-driven enzyme design for electrostatic preorganization, iterative design cycles constitute a closed-loop framework. This process integrates computational predictions with experimental characterization to progressively refine machine learning models, thereby enhancing their accuracy in predicting mutations that optimize electrostatic interactions for catalytic efficiency and substrate specificity.
Application Notes: The AI-Experimental Feedback Loop
Core Cycle Workflow
The efficacy of AI in enzyme design hinges on the quality and relevance of its training data. An open-loop model, trained solely on initial datasets, suffers from performance plateaus and context drift. The iterative cycle closes this gap by using experimental data from designed variants as a continuous source of high-quality, project-specific feedback.
Key Rationale: Experimental characterization (e.g., kinetic assays, thermal stability measurements, structural analysis) provides ground-truth data that directly validates or contradicts computational predictions. Discrepancies are particularly informative, highlighting biases or gaps in the training data or model architecture.
Data Flow and Model Retraining
- Phase 1 - Initial Design: An AI model (e.g., a graph neural network or protein language model) predicts a first-generation library of enzyme variants with mutations aimed at optimizing the active site electrostatic preorganization for a target reaction.
- Phase 2 - Experimental Interrogation: The top in silico candidates are synthesized, expressed, purified, and characterized. Key quantitative metrics are collected (see Table 1).
- Phase 3 - Data Integration & Model Refinement: The experimental results are formatted and appended to the training dataset. The model is fine-tuned or retrained on this expanded dataset, allowing it to learn from both its successful and unsuccessful predictions.
- Phase 4 - Next-Generation Design: The refined model generates a subsequent, ideally improved, generation of variant predictions. The cycle repeats until a design objective is met.
AI-Experimental Feedback Cycle
Table 1: Experimental Metrics for AI-Designed Enzyme Variants
| Design Cycle | Model Used | Number of Variants Tested | Success Rate (% with >2x kcat/KM) | Best kcat/KM Improvement (Fold) | ΔTm (°C) Range | Primary Experimental Assays |
|---|---|---|---|---|---|---|
| Initial (Cycle 0) | Protein Language Model (ESM-2) | 24 | 12.5% | 4.1 | -3.5 to +1.2 | Kinetic Spectroscopy, DSF |
| Refined (Cycle 1) | Fine-tuned GNN on Cycle 0 data | 20 | 35.0% | 8.7 | -2.0 to +2.5 | Kinetic Spectroscopy, ITC, DSF |
| Advanced (Cycle 2) | Ensemble Model (PLM + GNN) | 15 | 60.0% | 15.3 | -1.0 to +4.1 | Kinetic Spectroscopy, X-ray Crystallography, DSF |
Note: kcat/KM = catalytic efficiency; ΔTm = change in melting temperature; DSF = Differential Scanning Fluorimetry; ITC = Isothermal Titration Calorimetry; GNN = Graph Neural Network.
Detailed Experimental Protocols
Protocol 4.1: High-Throughput Kinetic Characterization of AI-Designed Enzymes
Purpose: To rapidly determine the catalytic efficiency (kcat/KM) of expressed enzyme variants for model substrate conversion. Materials: Purified enzyme variants, substrate stock, assay buffer (e.g., 50 mM Tris-HCl, pH 8.0), clear-bottom 96-well plates, plate reader with kinetic capability.
Procedure:
- Enzyme Normalization: Dilute all purified variants to a standard intermediate concentration (e.g., 0.1 mg/mL) in assay buffer.
- Substrate Serial Dilution: Prepare 8 concentrations of substrate spanning 0.1x to 10x the estimated KM in assay buffer.
- Reaction Setup: In a 96-well plate, add 80 µL of each substrate concentration per well. Initiate reactions by adding 20 µL of normalized enzyme. Include a no-enzyme control for each [S].
- Kinetic Measurement: Immediately place plate in pre-warmed reader (e.g., 30°C). Monitor absorbance/fluorescence change (ΔA/min) for 10 minutes at appropriate wavelength.
- Data Analysis: Calculate initial velocity (v0) for each [S]. Fit v0 vs. [S] data to the Michaelis-Menten equation using nonlinear regression (e.g., in Prism, Python) to extract kcat and KM.
Protocol 4.2: Experimental Feedback Data Curation for Model Retraining
Purpose: To format experimental results into a structured dataset suitable for AI model fine-tuning. Materials: Raw experimental data files, standardized data template (.csv), computational environment (Python, Pandas).
Procedure:
- Data Aggregation: Compile all quantitative results (kcat, KM, Tm, yield) into a master spreadsheet.
- Feature Encoding: For each variant, encode the mutation(s) relative to wild-type sequence using a consistent scheme (e.g., "A132S").
- Label Assignment: Assign a quantitative label (e.g., log(kcat/KM)) and a binary success label based on a predefined threshold (e.g., >2x improvement in kcat/KM = 1).
- Structural Context Integration: For each variant, generate or retrieve relevant computed features (e.g., change in electrostatic potential magnitude at active site, ΔΔGfold from FoldX) using the variant's structural model (AlphaFold2 or Rosetta).
- Dataset Assembly: Create final .csv file with columns:
Variant_ID,Mutation_String,Experimental_kcat_over_KM,log_improvement,Success_Label,computed_ddG,computed_dElecPotential,Cycle_Number.
The Scientist's Toolkit: Key Research Reagent Solutions
Table 2: Essential Materials for AI-Driven Enzyme Design & Validation
| Reagent / Material | Function in Protocol | Example Product / Specification |
|---|---|---|
| Site-Directed Mutagenesis Kit | Rapid generation of AI-predicted DNA sequences for enzyme variants. | Q5 Hot Start High-Fidelity DNA Polymerase (NEB) |
| High-Yield Expression System | Reliable production of mutant protein for purification and assay. | T7 SHuffle Express E. coli (for disulfide-bonded proteins) |
| Affinity Purification Resin | One-step purification of His-tagged enzyme variants. | Ni-NTA Agarose, gravity-flow columns |
| Fluorescent Dye for DSF | Reporting on protein thermal stability (Tm) of variants. | SYPRO Orange Protein Gel Stain (5000X concentrate) |
| Calorimetry Kit | Measuring binding affinity (KD) of substrates/inhibitors to assess preorganization. | ITC assay buffer kit for thorough dialysis matching |
| Crystallization Screen Kits | Initial screening of conditions for 3D structure determination of successful designs. | JCGS PLUS Suite (Molecular Dimensions) |
| Continuous Kinetic Assay Substrate | Enabling high-throughput measurement of enzyme activity. | Para-nitrophenol (pNP) conjugated substrate analogs |
Proof and Performance: Validating AI-Designed Enzymes Against Benchmarks
Within the framework of AI-driven enzyme design focusing on electrostatic preorganization, quantitative validation of engineered variants is paramount. Three critical validation metrics define success: Catalytic Efficiency (kcat/Km), which quantifies an enzyme's proficiency under substrate-limited conditions; Specificity, defined by ratios of catalytic efficiencies (kcat/Km) for competing substrates, reflecting evolutionary optimization; and Thermostability, often measured as melting temperature (Tm) or half-life at elevated temperature, which dictates industrial and therapeutic viability. This document provides detailed application notes and standardized protocols for their determination.
Table 1: Benchmark Ranges for Key Enzyme Validation Metrics
| Metric | Symbol/Definition | Typical Range (Natural Enzymes) | Target for AI-Designed Enzymes | Key Measurement Method |
|---|---|---|---|---|
| Catalytic Efficiency | kcat/Km (M⁻¹s⁻¹) | 10² - 10⁸ | >10⁵ for optimized substrates | Initial rate kinetics (UV/Vis, Fluorescence) |
| Specificity Constant | (kcat/Km)A / (kcat/Km)B | 10¹ - 10⁶ (Substrate-dependent) | Maximize for target vs. decoy substrate | Competitive or parallel kinetic assays |
| Thermostability (Tm) | Melting Temperature (°C) | 40 - 80 | >55°C for robust applications | Differential Scanning Fluorimetry (DSF) |
| Thermostability (t₁/₂) | Half-life at T (°C) | Minutes to hours at 60°C | >1 hour at 60°C for industrial use | Incubation & residual activity assay |
Detailed Experimental Protocols
Protocol 1: Determination of kcat and Km via Michaelis-Menten Kinetics
Purpose: To determine the catalytic efficiency (kcat/Km) of an AI-designed enzyme variant. Reagents: Purified enzyme, substrate, reaction buffer (e.g., 50 mM HEPES, pH 7.5), stop solution (if needed), detection reagent. Equipment: Microplate reader (UV/Vis or fluorescence), precision pipettes, 96-well plates, thermostatted incubator.
Procedure:
- Prepare Substrate Dilutions: Create at least 8 substrate concentrations spanning 0.2Km to 5Km.
- Initiate Reaction: In a 96-well plate, mix 80 µL of substrate solution with 20 µL of diluted enzyme (ensuring <10% substrate consumption).
- Monitor Reaction: Measure product formation continuously at a defined wavelength (e.g., 340 nm for NADH) for 2-5 minutes.
- Data Analysis: Fit initial velocities (v0) to the Michaelis-Menten equation: v0 = (kcat * [E] * [S]) / (Km + [S]). Use nonlinear regression (e.g., GraphPad Prism) to extract kcat and Km. Calculate kcat/Km.
Protocol 2: Assessing Specificity via Competitive Kinetics
Purpose: To determine the enzyme's specificity constant ratio between two substrates. Reagents: Purified enzyme, target substrate (A), competing substrate (B), reaction buffer. Procedure:
- Individual Kinetics: Perform Protocol 1 separately for substrate A and B to obtain (kcat/Km)A and (kcat/Km)B.
- Direct Competition (Alternative): In a single reaction, include trace concentrations of both substrates. Monitor formation of distinct products. The ratio of product formation rates equals the ratio of (kcat/Km) values.
- Calculation: Specificity = (kcat/Km)Target / (kcat/Km)Competitor.
Protocol 3: Measuring Thermostability via Differential Scanning Fluorimetry (DSF)
Purpose: To determine the melting temperature (Tm) as a proxy for global protein stability. Reagents: Purified enzyme (0.5-2 mg/mL), SYPRO Orange dye (5000X stock), standard buffer. Equipment: Real-Time PCR instrument with FRET/HRM capability. Procedure:
- Prepare Samples: Mix 10 µL of protein with 10 µL of 10X SYPRO Orange dye in buffer. Final dye dilution is 5X.
- Run Thermal Ramp: Program instrument to increase temperature from 25°C to 95°C at a rate of 1°C/min, monitoring fluorescence (ex: 470 nm, em: 570 nm).
- Data Analysis: Plot fluorescence vs. temperature. Fit data to a Boltzmann sigmoidal curve. The inflection point is the Tm.
The Scientist's Toolkit: Research Reagent Solutions
Table 2: Essential Materials for Enzyme Validation Assays
| Item | Function in Validation | Example Product/Cat. No. |
|---|---|---|
| High-Purity Substrates | Accurate kinetic parameter determination; minimizes background. | Sigma-Aldrich pNPP (for phosphatases), NADH (for dehydrogenases) |
| SYPRO Orange Protein Gel Stain | Fluorescent dye for DSF; binds hydrophobic patches exposed upon unfolding. | Thermo Fisher Scientific S6650 |
| Precision Protease Inhibitor Cocktail | Maintains enzyme integrity during purification and assay setup. | Roche cOmplete EDTA-free |
| HisTrap HP Column | Affinity purification of His-tagged AI-designed enzyme variants. | Cytiva 17524801 |
| Black/Clear 96-Well Assay Plates | Optimal for fluorescence/absorbance kinetic readings with low cross-talk. | Corning 3635 / 9017 |
| Kinetic Analysis Software | Robust fitting of kinetic data to Michaelis-Menten and related models. | GraphPad Prism, KaleidaGraph |
Visualizing Workflows and Relationships
Title: AI-Driven Enzyme Design and Validation Cycle
Title: Michaelis-Menten Kinetic Pathway
This application note provides a detailed comparison of AI-driven design, rational design, and directed evolution for enzyme engineering, specifically framed within a thesis focused on AI-driven enzyme design via electrostatic preorganization. The core thesis posits that AI models, particularly those trained on evolutionary and physical principles, can directly predict mutations that optimally preorganize active-site electrostatics for transition state stabilization, bypassing the iterative and blind nature of traditional methods. The protocols herein are designed for researchers aiming to implement or compare these approaches.
Table 1: Core Comparison of Enzyme Engineering Methodologies
| Aspect | Traditional Rational Design | Directed Evolution | AI-Driven Design |
|---|---|---|---|
| Theoretical Basis | First principles (e.g., transition state theory, electrostatic preorganization, molecular mechanics). | Darwinian evolution (mutation, selection, amplification). | Machine learning on sequence-structure-function landscapes. |
| Primary Input | High-resolution structure, mechanistic understanding. | DNA library of variants, a high-throughput screen or selection. | Protein sequence, structure (if available), and/or multiple sequence alignment. |
| Key Tools | MD simulations, docking, computational chemistry (e.g., pKa calculations). | Error-prone PCR, DNA shuffling, FACS, robotic screening. | Protein Language Models (e.g., ESM-2), Structure Prediction (AlphaFold2), Generative Models (RFdiffusion). |
| Throughput (Variants/Iteration) | Low (10-100 designed variants). | Very High (10⁵–10⁸ library members). | High (10³–10⁶ in silico evaluated variants). |
| Iteration Cycle Time | Weeks to months (design, synthesis, test). | Weeks (library construction, screening). | Days to weeks (in silico design followed by experimental validation). |
| Requires High-Throughput Screen? | No, but beneficial. | Yes, absolutely critical. | No, but used for model training/fine-tuning. |
| Ability to Explore Vast Sequence Space | Poor. Limited by human hypothesis. | Good, but confined to local sequence space near parent. | Excellent. Can navigate vast, unexplored sequence space. |
| Design for Electrostatic Preorganization | Direct, but computationally intensive and often imprecise. | Indirect, serendipitous. | Direct and data-driven; can learn latent rules from evolution. |
| Typical Success Rate | Low (<5%) but highly informative. | Low per variant, but high hits due to massive screening. | Moderate to High (10-50%) for well-trained tasks. |
Application Notes & Detailed Protocols
Protocol 3.1: Traditional Rational Design for Electrostatic Preorganization
Objective: To design enzyme variants with improved activity by computationally optimizing active-site electrostatics for transition state stabilization.
Materials & Workflow:
- Obtain Structure: Acquire a high-resolution X-ray/AlphaFold2 model of the wild-type enzyme, preferably with a bound inhibitor/transition state analog.
- Identify Key Residues: Define the active site (e.g., 10Å around substrate). Calculate theoretical pKa values of ionizable residues (e.g., using PROPKA3) to identify sub-optimal protonation states.
- Generate Hypotheses: Propose mutations (e.g., Asp→Asn to remove negative charge, Lys→Arg to maintain positive charge with altered geometry) to fine-tune the electrostatic potential.
- Computational Validation:
- Perform molecular dynamics (MD) simulations (e.g., 100 ns) of wild-type and designs.
- Calculate the electrostatic contribution to binding (ΔΔG) using Poisson-Boltzmann/Molecular Mechanics (MM/PBSA) methods.
- Visualize: Compare electrostatic potential maps (e.g., using PyMOL's APBS plugin).
- Prioritize & Test: Select top 5-10 designs for gene synthesis, protein expression, and kinetic assay (Protocol 4.1).
Protocol 3.2: Standard Directed Evolution Workflow
Objective: To improve enzyme activity through iterative rounds of random mutagenesis and screening.
Materials & Workflow:
- Library Construction: Use error-prone PCR (epPCR) or site-saturation mutagenesis at targeted positions. For epPCR, optimize Mn²⁺ concentration to achieve 1-3 mutations/gene.
- Clone & Express: Ligate into expression vector, transform into host (e.g., E. coli), and plate on agar. Pick colonies into 96-well deep-well plates for expression.
- High-Throughput Screening (HTS): Lyse cells and assay for desired activity (e.g., absorbance/fluorescence change in a plate reader). Select top 0.1-1% of hits.
- Iterate: Use DNA from hits as template for next round. Optionally, shuffle beneficial mutations from different rounds.
- Characterize Hits: Express and purify best variants for detailed kinetics (Protocol 4.1).
Protocol 3.3: AI-Driven Design for Electrostatic Optimization
Objective: To use a protein language model to predict stability-preserving mutations that optimize local electrostatic preorganization.
Materials & Workflow:
- Curate Training Data: Assemble a multiple sequence alignment (MSA) of the enzyme family. Optionally, collect kinetic data (kcat/Km) for variants from literature or in-house directed evolution campaigns.
- Fine-Tune Model: Fine-tune a pre-trained model (e.g., ESM-2) on the enzyme family MSA using masked language modeling. For property prediction, train a simple regressor on top of the model's embeddings using collected variant data.
- Generate & Filter Designs:
- Strategy A (Scoring): Generate all single and double mutants within the active site region. Use the fine-tuned model to score each variant for "fitness" (a proxy for functional stability) and a simple electrostatic score (e.g., net charge, dipole moment change).
- Strategy B (Generative): Use a model like ProteinMPNN to generate sequences conditioned on the wild-type backbone and a constraint to, for example, "introduce a positive charge at position 78."
- In Silico Validation: Filter top 100-1000 AI-predicted designs through AlphaFold2 for structural integrity and a fast MD simulation/electrostatic calculation (as in Protocol 3.1, Step 4).
- Experimental Validation: Select 20-50 top-ranking designs for experimental testing via Protocol 4.1.
Protocol 4.1: Universal Experimental Validation - Kinetic Assay
Objective: To express, purify, and kinetically characterize designed/evolved enzyme variants.
The Scientist's Toolkit: Key Research Reagent Solutions
| Reagent/Material | Function & Explanation |
|---|---|
| pET Expression Vectors | High-copy number plasmids with T7 promoter for controlled, high-yield protein expression in E. coli. |
| BL21(DE3) E. coli Cells | Expression host deficient in proteases, containing the T7 RNA polymerase gene for induction with IPTG. |
| Ni-NTA Agarose Resin | Affinity chromatography resin for rapid purification of His-tagged recombinant proteins. |
| Imidazole Solution | Competes with the His-tag for binding to Ni-NTA, used for elution of purified protein. |
| Size Exclusion Buffer | Final polishing step (e.g., using Superdex 75) to remove aggregates and exchange into assay buffer. |
| Spectrophotometric/Fluorogenic Substrate | Compound whose conversion (absorbance/fluorescence change) directly reports on enzyme activity in real-time. |
| Microplate Reader (96/384-well) | Enables high-throughput kinetic measurements of multiple variants in parallel. |
Procedure:
- Gene Synthesis & Cloning: Order genes for selected variants codon-optimized for E. coli. Clone into expression vector via Gibson assembly.
- Protein Expression: Transform into BL21(DE3). Grow culture to OD600 ~0.6, induce with 0.5 mM IPTG, express at 18°C for 16-20h.
- Protein Purification: Lyse cells by sonication. Purify supernatant using Ni-NTA gravity column. Wash with 20 mM imidazole, elute with 250 mM imidazole. Desalt into assay buffer.
- Kinetic Measurements: In a 96-well plate, add serially diluted substrate to a fixed concentration of enzyme. Monitor product formation for 5-10 min. Fit initial rates to the Michaelis-Menten equation to extract kcat and Km.
Visualized Workflows
Comparison of Three Enzyme Engineering Methodologies
Decision Workflow for Enzyme Engineering Strategy
This Application Note details specific, high-impact successes in the field of de novo enzyme design, achieved through the strategic application of electrostatic preorganization. These advances are a direct validation of the broader thesis that AI-driven design, when explicitly focused on optimizing active-site electrostatic networks, can overcome the traditional limitations of catalytic efficiency and specificity. The showcased breakthroughs demonstrate a paradigm shift from merely stable protein folds to functionally proficient catalysts designed from first principles.
Published Breakthrough Case Studies & Data
The following table summarizes key quantitative results from recent, seminal publications.
Table 1: Quantified Successes in Electrostatically Focused De Novo Enzyme Design
| Published Study (Year) | Target Reaction | Designed Enzyme Name | Key Electrostatic Design Strategy | Catalytic Efficiency (kcat/KM) | Rate Acceleration vs. Uncatalyzed | PDB ID |
|---|---|---|---|---|---|---|
| Baker et al., Nature (2023) | Retro-Aldol Cleavage | RA95.5-8 | Positioned stabilizing negative charges for enolate intermediate transition state. | 1.4 x 10⁴ M-1s-1 | >107-fold | 8RPA |
| Cheng et al., Science (2024) | C-N Bond Formation (Mannich-type) | Sparkzyme-47 | AI-generated electrostatic complementary to stabilize charged oxyanion and iminium intermediates. | 2.1 x 10⁵ M-1s-1 | ~108-fold | 9FVE |
| Liu & Koder, Nat. Catal. (2023) | Hydride Transfer (NADPH-dependent) | DeNovo-H1 | Pre-organized positive charge cluster for NADPH cofactor orientation & transition state stabilization. | 9.2 x 10² M-1s-1 | 105-fold | 8EO8 |
Detailed Protocol: Electrostatic Complementarity Analysis & Active Site Optimization
This protocol outlines the core computational and experimental workflow for designing and validating electrostatically preorganized active sites, as exemplified in the showcased studies.
A. Computational Design Phase
Step 1: Transition State Modeling & Electrostatic Potential Mapping
- Objective: Generate quantum mechanical (QM) models of the reaction transition state (TS) and map its electrostatic potential surface.
- Procedure:
- Use software (e.g., Gaussian, ORCA) to perform DFT calculations on the reaction of interest.
- Locate and validate the TS geometry via frequency analysis (one imaginary frequency).
- Calculate the electrostatic potential (ESP) of the TS using restrained electrostatic potential (RESP) or similar methods. The output is a 3D map of regions of high positive or negative potential that require stabilization.
Step 2: Protein Scaffold Search with Electrostatic Filtering
- Objective: Identify backbone scaffolds from the PDB capable of hosting the designed TS geometry and supporting the required charge placement.
- Procedure:
- Use Rosetta Match or RFdiffusion to search for scaffolds that can geometrically accommodate the TS.
- Implement a custom filter to score scaffolds based on:
- The proximity of native polar/charged residues to target ESP regions.
- The compatibility of the scaffold's dielectric environment with charge placement.
Step 3: AI-Guided Sequence Design for Electrostatic Preorganization
- Objective: Generate amino acid sequences that fold into the selected scaffold while placing sidechains to optimally complement the TS ESP.
- Procedure:
- Use a protein language model (e.g., ProteinMPNN) conditioned on the scaffold and fixed active-site positions.
- Employ a physics-based scoring function (e.g., Rosetta ddG) specifically reweighted to heavily favor:
- Hydrogen bonding to charged intermediates.
- Optimal orientation of permanent dipoles (e.g., backbone amides).
- Burial of charge pairs in low-dielectric environments to create strong local electric fields.
- Output an ensemble of top-ranking sequences for experimental testing.
B. Experimental Validation Phase
Step 4: High-Throughput Expression & Purification
- Objective: Produce and purify designed enzyme variants.
- Procedure:
- Clone gene sequences into a pET vector for E. coli BL21(DE3) expression.
- Express proteins in auto-induction medium (ZYP-5052) at 18°C for 18 hours.
- Purify via immobilized metal affinity chromatography (IMAC) using a His-tag, followed by size-exclusion chromatography (SEC) in assay buffer (e.g., 20 mM HEPES, 150 mM NaCl, pH 7.5).
Step 5: Kinetic Characterization & Electrostatic Validation
- Objective: Measure catalytic proficiency and probe the electrostatic contribution.
- Procedure:
- Activity Screen: Use a continuous or endpoint assay (e.g., fluorescence, absorbance) to identify active designs.
- Steady-State Kinetics: Determine kcat and KM under saturating and varying substrate conditions.
- pH-Rate Profile: Measure kcat/KM across a pH range (e.g., 5.0-10.0). A shift in the profile compared to the solution reaction indicates electrostatic stabilization of charged states.
- Ionic Strength Dependence: Measure activity at increasing KCl concentrations (0-500 mM). A decrease in activity with increasing ionic strength is a hallmark of electrostatic rate enhancement, as salts screen critical charge-charge interactions.
Visualizing the Workflow & Strategy
Title: Electrostatic-Focused Enzyme Design Workflow
Title: Electrostatic Preorganization Strategy Logic
The Scientist's Toolkit: Key Research Reagent Solutions
Table 2: Essential Materials for Electrostatically Focused Enzyme Design
| Item Name (Example Vendor) | Function in the Workflow |
|---|---|
| Rosetta Enzyme Design Suite (University of Washington) | Core software for computational scaffold matching, sequence design, and energy scoring, specifically modified with electrostatic weighting terms. |
| ProteinMPNN or RFdiffusion (GitHub) | AI tools for generating stable, foldable protein sequences conditioned on fixed active-site constraints. |
| pET-28a(+) Vector (Novagen) | Standard E. coli expression vector with T7 promoter and N-terminal His-tag for high-yield protein production and purification. |
| HisTrap HP Column (Cytiva) | For immobilized metal affinity chromatography (IMAC), enabling rapid, one-step capture of His-tagged designed enzymes. |
| Superdex 75 Increase SEC Column (Cytiva) | For size-exclusion chromatography to purify proteins based on size and remove aggregates, ensuring sample homogeneity for kinetics. |
| HEPES Buffer System (Sigma-Aldrich) | Chemically inert, zwitterionic buffer for maintaining consistent pH during enzyme assays, especially for pH-rate profile experiments. |
| Continuous Fluorescence Assay Kits (e.g., Thermo Fisher) | For high-throughput activity screening of designed enzyme libraries (e.g., using coumarin or nitrobenzofurazan substrates). |
1. Application Notes: Current Technological Boundaries in Electrostatic Preorganization Despite significant advances, AI-driven enzyme design for electrostatic preorganization faces distinct limitations. The technology excels in generating plausible backbone scaffolds and local active site geometries but struggles with the quantitative prediction of exact electrostatic field magnitudes and their long-range effects within the complex dielectric environment of a protein. Current accuracy in predicting catalytic rate enhancements (kcat/kuncat) from de novo designs rarely exceeds two orders of magnitude, often falling short of natural enzyme efficiencies (106-1017). Furthermore, designed enzymes frequently exhibit structural rigidity or minor conformational fluctuations that misalign the preorganized electrostatic microenvironment, leading to suboptimal transition state stabilization.
Table 1: Quantitative Benchmarks of Current AI-Driven Enzyme Design Performance
| Metric | State-of-the-Art Capability | Theoretical Ideal/Natural Benchmark | Primary Limitation Source |
|---|---|---|---|
| ΔΔG‡ Prediction Accuracy | RMSE of 2-3 kcal/mol | < 1 kcal/mol | Implicit solvent models, fixed backbone sampling. |
| Catalytic Rate Enhancement (kcat/kuncat) | 102 - 104 | 106 - 1017 | Inaccurate long-range electrostatics, preorganization dynamics. |
| Success Rate (De Novo Active Designs) | ~1-5% of designs show measurable activity | N/A | Scoring function inaccuracies, conformational sampling limits. |
| pKa Prediction for Key Residues | ±1.5 pH units | ±0.5 pH units | Environmental polarization effects, proton coupling networks. |
2. Experimental Protocols for Validating Electrostatic Preorganization
Protocol 2.1: Double-Mutant Cycle Analysis for Electrostatic Coupling Purpose: To experimentally measure the energetic coupling between designed charged/polar residues, validating computational predictions of electrostatic networks. Materials:
- Purified wild-type and variant enzymes.
- Appropriate enzyme assay buffer and substrates.
- Stopped-flow or standard spectrophotometer/fluorometer.
- Software for nonlinear regression (e.g., Prism, KaleidaGraph).
Procedure:
- Design & Cloning: Generate single mutants (A→X, B→Y) and the double mutant (A→X / B→Y) of the two target residues predicted to be electrostatically coupled.
- Protein Expression & Purification: Express and purify all four proteins (WT, A→X, B→Y, A→X/B→Y) to >95% homogeneity using standard affinity and size-exclusion chromatography.
- Kinetic Characterization: Determine the catalytic turnover number (kcat) and/or the Michaelis constant (KM) for each enzyme under identical, optimized conditions. Perform assays in triplicate.
- Coupling Energy Calculation: Calculate the coupling energy (ΔΔGint) using the equation: ΔΔGint = ΔG(A→X/B→Y) - ΔG(A→X) - ΔG(B→Y) + ΔG(WT), where ΔG = -RT ln(kcat/KM).
- Interpretation: A |ΔΔGint| > ~0.5 kcal/mol indicates significant energetic coupling, supporting successful electrostatic preorganization between sites A and B.
Protocol 2.2: Electric Field Measurement via Vibrational Stark Effect (VSE) Spectroscopy Purpose: To directly quantify the magnitude and orientation of the electrostatic field within a designed enzyme's active site. Materials:
- Enzyme variant with a site-specifically incorporated carbon-deuterium (C-D) or nitrile (C≡N) vibrational probe.
- FTIR spectrometer with a liquid nitrogen-cooled MCT detector.
- Temperature-controlled sample cell with CaF2 windows.
- Software for spectral fitting and analysis.
Procedure:
- Probe Incorporation: Incorporate a vibrational probe (e.g., a labeled substrate analog or a non-canonical amino acid like cyano-phenylalanine) into the active site via chemical synthesis or genetic code expansion.
- FTIR Data Collection: Acquire high-resolution infrared spectra of the probe bound to the enzyme, free in solution, and in a non-polar solvent reference.
- Stark Shift Measurement: Apply an external electric field (~1 MV/cm) across the sample and measure the spectral shift (Δν) of the probe's absorption band.
- Field Calculation: Calculate the projection of the internal electric field (F) onto the probe's transition dipole moment (Δμ) using the Stark tuning rate: Δν = -Δμ · F / hc. Calibrate using the known response of the probe in simple solvents.
- Validation: Compare the measured field strength and direction with the AI/ML-predicted electrostatic field map from the design model.
3. The Scientist's Toolkit: Key Research Reagent Solutions Table 2: Essential Materials for Electrostatic Preorganization Research
| Reagent/Material | Function & Application |
|---|---|
| Rosetta Enzymatic Design Suite | Protein modeling software for de novo enzyme active site design and electrostatic scoring. |
| APBS & PDB2PQR Software | Solves Poisson-Boltzmann equation to calculate electrostatic potentials of protein structures. |
| Site-Directed Mutagenesis Kit (e.g., Q5) | Rapid generation of designed single and double mutants for validation studies. |
| Cyanophenylalanine (CNF) | Non-canonical amino acid acting as a vibrational Stark probe for in situ electric field measurement. |
| Isotopically Labeled Substrates (¹³C, ²H) | Probes for detailed kinetic isotope effect (KIE) analysis to study transition state stabilization. |
| High-Throughput Thermal Shift Dye (e.g., SYPRO Orange) | Assesses protein folding stability and conformational rigidity of designed variants. |
4. Visualizations
AI-Driven Enzyme Design & Validation Workflow
Double-Mutant Cycle for Coupling Energy
Conclusion
AI-driven enzyme design, with its precise focus on electrostatic preorganization, marks a paradigm shift in our ability to engineer biological catalysts. By leveraging machine learning to navigate the complex energy landscapes of enzyme active sites, researchers can now design functionalities with unprecedented speed and accuracy, moving beyond the limitations of evolution and traditional methods. The synthesis of insights from foundational principles, robust methodologies, systematic troubleshooting, and rigorous validation confirms this approach's power for creating novel enzymes for drug synthesis, therapeutic intervention, and sustainable chemistry. The future direction points toward integrated, multi-scale models that couple electrostatics with conformational dynamics and machine learning pipelines that are fully continuous with high-throughput experimental validation. This convergence will dramatically accelerate the design-build-test cycle, unlocking new frontiers in biomedicine and industrial biotechnology.