Beyond the Fold: Modern Strategies to Counteract ER Stress and Protein Misfolding in Disease and Bioproduction
This article provides a comprehensive analysis of contemporary approaches for mitigating protein misfolding and endoplasmic reticulum (ER) stress in eukaryotic systems.
Beyond the Fold: Modern Strategies to Counteract ER Stress and Protein Misfolding in Disease and Bioproduction
Abstract
This article provides a comprehensive analysis of contemporary approaches for mitigating protein misfolding and endoplasmic reticulum (ER) stress in eukaryotic systems. Tailored for researchers and drug development professionals, it systematically explores the molecular foundations of the unfolded protein response (UPR), current methodologies for detection and intervention, troubleshooting for experimental and therapeutic strategies, and validation techniques for emerging compounds. The scope spans fundamental cellular mechanisms to translational applications in neurodegenerative diseases, metabolic disorders, and recombinant protein manufacturing, offering a roadmap for both basic research and therapeutic development.
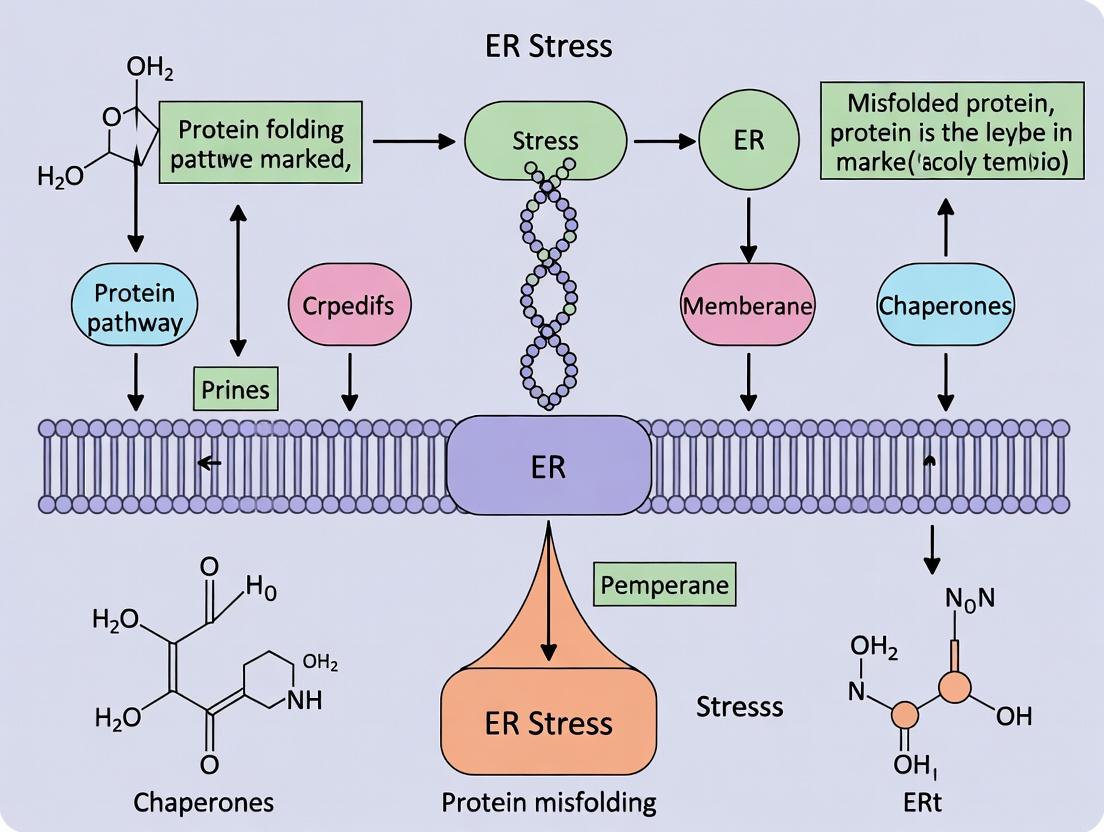
Decoding Cellular Distress: The Molecular Basis of ER Stress and the Unfolded Protein Response
Technical Support Center
Troubleshooting Guide: UPR & Apoptosis Assays
Issue 1: Inconsistent XBP1 Splicing Assay Results
- Problem: Gel electrophoresis shows multiple bands or no clear shift between unspliced (XBP1u) and spliced (XBP1s) variants.
- Diagnosis: Common causes are RNA degradation, inefficient reverse transcription, or suboptimal PCR conditions.
- Solution:
- RNA Integrity: Check RNA integrity on a bioanalyzer. RIN (RNA Integrity Number) should be >8.0.
- RT-PCR Protocol: Use a sensitive RT-PCR kit. The following protocol is optimized for detecting XBP1 splicing:
- Primers (Human): F: 5′-CCTTGTAGTTGAGAACCAGG-3′, R: 5′-GGGGCTTGGTATATATGTGG-3′.
- PCR Cycle: 94°C for 2 min; 35 cycles of (94°C for 30s, 58°C for 30s, 72°C for 45s); 72°C for 5 min.
- Gel: Run product on a 3% agarose gel. XBP1u ~289 bp, XBP1s ~263 bp.
- Positive Control: Treat cells with 2µM Thapsigargin or 5µg/mL Tunicamycin for 6 hours to induce robust ER stress and XBP1 splicing.
Issue 2: Low Signal in ATF6 Luciferase Reporter Assays
- Problem: Weak luminescence signal even under strong ER stress induction.
- Diagnosis: Possible transfection inefficiency, cell toxicity from stress inducers, or reporter plasmid degradation.
- Solution:
- Transfection Control: Co-transfect with a Renilla luciferase plasmid for normalization. Calculate Fold Induction as (Firefly/Renilla stressed) / (Firefly/Renilla unstressed).
- Cell Viability: Perform an MTT assay concurrently to ensure reporter signal loss is not due to apoptosis. See Table 1 for viability correlation.
- Inducer Titration: Titrate ER stress inducers (e.g., Tunicamycin 0.1-10 µg/mL) to find the peak response window before widespread cell death.
Issue 3: High Background in CHOP Immunofluorescence
- Problem: Non-specific staining in unstressed control cells masks CHOP induction.
- Diagnosis: Antibody cross-reactivity or insufficient fixation/permeabilization.
- Solution:
- Fixation Protocol: Fix cells with 4% PFA for 15 min at RT. Permeabilize with 0.1% Triton X-100 in PBS for 10 min. Block with 5% BSA for 1 hour.
- Antibody Validation: Include a CHOP knockout cell line as a negative control. Titrate primary antibody (common anti-CHOP: 1:200 to 1:1000 dilution).
- Stress Induction: Use a strong, acute inducer like 1µM Thapsigargin for 8 hours as a positive control. CHOP should localize to the nucleus.
FAQs: Protein Misfolding & ER Stress Experiments
Q1: What are the top three pharmacological inducers of ER stress for a positive control, and what are their primary mechanisms? A1:
| Inducer | Typical Working Concentration | Primary Mechanism | Key Readout/Note |
|---|---|---|---|
| Tunicamycin | 1 - 5 µg/mL | Inhibits N-linked glycosylation (blocks GlcNAc-1-P transferase) | Strong PERK/ATF6 activation; potent but can be cytotoxic. |
| Thapsigargin | 0.1 - 2 µM | Inhibits SERCA pump, depleting ER calcium stores | Robust IRE1α and PERK activation; fast-acting. |
| DTT | 1 - 5 mM | Reduces disulfide bonds, preventing proper folding | Strong ATF6 activation; effects are reversible upon washout. |
Q2: How do I distinguish between adaptive UPR and terminal ER stress leading to apoptosis? A2: Measure a time course and correlate markers of adaptation vs. apoptosis. Quantitative data from a typical experiment with 2µM Thapsigargin treatment in HEK293 cells is summarized below:
Table 1: Temporal Signaling Events After ER Stress Induction
| Time Post-Induction | Adaptive UPR Markers | Apoptotic Shift Markers | Cell Viability (MTT) |
|---|---|---|---|
| 0 - 4 hours | ↑ p-eIF2α, ↑ XBP1s, ↑ ER chaperones (BiP/GRP94) | Low/Undetectable CHOP, Cleaved Caspase-3 | 95-100% |
| 8 - 12 hours | Sustained ↑ XBP1s, ↑ ATF6f | ↑ CHOP expression, ↓ Bcl-2 | 70-85% |
| 16 - 24 hours | ↓ UPR markers (overwhelmed) | ↑↑ CHOP, ↑ Cleaved PARP, ↑ Cleaved Caspase-3 | 40-60% |
Q3: Which ER stress pathway (IRE1, PERK, ATF6) should I monitor for my research on secretory pathway proteins? A3: It depends on the protein and the nature of the misfolding.
- IRE1/XBP1: Critical for proteins requiring ER chaperones and ER-associated degradation (ERAD) components. Monitor XBP1 splicing and EDEM1 expression.
- PERK/eIF2α/ATF4: Important if misfolding leads to oxidative stress or requires a global translational pause. Monitor p-eIF2α and ATF4 target genes.
- ATF6: Key for upregulating a broad set of chaperones (like BiP). Monitor the cleaved nuclear ATF6 fragment (ATF6f). A combinatorial approach using reporters for all three branches is often most informative.
Q4: What is a standard protocol for measuring ER stress via Western Blot? A4: Method: Sequential Extraction and Western Blot for UPR Markers
- Cell Lysis: Use RIPA buffer for total protein extracts. For nuclear fraction (ATF6f), use a commercial nuclear extraction kit.
- Sample Preparation: Load 20-30 µg of protein per lane on a 4-12% Bis-Tris gel.
- Electrophoresis & Transfer: Run at 120V for 90 min. Transfer to PVDF membrane using standard wet transfer.
- Blocking & Antibody Incubation: Block with 5% non-fat milk in TBST for 1h. Incubate with primary antibodies in 5% BSA/TBST overnight at 4°C.
- Key Antibodies: BiP/GRP78 (1:1000), p-eIF2α (Ser51) (1:1000), Total eIF2α (1:2000), CHOP (1:500), β-Actin (1:5000).
- Detection: Use HRP-conjugated secondary antibodies (1:5000) and chemiluminescent substrate. Image with a digital chemiluminescence imager.
The Scientist's Toolkit: Research Reagent Solutions
Table 2: Essential Reagents for ER Stress Research
| Reagent / Material | Function & Application | Example Product/Catalog # |
|---|---|---|
| Tunicamycin | Induces ER stress by inhibiting protein N-glycosylation. Positive control for UPR. | Sigma-Aldrich, T7765 |
| Thapsigargin | Induces ER stress by inhibiting the SERCA Ca²⁺ pump. Positive control for IRE1/PERK. | Cayman Chemical, 10522 |
| 4-Phenylbutyric Acid (4-PBA) | Chemical chaperone that alleviates ER stress; used as a therapeutic control. | Sigma-Aldrich, SML0309 |
| XBP1 Splicing Primers | Detect the unconventional splicing of XBP1 mRNA, a hallmark of IRE1 activation. | Custom DNA oligos (see protocol above). |
| ATF6 Luciferase Reporter | Plasmid containing ERSE promoter elements to specifically monitor ATF6 pathway activation. | Addgene, plasmid #11976 |
| BiP/GRP78 Antibody | Primary antibody to detect levels of the key ER chaperone, a master regulator of UPR. | Cell Signaling Tech, #3177 |
| Phospho-eIF2α (Ser51) Antibody | Primary antibody to detect PERK pathway activation and translational attenuation. | Cell Signaling Tech, #3398 |
| CHOP (DDIT3) Antibody | Primary antibody to detect the pro-apoptotic transcription factor, marker of prolonged stress. | Cell Signaling Tech, #5554 |
| ER-Tracker Dye | Live-cell staining dye selective for the endoplasmic reticulum for imaging ER morphology. | Thermo Fisher, E34250 |
Experimental Visualization
Diagram 1: Core UPR Signaling Pathways
Diagram 2: ER Stress Experiment Workflow
Technical Support Center
Welcome to the UPR Sentinel Technical Support Center. This guide provides troubleshooting and FAQs for common experimental challenges in the study of IRE1α, PERK, and ATF6 pathways within the broader context of research on protein misfolding and ER stress in eukaryotic systems.
FAQs & Troubleshooting
Q1: My immunoblot for XBP1s is consistently weak or absent, even with known ER stress inducers like thapsigargin. What could be wrong?
- A: Weak XBP1s detection is common. First, verify the efficiency of IRE1α's RNase activity.
- Key Check: Perform RT-PCR (not qPCR) using primers flanking the 26-base intron in XBP1 mRNA. Resolve products on a high-percentage (2.5-3%) agarose gel. You should see two bands: unspliced (XBP1u) and spliced (XBP1s). This is the gold-standard validation.
- Reagent Control: Ensure your stress inducer is active. Titrate thapsigargin (e.g., 0.1, 0.5, 1.0 µM for 4-8 hrs) and include a positive control like tunicamycin (1-5 µg/mL).
- Antibody Issue: Many XBP1s antibodies have poor specificity. Confirm your antibody data with the PCR assay above.
- A: Weak XBP1s detection is common. First, verify the efficiency of IRE1α's RNase activity.
Q2: I see strong ATF6 cleavage but no corresponding increase in downstream target gene (e.g., HSPA5, HERPUD1) expression. Why the discrepancy?
- A: Cleavage liberates the cytosolic fragment (ATF6f) but does not guarantee transcriptional activity.
- Nuclear Translocation Check: Perform subcellular fractionation or immunofluorescence to confirm ATF6f nuclear entry post-stimulation.
- Activity Assay: Use a luciferase reporter plasmid containing an ER stress response element (ERSE) to measure ATF6 transcriptional activity directly, independent of endogenous gene chromatin states.
- Feedback Inhibition: Chronic ER stress can lead to UPR attenuation. Perform a time-course (e.g., 1, 2, 4, 8 hours) to catch the peak of activation.
- A: Cleavage liberates the cytosolic fragment (ATF6f) but does not guarantee transcriptional activity.
Q3: Phospho-eIF2α levels increase as expected with PERK activation, but CHOP induction is minimal. What might be blocking the signal?
- A: PERK-p-eIF2α signaling can be modulated at multiple points.
- GADD34 Feedback: CHOP induces PPP1R15A (GADD34), which dephosphorylates eIF2α, creating a negative feedback loop. Use salubrinal (an eIF2α phosphatase inhibitor) to stabilize p-eIF2α and enhance CHOP signal.
- Integrated Stress Response (ISR) Crosstalk: Other kinases (PKR, GCN2, HRI) also phosphorylate eIF2α. Use a specific PERK inhibitor (e.g., GSK2606414) to confirm the signal is PERK-dependent.
- Cell-Type Specificity: CHOP induction thresholds vary. Check other PERK targets like ATF4 mRNA/protein to confirm pathway integrity.
- A: PERK-p-eIF2α signaling can be modulated at multiple points.
Common UPR Inducers & Inhibitors: Concentrations and Effects Data sourced from current literature and product datasheets.
| Reagent Name | Primary Target | Typical Working Concentration | Key Effect / Readout | Notes & Caveats |
|---|---|---|---|---|
| Thapsigargin | SERCA pump | 0.1 - 1.0 µM | ER Ca²⁺ depletion; activates all 3 UPR arms | Fast, potent, irreversible. Can induce apoptosis quickly. |
| Tunicamycin | N-linked glycosylation | 0.5 - 5.0 µg/mL | Accumulation of unfolded glycoproteins; activates all 3 UPR arms | Slower onset. Cytotoxicity can be batch-dependent. |
| DTT | Disulfide bonds | 1 - 5 mM (reducing agent) | ER redox disruption; strong IRE1α/PERK activation | Short, pulsed treatment (e.g., 30 min). Very reversible. |
| GSK2606414 | PERK kinase | 0.1 - 1.0 µM | Inhibits PERK autophosphorylation and eIF2α phosphorylation | Can induce compensatory ATF6 activation. Check for off-target effects. |
| 4µ8C | IRE1α RNase | 10 - 100 µM | Inhibits XBP1 splicing & RIDD | Selectivity over other RNases should be validated. |
| Salubrinal | eIF2α phosphatase complex | 25 - 75 µM | Enhances/preserves p-eIF2α levels | Inhibits GADD34-containing complexes; not entirely PERK-specific. |
| AEBSF | S1P protease | 100 - 200 µM | Inhibits ATF6 cleavage by S1P | Cell-permeable serine protease inhibitor; used to block ATF6 processing. |
Core Protocol: Monitoring All Three UPR Pathways via Immunoblotting
Objective: To simultaneously assess the activation status of IRE1α, PERK, and ATF6 pathways in adherent mammalian cells following ER stress induction.
Materials: Cells, ER stress inducers (see table), RIPA buffer + protease/phosphatase inhibitors, SDS-PAGE system, transfer apparatus, primary/secondary antibodies, ECL reagent.
Key Antibody Panel:
- IRE1α Pathway: Anti-XBP1s (for spliced protein), anti-IRE1α (possible mobility shift), anti-BiP/GRP78 (load/activation).
- PERK Pathway: Anti-phospho-PERK (Thr980), anti-phospho-eIF2α (Ser51), total eIF2α, anti-ATF4, anti-CHOP.
- ATF6 Pathway: Anti-ATF6 (full-length, ~90kDa; cleaved cytosolic fragment ~50kDa). Note: Cleavage best observed under reducing conditions.
Procedure:
- Treatment: Seed cells in 6-well plates. At 70-80% confluence, treat with chosen inducer (e.g., 1µM Thapsigargin) or vehicle (DMSO) for a optimized time (e.g., 4-8 hours).
- Lysis: Aspirate medium, wash with ice-cold PBS. Lyse cells directly in 150-200 µL of RIPA buffer with inhibitors on ice for 15 min. Scrape and clarify by centrifugation (14,000g, 15 min, 4°C).
- Immunoblotting:
- Gel Loading: Load 20-40 µg of protein per lane. Include a molecular weight marker.
- Gel Type: Use a 10-12% gel for most targets. For optimal resolution of ATF6 cleavage products, a 10% gel is recommended.
- Transfer: Standard wet or semi-dry transfer to PVDF membrane.
- Blocking: Block with 5% non-fat milk or BSA in TBST for 1 hour.
- Antibody Incubation: Incubate with primary antibodies diluted in blocking buffer overnight at 4°C. Use appropriate species-specific HRP-conjugated secondary antibodies for 1 hour at RT.
- Detection: Develop with ECL reagent and image.
The Scientist's Toolkit: Essential Research Reagents
| Item | Function in UPR/ER Stress Research |
|---|---|
| Brefeldin A | Blocks ER-to-Golgi transport; used to trap and visualize full-length ATF6 in the ER. |
| Luciferase Reporter Plasmids (e.g., ERSE-, UPRE-luciferase) | Quantify transcriptional output of ATF6 (ERSE) or XBP1s (UPRE) pathways. |
| Site-2 Protease (S2P) Inhibitor (e.g., S2Pi) | Specific inhibitor of the final cleavage of ATF6 in the Golgi; used to confirm ATF6 processing. |
| IRE1α FRET Biosensor (e.g., ER-LiveCell IRE1) | Live-cell imaging of IRE1α oligomerization/activation kinetics. |
| XBP1-Venus Splicing Reporter Cell Line | Visualize and sort cells actively undergoing IRE1α-mediated XBP1 splicing. |
| CHOP::GFP Reporter Mouse/Cells | In vivo or ex vivo tracking of chronic or severe ER stress. |
| ISRIB (Integrated Stress Response Inhibitor) | Reverses the effects of eIF2α phosphorylation; used to confirm PERK/ISR-dependent phenotypes. |
UPR Signaling Pathways Overview
Diagram Title: UPR Tripartite Signaling Pathways from ER Stress to Nuclear Response
Experimental Workflow for UPR Pathway Analysis
Diagram Title: Comprehensive UPR Analysis Experimental Workflow
Technical Support Center: Troubleshooting UPR & ER Stress Experiments
Context: This support center provides guidance for researchers investigating the Unfolded Protein Response (UPR) and endoplasmic reticulum (ER) stress within the broader thesis of understanding and mitigating protein misfolding in eukaryotic systems for therapeutic discovery.
FAQs & Troubleshooting Guides
Q1: My Western blot for UPR sensors (IRE1α, PERK, ATF6) shows inconsistent or weak activation signals despite using a known ER stress inducer (e.g., Tunicamycin). What could be wrong? A: Common issues and solutions:
- Problem: Inadequate stress induction or wrong time point.
- Solution: Perform a time-course and dose-response experiment. See Table 1 for standard concentrations. Ensure drug solubility and stability (e.g., Tunicamycin degrades in aqueous solution; use fresh DMSO stocks).
- Problem: Poor antibody specificity or lysis conditions.
- Solution: Use validated antibodies for phosphorylated forms (p-IRE1α, p-PERK, p-eIF2α) and active cleaved ATF6. Ensure your lysis buffer contains appropriate phosphatase and protease inhibitors. Include positive controls (cells treated with a high dose of Tg/Tm) and negative controls (untreated).
- Problem: Cell line variability in UPR responsiveness.
- Solution: Some cell lines have attenuated UPR. Confirm using a reporter assay (e.g., ERSE- or UPRE-luciferase) as a functional readout alongside Western blot.
Q2: How do I definitively distinguish between pro-adaptive UPR and pro-apoptotic UPR signaling in my cellular model? A: You must monitor a panel of markers across time. Reliance on a single marker is insufficient.
- Early Adaptation (Hours 1-8): Look for XBP1 splicing (via RT-PCR), ATF6 cleavage, phosphorylation of eIF2α (which attenuates translation), and induction of chaperones like BiP/GRP78 and PDI.
- Late Apoptosis (Hours 12-24+): Look for sustained high levels of CHOP/GADD153, cleavage of caspase-3/-4/-12, and phosphorylation of JNK. Apoptosis commitment often correlates with a switch from transient eIF2α phosphorylation to its dephosphorylation via GADD34, allowing CHOP translation.
Q3: My CHOP knockout cells are still undergoing apoptosis upon prolonged ER stress. What alternative pathways should I investigate? A: CHOP is a major but not exclusive pro-apoptotic arm. You should troubleshoot by examining:
- IRE1α-TRAF2-JNK Pathway: Sustained IRE1α activation can recruit TRAF2, leading to ASK1 and JNK activation, promoting apoptosis via Bcl-2 family proteins.
- PERK-independent eIF2α phosphorylation: Other kinases like PKR can phosphorylate eIF2α.
- Caspase-4/-12 Direct Activation: In human cells (caspase-4) and rodents (caspase-12), these ER-membrane-associated caspases can be directly activated by ER stress, independent of CHOP.
- Mitochondrial Amplification: ER stress can cause calcium release, triggering the intrinsic mitochondrial apoptosis pathway. Check for cytochrome c release and Bax/Bak activation.
Q4: What are the best practices for measuring ER calcium depletion accurately? A: Key methodological considerations:
- Use Targeted Probes: Employ rationetric, ER-targeted cameleon sensors (e.g., D1ER) or fluorescent dyes like Mag-Fluo-4 AM (low affinity for Ca²⁺, suited for high [Ca²⁺]ER). Avoid cytosolic dyes for direct ER measurement.
- Calibrate Signals: Perform in-situ calibration using ionomycin (to release Ca²⁺) and a Ca²⁺ chelator (e.g., EGTA/BAPTA) to define Rmin and Rmax.
- Control for Loading/Leakage: Include a stable ER luminal marker (e.g., ER-targeted GFP) to normalize for probe retention and cell morphology changes.
Table 1: Common ER Stress Inducers - Experimental Parameters
| Inducer | Primary Target | Typical Working Concentration | Time to Initial UPR (Adaptive) | Time to Apoptosis Markers | Key Considerations |
|---|---|---|---|---|---|
| Tunicamycin (Tm) | N-linked glycosylation (inhibitor) | 1 - 5 μg/mL | 1 - 4 hours | 12 - 24 hours | Irreversible; prepare fresh in DMSO; effects vary by cell type. |
| Thapsigargin (Tg) | SERCA pump (inhibitor) | 100 nM - 1 μM | 30 min - 2 hours | 8 - 18 hours | Potent Ca²⁺ disruptor; irreversible; highly toxic. |
| Dithiothreitol (DTT) | Disulfide bond formation (reducing agent) | 1 - 5 mM | 15 min - 1 hour | 6 - 12 hours | Reversible; causes rapid redox imbalance; use for acute stress. |
| Brefeldin A (BFA) | ER-to-Golgi transport (inhibitor) | 5 - 10 μM | 2 - 6 hours | 18 - 36 hours | Less specific for pure ER stress; also disrupts Golgi. |
Table 2: Key UPR Marker Dynamics & Detection Methods
| UPR Branch | Sensor | Adaptive Phase Marker | Pro-apoptotic Phase Marker | Detection Technique |
|---|---|---|---|---|
| IRE1α | IRE1α | XBP1 mRNA splicing, EDEM1 induction | Sustained IRE1α activity, TRAF2/ASK1/JNK activation | RT-PCR (splicing), Reporter (UPRE-luc), WB (pTRAF2, pJNK) |
| PERK | PERK | p-eIF2α, ATF4 translation, BiP induction | CHOP induction, GADD34-mediated feedback | WB (p-eIF2α, ATF4, CHOP), qPCR (CHOP, GADD34) |
| ATF6 | ATF6 | Cleaved ATF6 (p50), BiP, XBP1 induction | Can contribute to CHOP induction in later phases | WB (Cleaved ATF6), Reporter (ERSE-luc) |
Experimental Protocols
Protocol 1: Detecting XBP1 Splicing via RT-PCR
- Purpose: Measure IRE1α endoribonuclease activity, a key early adaptive UPR event.
- Method:
- Cell Treatment & Lysis: Treat cells with ER stressor (e.g., 2μg/mL Tm for 4h). Harvest and isolate total RNA using TRIzol.
- Reverse Transcription: Synthesize cDNA using 1μg RNA and oligo(dT) or random primers.
- PCR Amplification: Use primers flanking the XBP1 splice site (human: F: 5′-AAACAGAGTAGCAGCTCAGACTGC-3′, R: 5′-TCCTTCTGGGTAGACCTCTGGGAG-3′). Cycle: 94°C 3min; (94°C 30s, 58°C 30s, 72°C 30s) x 30-35 cycles; 72°C 5min.
- Product Analysis: Run PCR product on a 3-4% agarose or polyacrylamide gel. Un-spliced (uXBP1): ~473bp. Spliced (sXBP1): ~447bp (26bp removed). Both bands appear during active splicing.
Protocol 2: Monitoring ER Stress-Induced Apoptosis via Caspase-3/7 Activity Assay
- Purpose: Quantitatively assess commitment to apoptosis following prolonged ER stress.
- Method (Luminescence-based):
- Cell Plating: Seed cells in a white-walled 96-well plate.
- Treatment: Treat with stressors for desired duration (e.g., 1μM Tg for 16-24h).
- Assay: Aspirate media. Add 100μL of Caspase-Glo 3/7 reagent (or equivalent) per well.
- Incubation & Readout: Mix on orbital shaker for 30s, incubate at room temperature for 30-60min. Measure luminescence in a plate reader. Normalize to cell viability (e.g., parallel MTT assay).
Pathway & Workflow Diagrams
The Scientist's Toolkit: Research Reagent Solutions
| Item | Function & Application | Example Product/Catalog # (Illustrative) |
|---|---|---|
| ER Stress Inducers (Tool Compounds) | Induce specific ER perturbations to trigger the UPR for experimental study. | Tunicamycin (Tm), Thapsigargin (Tg), Dithiothreitol (DTT), Brefeldin A (BFA) |
| UPR Pathway Inhibitors | Chemically inhibit specific UPR branches to dissect their role in cell fate. | GSK2606414 (PERK inhibitor), 4μ8c (IRE1α RNase inhibitor), AEBSF (ATF6 inhibitor) |
| Phospho-Specific Antibodies | Detect activated (phosphorylated) forms of UPR sensors and effectors by WB/IF. | Anti-p-PERK (Thr980), Anti-p-eIF2α (Ser51), Anti-p-IRE1α (Ser724) |
| CHOP & ATF4 Antibodies | Key markers for the pro-apoptotic (CHOP) and integrated stress (ATF4) responses. | Anti-CHOP/GADD153, Anti-ATF4 |
| XBP1 Splicing Assay Primers | Standardized primers to detect the 26bp splice event catalyzed by active IRE1α via RT-PCR. | Species-specific primers spanning the human/mouse XBP1 splice site. |
| ER-Targeted Fluorescent Probes | Measure ER-specific parameters like Ca²⁺ levels or redox state. | Mag-Fluo-4 AM (ER Ca²⁺), ER-Tracker Dyes (ER morphology), roGFP-based ER redox sensors |
| Caspase-3/7 Activity Assay Kits | Quantitative, sensitive luminescent or fluorescent measurement of effector caspase activity. | Caspase-Glo 3/7 Assay, Fluorometric Caspase-3 Assay Kit |
| UPRE/ERSE Luciferase Reporters | Plasmid constructs to monitor transcriptional output of the IRE1α/XBP1 and ATF6 pathways. | pUPRE-Luc, p5xATF6-GL3 (ERSE reporter) |
| ER Stress ELISA/Kits | Quantify secreted biomarkers of ER stress (e.g., for in vivo samples). | Human/Mouse BiP/GRP78 ELISA Kit |
| Cell Viability Assay Reagents | Normalize apoptosis/cell death data to overall cytotoxicity. | MTT, WST-1, CellTiter-Glo Luminescent Assay |
Welcome, Researcher. This center provides troubleshooting guidance for experiments investigating Endoplasmic Reticulum (ER) stress and the Unfolded Protein Response (UPR) in the context of neurodegenerative disease, diabetes, and cancer. The protocols and FAQs are framed within the thesis of targeting protein misfolding and ER stress as a convergent therapeutic strategy.
Troubleshooting Guides & FAQs
FAQ Category 1: UPR Pathway Activation & Detection
Q1: My western blots for key UPR markers (e.g., p-eIF2α, XBP1s, CHOP) are inconsistent. What are the critical controls and best practices?
A: Inconsistent detection often stems from suboptimal stress induction or lysis. Follow this protocol:
- Positive Control Induction:
- Thapsigargin (SERCA inhibitor): Treat cells (e.g., HeLa, MEFs) at 300 nM for 2-6 hours. Optimize duration for your marker of interest.
- Tunicamycin (N-glycosylation inhibitor): Use 2-5 µg/mL for 4-8 hours.
- Lysis Buffer: Use a robust RIPA buffer supplemented with fresh protease and phosphatase inhibitors. Keep samples on ice.
- Essential Controls: Always run the following lanes:
- Untreated cells.
- Thapsigargin/Tunicamycin-treated cells (positive control).
- Genetic/Pharmacological Manipulation: e.g., Cells treated with a PERK inhibitor (GSK2606414, 200 nM) + stressor.
Q2: How do I accurately quantify the splicing of XBP1?
A: The gold standard is RT-PCR followed by a restriction digest, not just qPCR.
- Protocol:
- Primers: Use primers flanking the unconventional splice site (e.g., human: 5'-CCTGGTTGCTGAAGAGGAGG-3' & 5'-CCATGGGGAGATGTTCTGGAG-3').
- RT-PCR: Run PCR product on a standard agarose gel (2-3%).
- Digest: Incubate PCR product with PstI restriction enzyme. Unspliced XBP1 (uXBP1) contains a PstI site, which is lost upon splicing to sXBP1.
- Analysis: Resolve digested products on a gel. Bands: uXBP1 (cut): 291/29 bp; sXBP1 (uncut): 320 bp.
FAQ Category 2: Measuring ER Stress & Apoptosis
Q3: My cell viability assays (e.g., MTT) show high variability after ER stress induction. How can I better distinguish cytoprotective UPR from terminal UPR/apoptosis?
A: Rely on multi-parametric assays. See the table below for a comparative approach.
Table 1: Assays for Monitoring ER Stress Outcomes
| Assay Type | Specific Target/Readout | Tool/Reagent Example | Indicates | Typical Timeframe |
|---|---|---|---|---|
| Viability | Metabolic Activity | MTT, CellTiter-Glo | Overall Health | 24-72 hrs |
| Proliferation | DNA Synthesis | EdU Incorporation | Growth Arrest | 12-48 hrs |
| Early Apoptosis | Phosphatidylserine Exposure | Annexin V-FITC / PI staining | Commitment to Death | 18-48 hrs |
| Caspase Activation | Cleaved Caspase-3 (Western) or Activity | Caspase-Glo 3/7 Assay | Execution Phase | 24-72 hrs |
| Transcriptomic | CHOP, GADD34, ERdj4 Expression | qPCR, RNA-seq | Pro-apoptotic Shift | 8-24 hrs |
Q4: What is a reliable method to measure intracellular Ca²⁺ flux from the ER?
A: Use ratiometric dyes for robust quantification.
- Protocol (Using Fura-2 AM):
- Load cells with 2-5 µM Fura-2 AM in imaging buffer for 30-45 min at 37°C.
- Wash and incubate for 20 min for de-esterification.
- Place under a fluorescence microscope with excitation at 340 nm and 380 nm, emission at 510 nm.
- Acquire baseline ratio (F340/F380), then add Thapsigargin (2 µM) to inhibit SERCA and induce ER Ca²⁺ release.
- Calculate: The ΔRatio (Peak Ratio - Baseline Ratio) indicates ER Ca²⁺ store content.
FAQ Category 3: Disease-Specific Models
Q5: When using mutant protein overexpression models (e.g., Huntingtin-Q74, mutant Proinsulin [Akita]), how do I confirm the phenotype is due to ER stress and not general proteotoxicity?
A: Employ rescue experiments with chemical chaperones and UPR-modulating drugs.
- Experimental Workflow:
- Group 1: Vector Control
- Group 2: Mutant Protein Expression
- Group 3: Mutant Protein + 4-PBA (Chemical Chaperone, 2-5 mM)
- Group 4: Mutant Protein + ISRIB (Integrated Stress Response Inhibitor, 200 nM)
- Assess: Cell viability, aggregation (filter trap assay for htt), and secretion (ELISA for proinsulin/insulin). Rescue by 4-PBA and ISRIB implicates ER/ISR stress.
Q6: In cancer cell lines, how do I test if chronic UPR activation is a vulnerability?
A: Perform clonogenic survival assays with UPR pathway inhibitors.
- Protocol:
- Seed cells at low density (300-1000 cells/well in a 6-well plate).
- Treat with DMSO (control), PERK inhibitor (GSK2606414), IRE1α RNase inhibitor (4µ8C, 10-50 µM), or a combination.
- Refresh media + drugs every 3-4 days.
- After 10-14 days, fix with methanol, stain with crystal violet (0.5%), and count colonies (>50 cells). A significant reduction in colony formation indicates dependency on that UPR arm.
The Scientist's Toolkit: Research Reagent Solutions
Table 2: Essential Reagents for ER Stress Research
| Reagent / Material | Category | Primary Function in Research | Example Product/Catalog # |
|---|---|---|---|
| Thapsigargin | ER Stress Inducer | Specific inhibitor of SERCA pump; rapidly depletes ER Ca²⁺ stores, inducing robust UPR. | Sigma-Aldrich, T9033 |
| Tunicamycin | ER Stress Inducer | Inhibits N-linked glycosylation; causes accumulation of misfolded proteins in the ER lumen. | Cayman Chemical, 11445 |
| 4-Phenylbutyrate (4-PBA) | Chemical Chaperone | Reduces ER stress by improving protein folding capacity and trafficking. Used in rescue experiments. | Sigma-Aldrich, SML0309 |
| GSK2606414 | PERK Inhibitor | Potent and selective ATP-competitive inhibitor of PERK kinase; blocks the PERK-eIF2α arm. | MedChemExpress, HY-18072 |
| 4µ8C | IRE1α RNase Inhibitor | Allosteric inhibitor of IRE1α's RNase activity; blocks XBP1 splicing and RIDD. | Tocris, 5025 |
| ISRIB | Integrated Stress Response Inhibitor | Reverses the effects of eIF2α phosphorylation; restores protein translation. | Sigma-Aldrich, SML0843 |
| Fura-2 AM | Calcium Indicator | Ratiometric fluorescent dye for quantitative measurement of cytosolic/ER Ca²⁺ dynamics. | Thermo Fisher, F1221 |
| Anti-CHOP Antibody | Detection Antibody | Marker for sustained/pro-apoptotic ER stress (Western, IF). Essential for terminal UPR readout. | Cell Signaling Tech, 5554S |
| Anti-KDEL Antibody | Detection Antibody | Pan-ER resident protein marker (e.g., GRP78/BiP, GRP94). Useful for assessing ER expansion/mass. | Abcam, ab176333 |
| XBP1 Splicing Primer Set | Molecular Biology Assay | Validated primers for detecting the unconventional splicing of XBP1 mRNA via RT-PCR/digest. | Origene, HP204514 |
Visualizations
Diagram 1: Core UPR Signaling Pathways
Diagram 2: Experimental Workflow for ER Stress Intervention
Technical Support Center: Troubleshooting ER Stress in Protein Expression
FAQs & Troubleshooting Guides
Q1: My CHO cell culture shows reduced viability and titer after induction. Microscopy reveals a dilated ER. Is this ER stress, and what are the first steps to confirm it? A: Yes, these are classic signs. To confirm and quantify ER stress, implement the following multi-assay protocol:
qRT-PCR for UPR Marker Genes:
- Primer Targets: BiP/GRP78, CHOP (DDIT3), XBP1s (spliced variant).
- Protocol: Extract total RNA (TRIzol method). Perform cDNA synthesis. Run qPCR with SYBR Green. Normalize to housekeeping genes (e.g., GAPDH, β-actin). A >2-fold increase in BiP and CHOP indicates active UPR.
- Key Control: Include a non-induced/low-producing cell line baseline.
Western Blot for Protein-Level UPR Activation:
- Targets: Phospho-eIF2α (Ser51), cleaved ATF6 (p50), XBP1s.
- Protocol: Lyse cells in RIPA buffer with protease/phosphatase inhibitors. Run 30-50 µg protein on 10% SDS-PAGE, transfer to PVDF, and probe with specific antibodies. Increased phospho-eIF2α and detection of XBP1s/cleaved ATF6 confirm UPR branch activation.
Q2: How can I quickly determine which recombinant protein properties are causing the bottleneck? A: Analyze sequence and expression parameters. Correlate the data in the table below with UPR assay results.
Table 1: Protein Properties Correlated with ER Stress Risk
| Property | Low-Risk Profile | High-Risk Profile | Typical Impact on ER |
|---|---|---|---|
| Disulfide Bonds | 0-2 bonds | >5 bonds | High demand for ERO1/PDI, redox imbalance |
| Complex Domains | Single, stable domain | Multiple, cysteine-rich domains (e.g., EGF-like) | Prone to misfolding, chaperone sequestration |
| Secretion Signal | Strong native signal (e.g., IL-2) | Weak or non-optimal signal peptide | Slow translocation, clogging at translocon |
| Expression Rate | Moderate, controlled (e.g., via weak promoter) | Very high, rapid (strong promoter + high copy #) | Overwhelms chaperone & folding capacity |
Q3: What are the most effective genetic engineering strategies to engineer the host cell for reduced ER stress? A: Stably engineering the host cell line provides a long-term solution. The primary pathways and strategies are visualized below.
Host Cell Engineering to Alleviate ER Stress
Q4: What are the optimal culture condition adjustments to mitigate ER stress during a production run? A: Fine-tuning the bioreactor environment is critical. Implement this workflow to systematically test and optimize conditions.
Culture Condition Optimization Workflow
Q5: Can I use pharmacological agents to temporarily relieve ER stress during production? A: Yes, chemical chaperones and UPR modulators can be useful as research tools and potentially in processes. See the table below for options, but note that cost and clearance for cGMP production must be evaluated.
Table 2: Pharmacological Agents for ER Stress Modulation
| Agent | Class | Proposed Mechanism | Typical Test Concentration | Key Consideration |
|---|---|---|---|---|
| 4-Phenylbutyrate (4-PBA) | Chemical Chaperone | Stabilizes protein conformation, promotes trafficking | 1-5 mM | Can be cytotoxic at >5 mM; may require washout. |
| Tauroursodeoxycholic Acid (TUDCA) | Bile Acid, Chaperone | Improves ER folding capacity, inhibits apoptosis | 50-500 µM | Generally low cytotoxicity. |
| Salubrinal | eIF2α phosphatase inhibitor | Sustains phospho-eIF2α, reduces translation load | 10-50 µM | Can strongly inhibit overall protein synthesis. |
| ISRIB | Integrated Stress Response inhibitor | Reverses eIF2α phosphorylation effects | 50-200 nM | May reduce adaptive UPR benefits. |
The Scientist's Toolkit: Key Research Reagent Solutions
Table 3: Essential Reagents for ER Stress Research
| Reagent / Material | Function / Application | Example Product/Catalog # |
|---|---|---|
| Thapsigargin | SERCA pump inhibitor; induces ER stress as a positive control for UPR activation. | Cayman Chemical #11322 |
| Tunicamycin | N-linked glycosylation inhibitor; induces ER stress via unfolded protein accumulation. | Sigma-Aldrich #T7765 |
| Anti-BiP/GRP78 Antibody | Key marker for UPR activation via western blot, immunofluorescence, or flow cytometry. | Cell Signaling Technology #3177 |
| Anti-Phospho-eIF2α (Ser51) Antibody | Detects activation of the PERK-eIF2α branch of the UPR. | Cell Signaling Technology #3398 |
| XBP1 Splicing Assay Kit | Detects the unconventional splicing of XBP1 mRNA, a hallmark of IRE1α activation. | Takara Bio #636793 |
| ER-Tracker Dyes | Live-cell imaging of the endoplasmic reticulum morphology. | Thermo Fisher Scientific #E34250 |
| Human/CHO Cell ER Stress qPCR Array | Profiles expression of 80+ UPR and ER stress-related genes for pathway analysis. | Qiagen #PAHS-290Z (customizable) |
| Lenti-X BxBi-ATF6(1-373) Lentivirus | For stable expression of a constitutively active ATF6 to engineer enhanced ER capacity. | Takara Bio #631809 |
Intervention Toolkit: Cutting-Edge Methods to Modulate ER Stress and Protein Folding
This technical support center is designed within the thesis context of "Addressing Protein Misfolding and ER Stress in Eukaryotic Hosts for Therapeutic Development." It provides troubleshooting guidance for researchers working with chemical and pharmacological chaperones.
Frequently Asked Questions (FAQs) & Troubleshooting Guides
Q1: My pharmacological chaperone (PC) shows high affinity in vitro but fails to restore mutant enzyme activity in my patient-derived fibroblast culture. What could be the issue? A: This is a common translation challenge. Potential causes and solutions include:
- Off-target trafficking: The PC may facilitate ER export but the mutant protein is subsequently degraded in the lysosome. Use a lysosomal inhibitor (e.g., chloroquine) in conjunction with your PC to test this.
- Insufficient ER Residence Time: The PC may dissociate too early. Consider testing a higher dose or a PC with slower off-rate kinetics. Monitor the protein's half-life via pulse-chase analysis.
- Loss-of-Function Beyond Folding: The mutation may affect active site chemistry, not just folding. A PC can correct folding but not a fundamentally compromised active site. Perform a thermal shift assay to confirm proper folding and a direct enzyme activity assay on purified protein.
- Incorrect Buffer/Media Conditions: Ensure your culture media pH and osmolality are optimal for both cell health and the specific chaperone's function.
Q2: I am using 4-phenylbutyrate (4-PBA) as a chemical chaperone to reduce ER stress, but my unfolded protein response (UPR) markers (e.g., BiP, CHOP) remain elevated. Why? A: Persistent UPR indicates unresolved protein misfolding.
- Dosage & Timing: 4-PBA is often used at 0.1-10 mM. Titrate your dose and ensure chronic exposure (24-72 hours) for effective adaptation. Cytotoxicity can occur above 10 mM.
- Mechanism Mismatch: 4-PBA is a broad-spectrum chemical chaperone that aids general proteostasis. If the misfolded protein is highly aggregation-prone, a more specific pharmacological chaperone or a combination therapy (e.g., with an autophagy inducer) may be required.
- Overwhelmed Capacity: The misfolding load may simply exceed the boosted chaperone capacity. Use a protein synthesis inhibitor (e.g., cycloheximide) to confirm if reducing new synthesis allows 4-PBA to clear the backlog.
Q3: How do I distinguish between a compound acting as a pharmacological chaperone (binding the target) versus a chemical chaperone (non-specific stabilization)? A: Perform the following key experiments:
- Specificity Test: Test the compound on multiple unrelated misfolding protein models in your system. A pharmacological chaperone will be specific to its target protein or closely related family.
- Binding Assay: Use isothermal titration calorimetry (ITC) or surface plasmon resonance (SPR) to demonstrate direct, saturable binding to the purified target protein.
- Competition Assay: Co-administer a known, potent competitive inhibitor of the target protein's active site. A true pharmacological chaperone's effect on stability/trafficking will often be blocked by this competitor.
Q4: In my high-throughput screen for pharmacological chaperones, I get a high rate of false positives from compounds that merely upregulate general heat shock proteins. How can I filter these out? A: Incorporate these counterscreen steps into your workflow:
- Primary Screen: Measure rescue of target enzyme activity or fluorescence in a mutant cell line.
- Counterscreen 1: Use a reporter cell line with a heat shock response element (HSE)-driven luciferase. Flag compounds that activate this pathway.
- Counterscreen 2: Perform a thermal shift assay on the purified target protein. Nonspecific HSP inducers will not stabilize the protein in this cell-free system, while direct binders will.
- Validation: Confirm hits via direct binding (ITC/SPR) and assess specificity using an unrelated protein.
Table 1: Common Chemical & Pharmacological Chaperones in Research
| Chaperone Name | Type | Typical Working Concentration (in vitro) | Primary Target/Mechanism | Common Application Model |
|---|---|---|---|---|
| 4-Phenylbutyrate (4-PBA) | Chemical Chaperone | 0.1 - 10 mM | Non-specific stabilization, HDAC inhibition, ammonia scavenger | CFTR-ΔF508, Neurodegenerative disease models |
| Trimethylamine N-oxide (TMAO) | Chemical Chaperone | 5 - 100 mM | Osmolyte, stabilizes native protein fold | In vitro protein refolding assays |
| Glycerol | Chemical Chaperone | 1 - 5% (v/v) | Solvent properties, stabilizes hydration shell | Protein storage, in vitro folding |
| Migalastat (Galafold) | Pharmacological Chaperone | 10 nM - 10 µM | α-Galactosidase A (active site) | Fabry disease (α-Gal A mutations) |
| Tafamidis (Vyndamax) | Pharmacological Chaperone | 1 - 50 µM | Transthyretin (TTR) tetramer stabilizer | TTR amyloidosis |
| Celastrol | Proteostasis Regulator | 0.1 - 5 µM | HSF1 activator, induces HSPs | Huntington's, Parkinson's disease models |
Table 2: Standard ER Stress & UPR Reporter Assays
| Assay | Readout | Key Marker(s) | Typical Fold-Change with Severe Stress |
|---|---|---|---|
| qRT-PCR | mRNA levels | ATF4, XBP1s, CHOP, BiP/GRP78 | 2-fold to >10-fold increase |
| Western Blot | Protein levels | Phospho-eIF2α, ATF4, CHOP, Cleaved ATF6 | Variable; Phospho-proteins often show clearest signal |
| Reporter Cell Line | Luciferase/GFP | ERSE (ER Stress Element) or UPRE (UPR Element) promoter activity | 3-fold to 50-fold luminescence increase |
| ELISA | Secreted Protein | BiP/GRP78 (from cell media) | Moderate; best for longitudinal studies |
Detailed Experimental Protocols
Protocol 1: Thermal Shift Assay (Differential Scanning Fluorimetry) for Chaperone Binding Purpose: To identify if a compound directly binds and stabilizes a purified target protein. Materials: Purified protein, fluorescent dye (e.g., SYPRO Orange), real-time PCR instrument, assay plate, test compounds. Steps:
- Dilute purified protein to 0.2-1 mg/mL in assay buffer (e.g., PBS, pH 7.4).
- Prepare a 5X stock of SYPRO Orange dye.
- In a PCR plate, mix 18 µL of protein solution with 2 µL of test compound (or buffer control) and 2 µL of 5X SYPRO Orange.
- Seal the plate and centrifuge briefly.
- Run in a real-time PCR instrument with a temperature gradient (e.g., 25°C to 95°C, ramp rate of 1°C/min). Monitor fluorescence (excitation ~470-490 nm, emission ~560-580 nm).
- Analyze data to determine the melting temperature (Tm). A positive shift in Tm (>1°C) indicates compound-induced stabilization.
Protocol 2: Pulse-Chase Analysis to Monitor Protein Trafficking Rescue Purpose: To measure the effect of a chaperone on the synthesis, maturation, and degradation of the target protein. Materials: Radioactive amino acids ([³⁵S]-Met/Cys), target cell line, lysis buffer, immunoprecipitation antibodies, chase medium. Steps:
- Starve: Wash cells and incubate in methionine/cysteine-free media for 30-60 min.
- Pulse: Add [³⁵S]-Met/Cys labeling mix. Incubate (typically 15-30 min) to label newly synthesized proteins.
- Chase: Remove labeling mix, wash, and add complete media (with excess unlabeled Met/Cys) with or without the test chaperone. This starts the "chase."
- Harvest: At chase time points (e.g., 0, 30, 60, 120, 240 min), lyse cells.
- Immunoprecipitation: Use an antibody specific to your target protein to isolate it from the lysate.
- Analysis: Run samples on SDS-PAGE, dry gel, and expose to a phosphorimager screen. Quantify bands corresponding to immature (ER) and mature (Golgi/plasma membrane) forms.
Visualizations
Diagram 1: UPR Signaling & Chaperone Intervention Points
Diagram 2: Pharmacological Chaperone Screening Workflow
The Scientist's Toolkit: Research Reagent Solutions
Table 3: Essential Reagents for Chaperone Research
| Reagent | Function in Research | Example Product/Catalog |
|---|---|---|
| Thapsigargin | Potent SERCA inhibitor; induces ER stress as a positive control for UPR assays. | Tocris Bioscience (1138) |
| Tunicamycin | N-linked glycosylation inhibitor; induces ER stress by causing accumulation of unglycosylated proteins. | Sigma-Aldrich (T7765) |
| SYPRO Orange Dye | Environment-sensitive fluorescent dye for Thermal Shift Assays. | Thermo Fisher Scientific (S6650) |
| Ready-to-Use ER Stress Antibody Sampler Kit | Contains antibodies for key UPR markers (p-eIF2α, ATF4, CHOP, XBP-1, BiP). | Cell Signaling Technology (9956) |
| XBP1 Splicing Reporter Lentivirus | Live-cell reporter for IRE1α activation. | Addgene (plasmid 11976) |
| Proteasome Inhibitor (MG-132) | Inhibits ER-associated degradation (ERAD); used to assess if chaperones prevent proteasomal targeting. | Sigma-Aldrich (C2211) |
| Lysosomal Inhibitor (Chloroquine) | Inhibits lysosomal degradation; tests if rescued protein is still cleared via autophagy. | Sigma-Aldrich (C6628) |
| HSF1 Activator (Celastrol) | Positive control for heat shock pathway induction; helps distinguish PC from HSP inducer. | Cayman Chemical (11115) |
Technical Support Center: Troubleshooting Guides & FAQs
Thesis Context: This support center is designed to assist researchers investigating small molecule modulation of the Unfolded Protein Response (UPR) sensors IRE1, PERK, and ATF6, within the broader scope of addressing protein misfolding and ER stress in eukaryotic systems for therapeutic development.
Frequently Asked Questions (FAQs)
Q1: My IRE1 RNase inhibitor (e.g., 4μ8C, MKC-3946) is not effectively blocking XBP1 splicing in my cell model. What could be the issue? A: Ineffective inhibition can stem from several factors:
- Off-Target RNase Activity: Confirm the specificity of your assay. Use an IRE1α-knockout cell line as a control to ensure the splicing signal is genuinely IRE1-dependent.
- Compound Stability & Solubility: 4μ8C has limited aqueous solubility. Ensure it is prepared in DMSO at a stock concentration ≤ 50 mM and that the final DMSO concentration in media does not exceed 0.5% (v/v), as DMSO itself can induce mild ER stress.
- Insufficient ER Stress Induction: The inhibitor's effect is most measurable under robust ER stress. Titrate your stressor (e.g., Tunicamycin, Thapsigargin) and inhibitor concentrations simultaneously. Pre-incubate cells with the inhibitor for 30-60 minutes before adding the stressor.
- Cell Permeability: Verify literature for your specific cell type. Some compounds may require optimization of delivery.
Q2: When treating cells with a PERK activator (e.g., CCT020312), I observe strong eIF2α phosphorylation but a weak or absent ATF4 protein signal. Why? A: This disconnect between p-eIF2α and ATF4 is a common observation.
- Feedback Inhibition: Persistent eIF2α phosphorylation activates feedback loops. GADD34, part of the PP1 phosphatase complex, is upregulated and dephosphorylates eIF2α, shutting off ATF4 translation. Analyze early time points (1-4 hours post-treatment).
- ATF4 Protein Stability: ATF4 has a short half-life. Include a proteasome inhibitor (e.g., MG-132, 10 μM) 1 hour prior to harvesting to prevent degradation.
- Integrated Stress Response (ISR) Crosstalk: Other kinases (PKR, GCN2, HRI) also phosphorylate eIF2α. Use a PERK-specific inhibitor (e.g., GSK2606414) as a control to confirm the p-eIF2α signal is PERK-dependent.
Q3: The ATF6 activator AA147 shows high batch-to-batch variability in activating the ARE-luciferase reporter in my assays. How can I improve reproducibility? A: AA147 is a cysteine-reactive molecule sensitive to storage conditions.
- Storage & Handling: Aliquot the compound under inert gas (Ar/N₂) and store at -80°C in a desiccator. Avoid repeated freeze-thaw cycles. Prepare fresh DMSO stocks for each experiment.
- Cell Density & Health: ATF6 activation is sensitive to confluency. Ensure cells are at a consistent, optimal density (typically 60-70%) and in excellent health at the time of treatment.
- Validation with Direct ER Stressors: Always include a canonical ER stressor like Thapsigargin (1 μM, 6-8h) as a positive control for the ATF6 pathway in your experimental setup.
Q4: I am seeing high cytotoxicity with PERK inhibitor GSK2606414 at published IC₅₀ concentrations in my primary neuronal culture. Is this expected? A: Yes, this is a known challenge. Chronic or high-dose PERK inhibition can lead to loss of prosurvival signaling and exacerbate ER stress-induced apoptosis, particularly in sensitive primary cells.
- Dose & Duration Optimization: Perform a detailed time and dose-response matrix. Use the lowest effective dose for the shortest duration possible to achieve target engagement (measured by reduction of p-eIF2α).
- Alternative Compounds: Consider the newer, potentially more selective PERK inhibitor AMG PERK 44, or use genetic tools (siRNA/shRNA) to validate phenotypes observed with pharmacology.
- Cell Death Analysis: Distinguish between apoptosis (caspase-3/7 activation, Annexin V) and other forms of cell death to understand the mechanism.
Experimental Protocols
Protocol 1: Quantifying IRE1α RNase Activity via XBP1 Splicing Assay (RT-qPCR) Purpose: To measure the efficacy of IRE1 RNase inhibitors or activators.
- Cell Treatment: Seed cells in a 12-well plate. Pre-treat with compound or DMSO vehicle for 1 hour, then co-treat with/without ER stress inducer (e.g., 2 μg/mL Tunicamycin) for 4-6 hours.
- RNA Extraction: Harvest cells using TRIzol reagent, following the manufacturer's protocol. Quantify RNA.
- cDNA Synthesis: Use 1 μg of total RNA with a reverse transcription kit, employing random hexamers.
- qPCR Analysis: Design primers that flank the 26-base intron in unspliced XBP1 (uXBP1). Use a SYBR Green master mix.
- Primer Pair: Forward: 5'-CCTGGTTGCTGAAGAGGAGG-3'; Reverse: 5'-CCATGGGAAGATGTTCTGGG-3'.
- Cycling Conditions: 95°C for 3 min, followed by 40 cycles of 95°C for 10 sec and 60°C for 30 sec. Include a melt curve.
- Data Analysis: The PCR product from unspliced XBP1 is 289 bp, and from spliced XBP1 (sXBP1) is 263 bp. They can be distinguished by melt curve analysis or gel electrophoresis. Calculate the sXBP1/uXBP1 ratio normalized to the DMSO control.
Protocol 2: Assessing PERK Pathway Activation by Immunoblot Purpose: To evaluate PERK inhibitor/activator effects on the PERK-eIF2α-ATF4 axis.
- Cell Lysis: Treat cells in a 6-well plate. Wash with PBS and lyse directly in 150-200 μL of 1X Laemmli buffer supplemented with 1x protease and phosphatase inhibitors.
- Sample Preparation: Boil lysates at 95°C for 10 minutes. Sonicate briefly to shear DNA. Centrifuge at 16,000 x g for 10 min.
- Immunoblotting: Load 15-20 μL of supernatant per lane on a 4-12% Bis-Tris protein gel. Transfer to PVDF membrane.
- Antibody Probing: Probe with the following primary antibodies (diluted in 5% BSA/TBST):
- Phospho-eIF2α (Ser51) (1:1000)
- Total eIF2α (1:2000)
- ATF4 (1:1000)
- β-Actin (1:5000) - loading control
- Detection: Use appropriate HRP-conjugated secondary antibodies and chemiluminescent substrate. Quantify band intensity; express p-eIF2α as a ratio to total eIF2α.
Data Presentation
Table 1: Representative Small Molecule Modulators of UPR Sensors
| Sensor | Compound Name | Mode of Action | Reported IC₅₀ / EC₅₀ | Key Use & Notes |
|---|---|---|---|---|
| IRE1 | 4μ8C | RNase Inhibitor | ~5-10 μM (cell-free) | Tool inhibitor for XBP1 splicing; solubility limited. |
| MKC-3946 | RNase Inhibitor | ~0.1-0.5 μM (cellular) | More potent cellular inhibitor than 4μ8C. | |
| IXA04 | Activator (Non-stress) | ~3 μM (cellular) | Allosterically activates IRE1 RNase. | |
| PERK | GSK2606414 | ATP-competitive Inhibitor | ~0.4 nM (kinase) | Potent tool inhibitor; can be cytotoxic at high doses. |
| AMG PERK 44 | ATP-competitive Inhibitor | N/A | Reported improved selectivity profile. | |
| CCT020312 | Activator | ~3.5 μM (cellular) | Direct PERK activator, induces eIF2α phosphorylation. | |
| ATF6 | AA147 | Activator (Covalent) | ~10-20 μM (cellular) | Activates ATF6 via proteostasis reprogramming. |
| Ceapins | Inhibitor | ~0.5-2 μM (cellular) | Blocks ATF6 cleavage by inhibiting Site-1 Protease traffic. | |
| Compound 263 | Activator | N/A | Novel activator identified from HTS. |
Table 2: Common ER Stressors for UPR Pathway Validation
| Stressor | Primary Target / Mechanism | Typical Working Concentration | Key Application |
|---|---|---|---|
| Tunicamycin | N-linked Glycosylation Inhibitor | 1 - 5 μg/mL | Strong inducer of all three UPR arms; used for IRE1/XBP1 splicing assays. |
| Thapsigargin | SERCA Pump Inhibitor (Ca²⁺ depletion) | 0.1 - 1 μM | Potent inducer of all three UPR arms; fast and reversible (at low doses). |
| DTT | Reductant (Disrupts disulfide bonds) | 1 - 5 mM | Induces ER protein misfolding; often used for shorter treatments. |
| Brefeldin A | Disrupts ER-Golgi Transport | 5 - 10 μg/mL | Induces ER stress via protein backlog; useful for ATF6 studies. |
Mandatory Visualizations
Diagram Title: UPR Sensor Signaling Pathways
Diagram Title: Workflow for Screening UPR Modulators
The Scientist's Toolkit: Research Reagent Solutions
Table 3: Essential Reagents for UPR Sensor Modulation Studies
| Reagent Category | Specific Item | Function & Application |
|---|---|---|
| ER Stress Inducers | Tunicamycin (from S. lycoperiscum) | Induces ER stress by inhibiting N-linked glycosylation, activating all UPR arms. Essential for positive controls. |
| Thapsigargin | Non-competitive inhibitor of SERCA pumps, causing ER calcium depletion and potent UPR induction. | |
| Cell Lines | WT and IRE1α/PERK/ATF6 KO MEFs (or other cells) | Isogenic paired cell lines are critical for validating the specificity of pharmacological modulators and phenotypes. |
| Reporter Systems | ARE-Luciferase Reporter Plasmid | Firefly luciferase under an ER stress response element (ERSE) promoter for monitoring ATF6 and general UPR activity. |
| XBP1s-GFP Reporter (pEGFP-XBP1s) | Visualizes IRE1 RNase activity via GFP expression upon XBP1 splicing. | |
| Key Antibodies | Anti-phospho-eIF2α (Ser51) | Detects activation of the PERK pathway and integrated stress response (ISR). |
| Anti-ATF4 | Readout for downstream PERK/ISR signaling. Requires care due to short protein half-life. | |
| Anti-sXBP1 (Clone Q3-1F6) | Specific antibody for detecting the spliced, active form of XBP1 protein. | |
| Critical Assay Kits | Homogeneous Caspase-3/7 Assay Kit (Luminescent) | Quantifies apoptosis, a critical endpoint for evaluating chronic UPR inhibition or excessive activation. |
| BCA or Bradford Protein Assay Kit | Essential for normalizing protein loads in immunoblot experiments. | |
| Compound Solvents & Controls | Molecular Biology Grade DMSO | Universal solvent for small molecule modulators. Must be used at minimal final concentration (<0.5%). |
| High-Purity Cell Culture Grade Water | For reconstituting compounds or preparing buffers; avoids unintentional cellular stress. |
Gene Therapy and CRISPR-Based Strategies to Enhance ER Folding Capacity
Technical Support Center: Troubleshooting & FAQs
Thesis Context: This support center provides practical guidance for researchers developing gene and CRISPR-based interventions to address protein misfolding and ER stress in eukaryotic systems for therapeutic applications.
Frequently Asked Questions (FAQs)
Q1: My CRISPR-edited cell line shows successful knock-in of the target chaperone gene (e.g., BiP/GRP78), but I do not observe a measurable reduction in ER stress markers (XBP1 splicing, CHOP expression). What could be wrong? A: This is a common issue. Possible causes and solutions:
- Insufficient Protein Expression: Confirm at the protein level (via Western blot) that your edited gene is producing functional protein. The promoter used may not be strong enough in your specific cell type. Consider screening stronger or inducible promoters.
- Saturation Point Reached: The endogenous ER folding machinery might already be saturated or the misfolded protein burden may be too high for a single chaperone to resolve. Consider combinatorial strategies (e.g., co-expressing a chaperone and an ERAD component).
- Off-Target Effects: CRISPR off-target edits could be disrupting other components of the UPR. Perform whole-genome sequencing or use GUIDE-seq to assess off-targets.
- Incorrect Readout Timing: ER stress resolution is dynamic. Perform a time-course experiment post-induction of stress to capture the effect.
Q2: During AAV-mediated gene delivery of protein disulfide isomerase (PDI), I observe high cellular toxicity. How can I mitigate this? A: Toxicity often stems from overexpression or immune responses.
- Titrate Vector Dose: Perform a detailed MOI (Multiplicity of Infection) curve. The therapeutic window may be narrow.
- Use a Cell-Type Specific Promoter: Switch from a strong universal promoter (like CMV) to a cell-specific or moderate-strength promoter to avoid overexpression.
- Check PDI Activity: Ensure the delivered PDI variant is functional but not hyperactive, as this can disrupt redox balance. Consider using redox-inactive mutants as controls.
- Purify Vector: Ensure AAV prep is free from empty capsids and cellular contaminants, which can trigger innate immune responses.
Q3: My qPCR data for spliced XBP1 is inconsistent after CRISPRa-mediated upregulation of ER chaperones. What are the best practices for reliable UPR measurement? A: UPR markers are transient and sensitive.
- Harvest Timing: Spliced XBP1 (XBP1s) peaks 2-6 hours post-stress induction. Optimize harvest time.
- Use Multiple Assays: Corroborate qPCR data with a protein-level assay (e.g., Western blot for XBP1s or ATF6 cleavage) and a functional assay (e.g., ERSE-luciferase reporter).
- Proper Controls: Always include a well-characterized positive control (e.g., cells treated with 2µg/mL tunicamycin for 4 hours) and negative control (unstressed cells).
- RNA Integrity: Ensure high-quality RNA extraction, as UPR transcripts can degrade rapidly.
Q4: When using a lentiviral CRISPRi system to knock down PERK, my cells undergo apoptosis rapidly even under basal conditions. How can I study PERK inhibition without this effect? A: Complete PERK loss can be cytotoxic due to loss of basal protein quality control.
- Use Inducible Systems: Employ a doxycycline-inducible CRISPRi system to allow initial cell expansion without knockdown.
- Partial/Transient Inhibition: Optimize sgRNA efficiency to achieve partial, not complete, knockdown. Alternatively, use a small molecule PERK inhibitor (e.g., GSK2606414) for short, pulsed treatments.
- Complement with Rescue: Design an experiment where you simultaneously express a CRISPRi-resistant wild-type or mutant PERK cDNA to confirm phenotype specificity.
Troubleshooting Guides
Issue: Low Efficiency of HDR for CRISPR-Mediated Chaperone Gene Knock-In
| Possible Cause | Diagnostic Test | Solution |
|---|---|---|
| Inefficient sgRNA | Check indel % via T7E1 or NGS | Re-design sgRNA with high on-target, low off-target scores. |
| Low Donor Template Concentration | PCR for donor vector in cells | Increase donor DNA amount; use single-stranded DNA (ssODN) donors for small inserts. |
| Poor HDR in Target Cell Type | Measure baseline HDR with a reporter | Use HDR-enhancing agents (e.g., RS-1, Scr7) or switch to NHEJ-based knock-in strategies (e.g., CRIS-PITCh). |
| Toxicity from Double-Strand Breaks | Check cell viability 24h post-transfection | Reduce Cas9/sgRNA amount; use high-fidelity Cas9 variants. |
Issue: Inadequate Transduction with Viral Vectors for Gene Therapy Constructs
| Possible Cause | Diagnostic Test | Solution |
|---|---|---|
| Low Viral Titer | Re-titer viral stock (physical/genomic titer) | Concentrate virus via ultracentrifugation or use fresh preparation. |
| Lack of Cellular Receptor | Check literature for receptor expression | Pseudotype virus with a different serotype (e.g., AAVrh10, VSV-G for lentivirus). |
| Silencing of Viral Promoter | Check expression over 2-4 weeks | Use insulating elements (e.g., cHS4), switch to a cellular or synthetic promoter. |
| Host Antiviral Response | Check IFN-responsive gene expression (e.g., ISG15) | Use lower MOI; consider adding a histone deacetylase inhibitor (e.g., valproic acid) transiently. |
Key Experimental Protocols
Protocol 1: Evaluating ER Folding Capacity via a Secreted Reporter Protein (SEAP Assay)
- Principle: Secreted embryonic alkaline phosphatase (SEAP) activity in media correlates with functional ER/Golgi trafficking.
- Steps:
- Co-transfect cells with your therapeutic gene/CRISPR construct and a SEAP reporter plasmid.
- 48-72 hours post-transfection, collect cell culture supernatant.
- Centrifuge supernatant to remove debris.
- Heat-inactivate samples at 65°C for 30 min (to inactivate endogenous phosphatases).
- Incubate with SEAP assay substrate (e.g., pNPP) in diethanolamine buffer.
- Measure absorbance at 405 nm. Normalize to total cellular protein or a co-transfected constitutively active luciferase control.
- Troubleshooting: Include tunicamycin-treated controls (should lower SEAP signal) and cells overexpressing a known chaperone like BiP (should increase signal under stress).
Protocol 2: Validating CRISPR-Mediated UPR Gene Activation (CRISPRa)
- Principle: Use dCas9-VPR fusion targeted to endogenous gene promoters.
- Steps:
- Stable Line Generation: Lentivirally transduce target cells with dCas9-VPR. Select with puromycin.
- sgRNA Design: Design -3 sgRNAs targeting within -200 to +100 bp of the transcription start site (TSS) of the target gene (e.g., HSPA5 for BiP).
- Delivery: Transfect stable dCas9-VPR cells with sgRNA(s) via lentivirus or transfection.
- Validation (72h post):
- mRNA: qRT-PCR for target gene.
- Protein: Western blot for target protein (e.g., BiP).
- Functional: Challenge cells with ER stressor (e.g., 300 nM thapsigargin, 2 µg/mL tunicamycin). Measure cell viability (MTS assay) and specific UPR markers (XBP1 splicing) compared to non-targeting sgRNA control.
The Scientist's Toolkit: Research Reagent Solutions
| Reagent / Material | Primary Function in ER Folding Research |
|---|---|
| Tunicamycin | N-linked glycosylation inhibitor; induces ER stress by preventing proper protein folding. |
| Thapsigargin | SERCA pump inhibitor; depletes ER calcium stores, inducing ER stress. |
| GSK2606414 | Potent and selective PERK kinase inhibitor; used to block the PERK arm of the UPR. |
| 4-Phenylbutyric Acid (4-PBA) | Chemical chaperone that improves ER folding capacity and reduces ER stress. |
| ssODN (single-stranded oligodeoxynucleotide) | Donor template for precise CRISPR/Cas9-mediated HDR knock-in of chaperone genes or tags. |
| AAV Serotype Libraries (e.g., AAV1, AAV2, AAV5, AAV8, AAV9, AAVrh10) | For screening optimal gene delivery vectors to specific eukaryotic tissues (e.g., liver, neuron, muscle). |
| ER-Tracker Dyes (e.g., ER-Tracker Green) | Live-cell imaging dye for visualizing ER morphology and volume changes upon stress or intervention. |
| XBP1 Splicing Reporter (Luciferase) | Plasmid reporter to dynamically monitor IRE1α activation, a core UPR pathway. |
Visualizations
Technical Support & Troubleshooting Center
This resource addresses common experimental challenges in engineering eukaryotic cells for resilience against protein misfolding and ER stress. All content is framed within the broader research goal of mitigating proteotoxic stress in bioproduction and disease modeling.
FAQs & Troubleshooting Guides
Q1: My ALE (Adaptive Laboratory Evolution) experiment for tunicamycin resistance has stalled. The cell population shows no increased viability after 15 serial passages. What could be the issue?
A1: A stalled ALE plateau is common. Key checks:
- Stress Concentration: Verify the ER stressor (e.g., tunicamycin) concentration remains inhibitory but sub-lethal. Use a kill curve to confirm >90% initial lethality. Degradation of the small molecule over the 3-5 day passage cycle can reduce selective pressure. Prepare fresh stocks frequently.
- Population Bottleneck: Ensure your passage seeding density is sufficient to maintain population diversity. Seeding too few cells can lead to genetic drift instead of selective evolution. Maintain a minimum effective population size (Ne) of 1x10^6 cells per passage.
- Adaptation Mechanism: Cells may adapt via "cheater" mutations (e.g., reduced drug uptake) rather than genuine ER stress resilience. Implement an alternating selection protocol (see Table 1) to force genuine proteostasis network adaptation.
Q2: After CRISPR-Cas9 knock-in of a mutant XBP1s variant, my engineered CHO cell line grows slower and shows increased basal apoptosis. How can I validate if this is due to on-target effects or clone-specific artifacts?
A2: This suggests potential dysregulation of the UPR. Follow this validation workflow:
- Isogenic Control: Genotype multiple single-cell clones. Compare growth and apoptosis rates across 5-10 independent clones with the same genotype.
- UPR Reporter Assay: Transfert a UPRE (Unfolded Protein Response Element)-GFP reporter plasmid. Measure basal GFP fluorescence vs. parental cells. Elevated basal signal indicates constitutive UPR activation.
- Rescue Experiment: Use siRNA to transiently knock down your engineered XBP1s gene in the problematic clone. If growth normalizes, the phenotype is on-target. If not, it may be an off-target artifact.
- RNA-Seq: Perform transcriptomic analysis on 3 biological replicates of the clone vs. parental. Look for global dysregulation of UPR target genes (e.g., EDEM1, HERPUD1) and cell cycle genes.
Q3: When measuring secreted recombinant protein titer from my stress-resilient HEK293 line, the yield is high but aggregate formation (visible by SEC-HPLC) has increased. How can I address this?
A3: Enhanced survival can sometimes decouple from quality control. Implement these steps:
- Co-expression of Protein Folding Machinery: Co-transfect or generate a stable line co-expressing the recombinant protein with ER-resident chaperones like PDI (Protein Disulfide Isomerase) or BiP/Grp78. Use a weak, constitutive promoter (e.g., EF1α) for the chaperone to avoid overload.
- Modulate UPR Branches: Constitutive activation of the IRE1α-XBP1s branch may be prioritizing volume over quality. Consider mild, transient pharmacological inhibition of IRE1α's RNase activity (e.g., with 4μ8C) during the protein production phase to rebalance the UPR.
- Lowered Temperature Shift: After inducing protein expression, reduce culture temperature to 31°C. This slows synthesis, allowing the folding machinery to cope. See Table 2 for a sample protocol.
Experimental Protocols
Protocol 1: Alternating Selection ALE for ER Stress Resilience
- Objective: Evolve eukaryotic cells (e.g., CHO-S) to withstand chronic protein misfolding stress.
- Materials: CHO-S cells, DMEM/F-12 medium, Tunicamycin (Tm) stock (1mg/mL in DMSO), Dithiothreitol (DTT) stock (1M), 6-well plates, T-flasks.
- Method:
- Seed cells at 2x10^5 cells/mL in 6-well plates (2mL/well). Incubate at 37°C, 5% CO2.
- Cycle 1 (Tm Stress): Add Tm to a final concentration of 2ng/mL (determined from prior kill curve). Passage cells every 3-4 days, maintaining Tm concentration.
- Cycle 2 (DTT Stress): After 5 passages under Tm, switch selective agent to 0.5mM DTT for 3 passages. This prevents adaptation to a single stressor's mechanism.
- Repeat Cycles: Alternate between Tm and DTT every 3-5 passages for a total of 40-60 passages.
- Clone Isolation: After evolution, isolate single-cell clones by limiting dilution. Screen clones for viability under 5ng/mL Tm challenge (48-hour assay).
- Cryopreservation: Archive intermediate populations (e.g., every 10 passages) for retrospective analysis.
Protocol 2: Validating ER Stress Resilience via Luciferase-Based UPR Reporter Assay
- Objective: Quantitatively compare UPR activation dynamics between parental and engineered cell lines.
- Materials: Parental & engineered cell lines, UPRE-luciferase reporter plasmid (e.g., pGL4.37), Renilla luciferase control plasmid (pRL-TK), transfection reagent, Dual-Luciferase Reporter Assay System, Tm, microplate reader.
- Method:
- Seed 5x10^4 cells/well in a 96-well plate. Incubate for 24h.
- Co-transfect each well with 100ng UPRE-firefly luciferase plasmid and 10ng Renilla luciferase control plasmid using appropriate transfection reagent.
- 24h post-transfection, treat cells with a gradient of Tm (0, 1, 2, 5 ng/mL) in triplicate.
- At 6h and 24h post-treatment, lyse cells and measure firefly and Renilla luciferase activity using the Dual-Luciferase Assay kit per manufacturer instructions.
- Calculate normalized UPR activity: Firefly Luminescence / Renilla Luminescence for each well.
- Plot normalized luciferase activity vs. Tm concentration. A rightward shift in the dose-response curve indicates higher ER stress resilience (i.e., more stress required to activate the UPR to the same level).
Data Presentation
Table 1: Comparison of ALE Strategies for ER Stress Resilience
| ALE Strategy | Selective Agent | Typical Duration | Key Outcome Phenotype | Common Identified Mutations | Primary Advantage |
|---|---|---|---|---|---|
| Chronic Single Stressor | Tunicamycin (2-5 ng/mL) | 40-60 passages | Reduced apoptosis under Tm; Slower growth | SEL1L (ERAD), BIP promoter | Simple protocol; Strong directional selection. |
| Alternating Stressors | Tm (2 ng/mL) / DTT (0.5 mM) | 50-70 passages | Broad resilience to diverse ER stressors; Stable growth | XBP1, ATF6, ER chaperones | Prevents "cheater" mutations; Broadens resilience. |
| Increasing Ramp | Tm (1 → 10 ng/mL) | 30-50 passages | High-level resistance to Tm; Possible trade-offs in protein secretion | RPN1 (Proteasome), Glycosylation enzymes | Rapid evolution of high-level resistance. |
Table 2: Post-Engineering Production Optimization for Protein Quality
| Intervention | Protocol | Effect on Titer | Effect on Aggregates | Recommended Use Case |
|---|---|---|---|---|
| Chaperone Co-expression | Stable integration of PDIA1 via piggyBac transposon. | +10% to +30% | -15% to -40% (by SEC) | High-value proteins with complex disulfide bonding. |
| IRE1α Inhibition | Add 50μM 4μ8C at time of protein induction. | -20% to -40% | -50% to -70% (by SEC) | Proteins prone to severe aggregation; Research on UPR branches. |
| Temperature Shift | Reduce from 37°C to 31°C for 48h post-induction. | ±0% to +15% | -10% to -25% (by SEC) | Standard first-step optimization; Low-risk. |
Diagrams
The Scientist's Toolkit: Research Reagent Solutions
| Reagent / Material | Supplier Examples | Function in ER Stress / ALE Research |
|---|---|---|
| ER Stress Inducers | Sigma-Aldrich, Cayman Chemical | Pharmacologically induce defined ER stress to apply selection pressure or challenge engineered cells. Tunicamycin (N-glycosylation inhibitor), Dithiothreitol (DTT) (reductive disruptor of disulfide bonds), Thapsigargin (SERCA inhibitor). |
| UPR Reporter Plasmids | Addgene, Promega | Quantitatively measure activation of specific UPR branches. pGL4.37[luc2P/UPRE/Hygro] (IRE1-XBP1 branch), p5xATF6-GL3 (ATF6 branch). Essential for validating evolutionary outcomes. |
| Dual-Luciferase Reporter Assay System | Promega | Gold-standard kit for normalizing transcriptional reporter (e.g., UPRE) activity to transfection efficiency using Renilla luciferase control. |
| CRISPR-Cas9 System | Integrated DNA Technologies (IDT), Synthego | For precise host cell line engineering. Knock-in of beneficial alleles (e.g., constitutive XBP1s), knock-out of negative regulators (e.g., CHOP). |
| ER-Tracker Dyes | Thermo Fisher Scientific | Live-cell imaging dyes (e.g., ER-Tracker Green) to visualize ER morphology and volume changes in stress-resilient vs. parental cells. |
| Annexin V Apoptosis Detection Kits | BioLegend, BD Biosciences | Measure apoptotic cells via flow cytometry to quantify the protective effect of evolved or engineered traits against ER stress-induced cell death. |
| Next-Generation Sequencing Services | Illumina, Novogene | Whole Genome Sequencing (WGS) to identify mutations accumulated during ALE. RNA-Seq to profile transcriptomic changes and UPR gene expression. |
Technical Support Center: Troubleshooting Protein Folding & ER Stress in Bioreactors
Frequently Asked Questions (FAQs) & Troubleshooting Guides
Q1: My recombinant protein titer is high, but the percentage of active, correctly folded protein is low. What bioreactor parameters should I investigate first? A: This is a classic sign of ER overload and insufficient folding capacity. Prioritize investigating:
- Temperature: Shift to a lower cultivation temperature (e.g., 30-33°C for mammalian cells) to slow translation and improve folding fidelity.
- pH: Maintain tight control at the optimal physiological range (typically pH 7.0-7.4). Fluctuations disrupt disulfide bond formation and chaperone function.
- Dissolved Oxygen (DO): Avoid hypoxia (<20% air saturation) which induces oxidative stress, and hyperoxia (>80%) which can generate reactive oxygen species, both disrupting ER homeostasis.
Q2: Which media supplements are most effective for alleviating ER stress in CHO cell cultures, and when should they be added? A: Supplements should be added at the time of induction or during the exponential production phase. Key supplements include:
- Chemical Chaperones: 4-Phenylbutyrate (4-PBA) or Trimethylamine N-oxide (TMAO) to stabilize protein folding intermediates.
- Redox Modulators: Reduced Glutathione (GSH) or Cysteamine to bolster the reducing environment of the ER for disulfide bond management.
- ER Stress Inhibitors: Salubrinal (a selective eIF2α phosphatase inhibitor) to enhance the adaptive unfolded protein response (UPR) and reduce apoptosis.
Q3: I suspect activation of the apoptotic UPR pathway. How can I monitor this via bioreactor sampling? A: Implement regular sampling for specific ER stress markers:
- qPCR: Measure splicing of XBP1 mRNA (indicator of IRE1 activation).
- Western Blot: Monitor phosphorylation of PERK (p-PERK) and its downstream target eIF2α (p-eIF2α), and cleavage of ATF6.
- ELISA/Flow Cytometry: Measure CHOP (a pro-apoptotic transcription factor) expression or caspase-3/7 activity in the cell population.
Q4: My fed-batch process shows a sudden drop in viability post-induction. Could this be due to ER stress? A: Yes, a rapid viability drop often indicates a maladaptive UPR and ER-associated degradation (ERAD) overload. Troubleshoot with:
- Osmolality Check: High osmolality from nutrient feeds can induce ER stress. Optimize feed strategy to maintain osmolality <400 mOsm/kg.
- Byproduct Analysis: Accumulation of lactate and ammonia exacerbates ER stress. Modify feeding to reduce their generation.
- Supplement Timing: Pre-emptively add ER stress-reducing supplements (see Q2) 12-24 hours before induction to prime the cellular folding machinery.
Experimental Protocols for Key Cited Experiments
Protocol 1: Evaluating the Effect of Temperature Shift on ER Load Objective: To determine the optimal post-induction temperature for reducing misfolded protein aggregation.
- Inoculate parallel bioreactors with your eukaryotic production cell line (e.g., CHO-S).
- Grow cultures at standard temperature (37°C) to mid-exponential phase.
- Induce protein expression (e.g., with doxycycline or temperature shift for yeast).
- Immediately apply temperature shifts: Condition A: 37°C (control), B: 33°C, C: 30°C.
- Sample every 12 hours for 96 hours post-induction.
- Analyze samples for: A) Total protein titer (ELISA), B) Active protein fraction (specific activity assay), C) ER stress marker BiP/GRP78 (Western blot), D) Cell viability.
Protocol 2: Testing Media Supplements for UPR Modulation Objective: To quantify the impact of chemical chaperones on specific UPR signaling branches.
- Set up shake flask cultures in triplicate.
- At induction, supplement media with:
- Flask 1: Control (no supplement).
- Flask 2: 5 mM 4-Phenylbutyrate (4-PBA).
- Flask 3: 1 mM Salubrinal.
- Flask 4: 3 mM Reduced Glutathione.
- Harvest cells 48 hours post-induction.
- Lyse cells and perform:
- RT-qPCR for XBP1 splicing: Calculate the ratio of spliced XBP1 (sXBP1) to total XBP1.
- Western Blot: Probe for p-eIF2α, ATF6, and CHOP.
- Titer Analysis: Measure total and active protein yield.
Summarized Quantitative Data
Table 1: Impact of Bioreactor Conditions on ER Stress Markers and Protein Quality
| Condition | Viable Cell Density (x10^6 cells/mL) | Specific Productivity (pg/cell/day) | Active Protein Fraction (%) | sXBP1/tXBP1 Ratio (%) | CHOP Expression (Fold vs Control) |
|---|---|---|---|---|---|
| Control (37°C) | 8.5 | 25 | 45 | 35 | 1.0 |
| Low Temp (33°C) | 9.2 | 22 | 68 | 15 | 0.4 |
| + 5mM 4-PBA | 8.8 | 24 | 75 | 12 | 0.3 |
| + 1mM Salubrinal | 7.9 | 21 | 58 | 8 | 0.1 |
| DO Shift (30% to 60%) | 7.5 | 18 | 40 | 55 | 2.5 |
Table 2: Efficacy of Media Supplements in Alleviating ER Stress
| Supplement (Optimal Dose) | Primary Mechanism | Effect on UPR Pathway | Typical Viability Increase | Key Trade-off/Consideration |
|---|---|---|---|---|
| 4-PBA (2-5 mM) | Chemical chaperone, HDAC inhibitor | Downregulates all three sensors | +10-15% | Can be cost-prohibitive at large scale |
| TMAO (1-3 mM) | Chemical chaperone, stabilizes native state | Reduces IRE1 & PERK signaling | +5-10% | May require optimization for cell type |
| Salubrinal (0.5-1 µM) | Inhibits eIF2α dephosphorylation | Enhances adaptive PERK, inhibits apoptosis | +15-20% | Can reduce overall translation rate |
| Reduced Glutathione (1-3 mM) | Augments redox buffer capacity | Facilitates disulfide bonding, reduces oxidative UPR | +5-8% | Unstable in solution; add daily |
| Tauroursodeoxycholic Acid (TUDCA, 0.5 mg/mL) | Bile acid, stabilizes protein conformation | Inhibits apoptosis downstream of ER stress | +10-12% | Purification interference possible |
The Scientist's Toolkit: Research Reagent Solutions
| Item | Function in ER Stress Research |
|---|---|
| Thapsigargin | SERCA pump inhibitor; used as a positive control to induce severe, reproducible ER stress. |
| Tunicamycin | N-glycosylation inhibitor; induces ER stress by blocking protein maturation, used to activate the UPR. |
| 4-Phenylbutyrate (4-PBA) | Chemical chaperone and HDAC inhibitor; reduces protein aggregation and facilitates folding. |
| Salubrinal | Selective inhibitor of eIF2α dephosphorylation; promotes cell survival under ER stress. |
| Anti-BiP/GRP78 Antibody | Key marker for ER chaperone upregulation; indicates UPR activation via all three sensors. |
| Anti-CHOP (DDIT3) Antibody | Marker for the pro-apoptotic arm of the UPR; indicates transition to irreversible ER stress. |
| XBP1 Splicing Assay Kit | Allows precise measurement of IRE1α activity, a key event in the adaptive UPR. |
| Caspase-3/7 Activity Assay | Quantifies apoptosis initiation, a critical endpoint of maladaptive ER stress. |
Visualizations
Diagram 1: Core UPR Signaling Pathways Under ER Stress
Diagram 2: Bioreactor Optimization Workflow to Reduce ER Load
Navigating Challenges: Pitfalls and Optimization in ER Stress Research and Therapy
Technical Support Center: Troubleshooting & FAQs
Q1: My RT-PCR for XBP1 splicing shows a product size different from the expected 26bp shift. What could be wrong?
A: This is a common artifact. The expected shift is from 289bp (unspliced, uXBP1) to 263bp (spliced, sXBP1) with standard primers. Deviations indicate:
- Primer Dimer or Non-Specific Amplification: Optimize annealing temperature (55-65°C gradient) and use a hot-start polymerase.
- Incomplete Digestion with PstI: The PstI restriction enzyme digest is often used to distinguish isoforms (sXBP1 is cut, uXBP1 is not). Ensure enzyme is active and digest for at least 2 hours.
- Contaminated RNA/cDNA: Perform a DNase I treatment step on your RNA. Include a no-reverse-transcriptase (-RT) control.
Q2: I observe high CHOP (DDIT3) protein expression even in my untreated control cells. Is this normal?
A: Persistent high basal CHOP is an artifact suggesting chronic, low-level ER stress in your cell culture system.
- Troubleshooting Steps:
- Check Serum: Use freshly thawed, low-endotoxin serum. High glucose or nutrient deprivation can induce stress.
- Cell Density: Avoid over-confluence or extreme low density at harvest.
- Transfection Stress: If using transfected cells, include an empty vector control and harvest 24-48 hours post-transfection, not later.
- Mycoplasma Contamination: Test your cells. Mycoplasma infection is a major cause of chronic ER stress.
Q3: My BiP (GRP78) immunoblot shows multiple bands. Which one is correct?
A: BiP can show non-specific bands or post-translationally modified forms.
- Solution: Run a positive control (e.g., Tunicamycin-treated cell lysate). The predominant correct band is ~78 kDa. Use a validated antibody (see Toolkit). Optimize antibody concentration and include a peptide blockade control to confirm specificity.
Q4: My XBP1 splicing assay and CHOP reporter assay give contradictory results after drug treatment. Which should I trust?
A: This indicates a possible artifact in assay timing or specificity.
- Analysis: XBP1 splicing is an early, transient event (peaks 1-4 hours). CHOP induction is later and sustained (8-24 hours). Ensure you are comparing time-matched samples. The drug may also activate pathways independent of the canonical PERK-CHOP axis.
Experimental Protocols
Protocol 1: Validating XBP1 Splicing by RT-PCR & PstI Digest
- RNA Isolation: Extract total RNA using a column-based kit with on-column DNase I treatment. Elute in nuclease-free water.
- cDNA Synthesis: Use 500 ng - 1 µg RNA with a reverse transcriptase and oligo(dT) or random primers in a 20 µL reaction.
- PCR Amplification:
- Primers (human): Forward: 5'-CCTTGTAGTTGAGAACCAGG-3', Reverse: 5'-GGGGCTTGGTATATATGTGG-3'
- Cycling Conditions: 94°C 3 min; 35 cycles of (94°C 30s, 55°C 30s, 72°C 30s); 72°C 5 min.
- PstI Digestion: Purify PCR product. Incubate half with PstI (10 U) in appropriate buffer at 37°C for 2-4 hours.
- Analysis: Run undigested and digested samples on a 2.5-3% agarose gel. sXBP1 is cut (yields two fragments), uXBP1 remains intact.
Protocol 2: Quantifying ER Stress Markers by Immunoblot
- Lysate Preparation: Lyse cells in RIPA buffer with fresh protease/phosphatase inhibitors. Centrifuge at 14,000g for 15 min at 4°C. Determine protein concentration.
- Gel Electrophoresis: Load 20-40 µg protein on a 4-12% Bis-Tris polyacrylamide gel.
- Transfer & Blocking: Transfer to PVDF membrane. Block with 5% non-fat milk in TBST for 1 hour.
- Antibody Incubation:
- Primary Antibodies: Dilute in blocking buffer. Incubate overnight at 4°C.
- CHOP (1:1000), BiP (1:2000), β-Actin (1:5000).
- Secondary Antibodies: HRP-conjugated anti-species IgG (1:5000), 1 hour at RT.
- Primary Antibodies: Dilute in blocking buffer. Incubate overnight at 4°C.
- Detection: Use enhanced chemiluminescence (ECL) substrate and image.
Table 1: Common Artifacts and Resolutions in ER Stress Assays
| Assay | Common Artifact | Possible Cause | Recommended Solution |
|---|---|---|---|
| XBP1 Splicing | No band or smearing | RNA degradation, poor PCR efficiency | Check RNA integrity (RIN >8), optimize PCR cycles. |
| XBP1 Splicing | Incomplete PstI digest | Inactive enzyme, wrong buffer | Use fresh enzyme, include a control DNA digest. |
| CHOP Immunoblot | High basal expression | Cell culture stress, mycoplasma | Use low-passage cells, test for mycoplasma. |
| BiP Immunoblot | Multiple non-specific bands | Antibody cross-reactivity | Titrate antibody, use a knockout lysate control. |
| Reporter Assay | High control luminescence | Constitutive promoter activity | Use inducible system, sequence verify construct. |
Table 2: Expected Molecular Weights & Dynamics of Key ER Stress Markers
| Marker | Gene | Protein Size (kDa) | Key Inducer | Time to Peak Induction* |
|---|---|---|---|---|
| BiP | HSPA5 | ~78 | Tunicamycin, Thapsigargin | 8-16 hours |
| sXBP1 | XBP1 | ~55 (spliced) | Tunicamycin, DTT | 2-4 hours |
| CHOP | DDIT3 | ~27 | Tunicamycin, Thapsigargin | 8-24 hours |
*In mammalian cell lines (e.g., HEK293, HeLa) treated with 2 µg/mL Tm or 300 nM Tg.
Pathway & Workflow Diagrams
The Scientist's Toolkit: Research Reagent Solutions
| Item | Function & Application in ER Stress Research |
|---|---|
| Tunicamycin | N-linked glycosylation inhibitor. Classic, potent inducer of ER stress via disruption of protein folding. Used as a positive control. |
| Thapsigargin | Sarco/endoplasmic reticulum Ca2+ ATPase (SERCA) inhibitor. Depletes ER calcium stores, inducing stress. |
| Dithiothreitol (DTT) | Reducing agent. Causes ER stress by disrupting disulfide bond formation within the ER lumen. |
| 4μ8C | Selective IRE1α RNase inhibitor. Used to specifically block the IRE1-XBP1 arm of the UPR. |
| ISRIB | Integrated Stress Response inhibitor. Reverses eIF2α phosphorylation effects, used to study the PERK-CHOP pathway. |
| Validated Anti-BiP Antibody | For immunoblot/IF. Critical for specific detection of the ~78kDa GRP78 protein without cross-reactivity. |
| PstI Restriction Enzyme | Used in the classic XBP1 splicing assay to differentiate between unspliced (uncut) and spliced (cut) PCR products. |
| Dual-Luciferase Reporter Assay | System for quantifying ATF4 or CHOP promoter activity. Normalization with Renilla luciferase controls for transfection efficiency. |
Off-Target Effects and Toxicity Concerns with UPR-Targeting Compounds
Troubleshooting & FAQ Guide
Q1: Our cell viability assays show significant cytotoxicity upon IRE1α RNase inhibitor (e.g., 4μ8C) treatment, even at low doses, which contradicts published literature. What could be the cause? A: This is a common off-target effect. While 4μ8C specifically inhibits IRE1α's RNase activity, at higher concentrations or in certain cell lines, it can disrupt other cellular RNase functions or induce ER calcium leakage. Troubleshooting Steps:
- Dose Titration: Perform a full dose-response curve (0.1 μM to 100 μM) across 72 hours. Cytotoxicity often appears >30 μM.
- Control Validation: Use a PERK inhibitor (e.g., GSK2606414) or ATF6α inhibitor (e.g., Ceapins) in parallel. If toxicity is unique to IRE1α inhibition, it may be pathway-specific.
- Assay Interference: Confirm results with two distinct viability assays (e.g., ATP-based luminescence and resazurin reduction).
- Cell Line Check: Some cancer lines (e.g., multiple myeloma) are exquisitely dependent on IRE1α signaling; its inhibition alone triggers apoptosis.
Q2: We observe activation of stress pathways (e.g., p38 MAPK phosphorylation) unrelated to the UPR after treatment with a PERK activator. Is this a known off-target effect? A: Yes. Many PERK-targeting compounds, like the activator CCT020312, can induce integrated stress response (ISR) and oxidative stress, leading to p38/JNK activation. This is often compound-specific, not pathway-specific. Protocol to Confirm: Perform western blotting for p-PERK, p-eIF2α, ATF4, and CHOP alongside p-p38 and p-JNK at 2, 4, 8, and 24 hours post-treatment. Use a positive control for ER stress (e.g., 2 μM thapsigargin for 6h) and oxidative stress (e.g., 200 μM H₂O₂ for 1h). The kinetic overlap will indicate crosstalk.
Q3: Our in vivo study of an ATF6α activator showed liver enzyme elevation (ALT/AST) in mice. How do we determine if this is target-mediated or compound toxicity? A: This requires careful dissection. Experimental Protocol:
- Biomarker Analysis: Measure classic ER stress markers (BIP, CHOP) and ATF6α target genes (e.g., Derlin-3, SRP72) in liver tissue via qPCR. Elevated CHOP suggests a pathological UPR.
- Histopathology: Perform H&E staining on liver sections. Target-mediated effects often show steatosis or simple hypertrophy, while compound toxicity may induce necrosis or inflammation.
- Alternative Compound: Test a structurally distinct ATF6α activator (e.g., AA147 vs. compound 147) at an equi-effective dose. If hepatotoxicity is absent, it is likely compound-specific.
Q4: How can we differentiate between adaptive UPR modulation and maladaptive/pro-apoptotic signaling in our high-throughput screen? A: Implement a multiplexed assay workflow. Detailed Protocol:
- Day 1: Seed cells in 384-well plates.
- Day 2: Treat with UPR-targeting compound library (include DMSO and 2μM thapsigargin controls).
- Day 3 (24h post-treatment):
- Assay 1 (Adaptive): Lyse portion of plate for BIP/LUC or XBP1-splicing reporter readout (luminescence/fluorescence).
- Assay 2 (Maladaptive): Fix and stain the same wells for CHOP (immunofluorescence) and nuclei (Hoechst). Image and quantify nuclear CHOP intensity.
- Data Analysis: Calculate a "Therapeutic Index" ratio: (BIP Activity at EC₅₀) / (CHOP Induction at EC₅₀). A ratio >2 suggests a favorable adaptive profile.
Table 1: Common UPR-Targeting Compounds and Documented Off-Target Effects
| Compound (Target) | Primary Mechanism | Common Off-Target Effects | Typical Toxic Concentration (in vitro) | Recommended Validation Experiment |
|---|---|---|---|---|
| 4μ8C (IRE1α RNase) | Inhibits XBP1 splicing | ER Ca²⁺ dysregulation, general RNase inhibition | >30 μM (Cytotoxicity) | Co-treat with IRE1α mRNA siRNA; measure cytosolic Ca²⁺ (Fluo-4 AM dye). |
| GSK2606414 (PERK) | Inhibits PERK kinase | p38 MAPK activation, organ toxicity (pancreas) | >500 nM (Apoptosis) | Use with PERK inhibitor-III (alternative) for comparison; monitor p-eIF2α recovery. |
| ISRIB (eIF2α signaling) | Reverses eIF2α phosphorylation | Inhibits integrated stress response (ISR) broadly | Generally low cytotoxicity | Validate with stress-specific inducers (e.g., arsenite for oxidative stress). |
| Ceapin-A7 (ATF6α) | Inhibits ATF6α cleavage | Minimal reported; can alter Golgi morphology | >10 μM (Non-specific) | Confirm via ATF6α transcriptional reporter and GRP78/BIP secretion assay. |
| AA147 (ATF6α Activator) | Activates ATF6α cleavage | Can induce mild oxidative stress at high doses | >50 μM (Cytotoxicity) | Co-treat with antioxidant (NAC); measure ROS (CellROX Green). |
Table 2: Key Biomarkers for Differentiating On- vs. Off-Target Toxicity
| Assay Type | Adaptive UPR (On-Target) Signature | Maladaptive/Off-Toxic Signature | Assay Platform |
|---|---|---|---|
| Gene Expression (qPCR) | ↑ BIP, ↑ XBP1s, ↑ PDI | ↑ CHOP, ↑ GADD34, ↑ TRB3 | TaqMan assays, RNA-seq |
| Protein Level (Western) | Increased BIP, spliced XBP1 protein | Increased cleaved caspase-3, CHOP, p-JNK | Capillary electrophoresis (e.g., Jess) |
| Viability / Apoptosis | Transient reduction in proliferation | Sustained loss of viability, Annexin V+ cells | Real-time impedance (e.g., xCELLigence) |
| ER Function | Transiently reduced ER Ca²⁺, increased ERAD | Chronic ER Ca²⁺ depletion, ROS accumulation | FRET-based ER-targeted cameleon sensor |
The Scientist's Toolkit: Research Reagent Solutions
| Reagent / Material | Function in UPR/Toxicity Research | Example Product / Catalog Number |
|---|---|---|
| Thapsigargin | Gold-standard ER stress inducer (SERCA pump inhibitor); positive control for UPR activation. | Tocris Bioscience (Cat# 1138) |
| Tunicamycin | N-glycosylation inhibitor; induces ER stress via protein misfolding; positive control. | Sigma-Aldrich (Cat# T7765) |
| 4-Phenylbutyric Acid (4-PBA) | Chemical chaperone that reduces ER stress; used as a rescue agent in toxicity studies. | Merck Millipore (Cat# 525329) |
| CellROX Deep Red Reagent | Fluorogenic probe for measuring reactive oxygen species (ROS), a common off-target effect. | Thermo Fisher Scientific (Cat# C10422) |
| Fluo-4 AM, Cell Permeant | Calcium indicator dye to monitor ER calcium store depletion, linked to IRE1α and toxicity. | Thermo Fisher Scientific (Cat# F14201) |
| XBP1 Splicing Reporter Plasmid | Luciferase-based reporter to specifically monitor IRE1α RNase activity. | Addgene (Plasmid #11976) |
| ATF6 Reporter Plasmid (p5xATF6-GL3) | Luciferase reporter for specific monitoring of ATF6α pathway activation. | Addgene (Plasmid #11976) |
| GRP78/BIP ELISA Kit | Quantifies secreted BIP, a key marker of UPR activation and ER stress burden. | Cell Signaling Technology (Cat# 12105) |
| Caspase-Glo 3/7 Assay | Luminescent assay for caspase-3/7 activity, quantifying apoptosis from maladaptive UPR. | Promega (Cat# G8091) |
Visualization: UPR Pathways and Compound Targets
Visualization: Off-Toxicity Mechanism Analysis Workflow
Balancing Pro-Survival vs. Pro-Apoptotic UPR Signaling in Therapeutic Contexts
Technical Support Center
Troubleshooting Guides & FAQs
Q1: In my UPR reporter assay (e.g., CHOP-luciferase or XBP1-splicing), I am not detecting significant signal induction despite applying a known ER stressor like tunicamycin. What could be wrong? A: This is a common issue. Follow this systematic checklist:
- Cell Line Validation: Ensure your cell line has a functional UPR. Some cancer cell lines have attenuated UPR pathways. Validate with a positive control like HEK293 or MEFs.
- Stress Agent Potency & Stock: Tunicamycin and thapsigargin degrade. Prepare fresh stock solutions in DMSO, aliquot, and store at -20°C. Avoid freeze-thaw cycles. Confirm working concentration (typically 1-5 µg/mL for tunicamycin, 100-300 nM for thapsigargin).
- Timing: The peak of pro-apoptotic CHOP induction occurs later (8-24h) than pro-survival XBP1 splicing (2-8h). Optimize your time-course experiment.
- Reporter Integrity: Re-validate your reporter plasmid by co-transfecting with a constitutive Renilla luciferase or fluorescent protein plasmid for normalization. Check for mycoplasma contamination, which can chronically activate UPR and blunt further response.
Q2: I am trying to pharmacologically inhibit IRE1α's RNase activity (using 4µ8C or STF-083010) to bias signaling toward survival, but my cell viability decreases unexpectedly. Why? A: This paradox highlights the delicate balance of UPR branches.
- Off-target effects: The inhibitor may be affecting other pathways at your concentration. Perform a dose-response (typically 10-100 µM for 4µ8C) and include a vehicle control (DMSO).
- Context-dependent outcome: Chronic, complete IRE1α inhibition can be detrimental as it blocks the adaptive XBP1s arm. Consider partial inhibition or pulsed treatment. Verify inhibition efficacy by monitoring XBP1 splicing via RT-PCR alongside viability assays.
- Compensatory PERK hyperactivation: Inhibiting IRE1α may shift stress signaling to the more pro-apoptotic PERK-CHOP axis. Monitor phospho-eIF2α and CHOP levels when using IRE1α inhibitors.
Q3: When measuring UPR activation via western blot for markers like BiP, phospho-PERK, or CHOP, I get high background or non-specific bands. How can I improve specificity? A:
- Antibody Validation: Use antibodies validated for your specific species and application (e.g., human vs. mouse). Check reputable sources (e.g., Cell Signaling Technology, Abcam) for application notes.
- Sample Preparation: Include both unstressed and stressed samples (e.g., + 2h Thapsigargin) on the same gel to identify stress-inducible bands. Use fresh lysis buffer with appropriate phosphatase and protease inhibitors.
- Blocking and Washing: For phospho-specific antibodies, use 5% BSA in TBST for blocking. Increase wash stringency (more frequent washes, longer duration).
- Positive Control Lysate: Run a commercially available positive control lysate (e.g., from stressed HeLa cells) to confirm antibody performance.
Q4: My goal is to enhance the pro-survival UPR in a disease model. What are the current best-practice strategies for selectively activating ATF6 without过度 activating IRE1α/PERK? A: Selective ATF6 activation is an emerging therapeutic strategy.
- Small Molecule Activators: Compounds like AA147 and 3e are recently described selective ATF6 activating compounds (SRAACs). They covalently modify PDIA1/ERp57, leading to preferential ATF6 activation. See protocol below.
- Low-Dose Stress: Sub-threshold, chronic ER stress can sometimes prime the ATF6 arm. This requires careful titration of a mild stressor like low-dose dithiothreitol (DTT, 0.1-0.5 mM).
- Experimental Protocol - AA147 Treatment:
- Prepare AA147 stock in DMSO at 10 mM.
- Treat cells at a range of 1-20 µM for 6-12 hours.
- Critical: Include a DMSO vehicle control and a parallel sample treated with a pan-stressor (e.g., Tunicamycin 2 µg/mL, 6h) as a positive control for broad UPR activation.
- Assess output via ATF6-target gene reporters (e.g., HSPA5/BiP luciferase) or qPCR for ATF6-specific genes (BiP, HERPUD1) versus IRE1-specific genes (EDEM1, DNAJB9).
Key Experimental Protocols
Protocol 1: Quantifying UPR Branch Activity via Quantitative RT-PCR (qPCR) Objective: To differentially measure the activity of the three UPR branches. Materials: Cells, ER stressor, RNA extraction kit, cDNA synthesis kit, qPCR master mix, primers (see table below). Procedure:
- Seed cells in 6-well plates. At 70-80% confluency, treat with stressor or vehicle.
- At optimal timepoints (e.g., 4h for ATF6/IRE1, 8h for PERK), lyse cells and extract total RNA. DNAse treat the RNA.
- Synthesize cDNA using 500 ng - 1 µg of total RNA.
- Perform qPCR using SYBR Green master mix. Use a stable housekeeping gene (e.g., GAPDH, ACTB) for normalization.
- Calculate fold change using the 2^(-ΔΔCt) method relative to vehicle-treated control.
qPCR Primer Reference Table
| Target Gene | UPR Arm | Function | Forward Primer (5'-3') | Reverse Primer (5'-3') |
|---|---|---|---|---|
| HSPA5 (BiP) | ATF6 / All | Pro-survival chaperone | AGAGGAGGAGGACAAGAAGG | ATCTCGGCACAGTAACAGCA |
| XBP1s | IRE1α | Spliced, active transcription factor | CTGAGTCCGCAGCAGGTG | GTCCATGGGAAGATGTTCTGG |
| CHOP (DDIT3) | PERK | Pro-apoptotic transcription factor | CAGAACCAGCAGAGGTCACA | AGCTGTGCCACTTTCCTTTC |
| EDEM1 | IRE1α | ERAD-associated mannosidase | TGGTGGATGAGGTGGTGAAT | CAGCACACAGTCAGCCAGAT |
| HERPUD1 | ATF6 | ERAD component, stress response | GCTGACCGCTTCATCGTCTA | GGCGGTCAGAGTCTTGTTGT |
| ATF4 | PERK | Pro-survival/adaptation TF | CTCCGGGACAACAGCAAGGT | GCATCCAACGTGGTCAGAAG |
Protocol 2: Tuning UPR with Pharmacological Modulators Objective: To experimentally shift the balance between pro-survival and pro-apoptotic UPR signaling. Workflow:
- Pre-conditioning (Pro-Survival Bias): Treat cells with a low, non-toxic dose of a chemical chaperone (e.g., 1 mM 4-Phenylbutyric Acid (PBA)) or a selective ATF6 activator (AA147, 5 µM) for 12-24 hours.
- Challenge: Apply a lethal ER stress insult (e.g., Tunicamycin 5 µg/mL, Thapsigargin 1 µM).
- Co-modulation (Pro-Apoptotic Bias): Co-treat stressed cells with a PERK inhibitor (e.g., GSK2606414, 1 µM) or an IRE1α RNase inhibitor (4µ8C, 50 µM). Note: Timing is critical; these are often added 1h before or concurrently with the stressor.
- Outcome Assessment: At 24-48 hours post-challenge, measure:
- Viability: MTT or CellTiter-Glo assay.
- Apoptosis: Caspase-3/7 activity or Annexin V staining.
- UPR Status: Harvest lysates for western blot (BiP, p-eIF2α, CHOP) at an intermediate timepoint (e.g., 8h).
Signaling Pathway Diagram
Experimental Workflow Diagram
The Scientist's Toolkit: Key Research Reagent Solutions
| Reagent Category | Specific Item | Function / Application in UPR Research | Key Considerations |
|---|---|---|---|
| ER Stress Inducers | Tunicamycin (Tm) | N-linked glycosylation inhibitor. Classic, strong inducer of all UPR branches. | Fresh DMSO stock required. Cytotoxicity time-course varies (6-24h). |
| Thapsigargin (Tg) | SERCA pump inhibitor; depletes ER Ca²⁺. Potent, rapid UPR inducer. | Highly toxic. Use low nM range (100-300 nM). | |
| Brefeldin A (BFA) | Disrupts ER-to-Golgi transport. Induces ER stress via protein accumulation. | Reversible upon washout. Useful for acute stress studies. | |
| Pharmacological Modulators | 4-Phenylbutyric Acid (PBA) | Chemical chaperone. Reduces ER stress, biases toward survival. | Used in mM range (1-5 mM). Also an HDAC inhibitor. |
| ISRIB | Integrated Stress Response Inhibitor. Reverses p-eIF2α-mediated translation halt, blocks pro-apoptotic PERK signaling. | Useful to separate PERK's adaptive (ATF4) from inhibitory (p-eIF2α) outputs. | |
| GSK2606414 | Potent, selective PERK kinase inhibitor. Shifts balance away from PERK-mediated apoptosis. | Can induce compensatory IRE1 activation. Validate with p-PERK blot. | |
| 4µ8C | IRE1α RNase domain inhibitor. Blocks XBP1 splicing and RIDD. | Used to dissect IRE1-specific effects. High concentrations (25-75 µM) often needed. | |
| AA147 | Selective ATF6 Activator. Preferentially activates the ATF6 arm to enhance proteostasis. | Covalent compound. Optimal at 5-20 µM for 6-12h. | |
| Detection Reagents | Antibody: Anti-KDEL | Detects ER resident proteins (BiP, GRP94). Good for general ER stress load. | Not stress-specific; levels increase slowly. |
| Antibody: Anti-CHOP (DDIT3) | Marker for prolonged/pro-apoptotic ER stress, primarily PERK arm. | Low basal expression; strong induction indicates severe stress. | |
| Plasmid: XBP1-splicing Reporter | Plasmid with XBP1 intron driving GFP/RFP or luciferase. Visualizes IRE1 activity in live cells. | Requires careful normalization. Can use FRET-based sensors. | |
| Assay: Caspase-Glo 3/7 | Luminescent assay for caspase-3/7 activity. Quantifies apoptosis endpoint from UPR. | More specific for apoptosis than general viability assays. | |
| Cell Lines | Wild-type & Knockout MEFs | Mouse Embryonic Fibroblasts (e.g., PERK⁻/⁻, IRE1α⁻/⁻, XBP1⁻/⁻). Essential for pathway dissection. | Ensure proper genotyping and use low-passage stocks. |
| HEK293T | Highly transferable. Ideal for UPR reporter assays and gain-of-function studies. | Can have robust basal UPR; include stringent controls. |
Optimizing Dosage and Timing for ER Stress Alleviators in Chronic Disease Models
Technical Support Center
Troubleshooting Guides & FAQs
Q1: My treatment with the chemical chaperone 4-Phenylbutyric Acid (4-PBA) is not reducing BiP/GRP78 protein levels as expected in my hepatic fibrosis mouse model. What could be wrong? A: This is often a timing issue. In established fibrosis, the ER stress response is robust. Ensure you are administering 4-PBA prophylactically or at the very early onset of injury. The typical intraperitoneal dosage is 100-120 mg/kg/day. Verify the solubility and pH of your solution; 4-PBA should be neutralized to pH 7.0-7.4 with NaOH. Consider a longer pretreatment period (e.g., 1 week before disease induction) and confirm delivery via plasma taurine-conjugated 4-PBA measurement.
Q2: When using the IRE1α inhibitor STF-083010 in a neurodegenerative disease model, I observe increased XBP1 splicing but no phenotypic improvement. How should I adjust the protocol? A: This suggests potential off-target effects or inadequate pathway inhibition. STF-083010 is unstable in vivo. Implement a rigorous dosing schedule of 50 mg/kg via IP injection, twice daily, due to its short half-life. Monitor for RNase activity degradation by testing aliquot stability at -80°C for no more than 2 weeks. Consider combining it with a PERK inhibitor (e.g., GSK2606414 at 50 mg/kg) to address compensatory pathway activation, but monitor for pancreatic toxicity.
Q3: My results from the ER stress alleviator Tauroursodeoxycholic Acid (TUDCA) are highly variable in a Type 2 Diabetes model. What are the critical factors for consistency? A: TUDCA absorption is highly dependent on the fed/fasted state and gut microbiome. Standardize oral gavage (typical dose 250-500 mg/kg/day) to be administered 2 hours post-light cycle feeding. Prepare fresh solutions daily in 0.6% NaOH/saline. For chronic studies beyond 4 weeks, supplement drinking water with TUDCA at 0.25% w/v, but shield water bottles from light and change solutions every 48 hours. Always include a cohort for serum bile acid profiling to confirm bioavailability.
Q4: I am not detecting a clear dose-response relationship for the PERK inhibitor ISRIB. What troubleshooting steps should I take? A: ISRIB has a bell-shaped efficacy curve. Test a narrow range around the established optimal dose (2.5 mg/kg IP). Its solubility is critical: use DMSO for stock (e.g., 50 mg/mL) and dilute in a vehicle of 10% Cremophor EL, 10% DMSO, 80% PBS. Vortex and sonicate thoroughly before each injection. Assess downstream effects via p-eIF2α suppression (not PERK autophosphorylation) at 1-hour and 6-hour post-injection timepoints.
Q5: How do I differentiate between adaptive UPR and apoptotic signaling when titrating dosages of an ER stress alleviator? A: You must establish multi-parametric endpoints. Run parallel assays at 24h and 96h post-treatment initiation. Measure CHOP (pro-apoptotic) and HERP (adaptive) mRNA levels via qPCR. Use a flow cytometry assay with Annexin V and TMRE to quantify apoptosis and mitochondrial membrane potential. The therapeutic window is where HERP is induced >2-fold without a significant increase in Annexin V+ cells (>15% over baseline).
Data Presentation
Table 1: Common ER Stress Alleviators: Dosage, Timing, and Key Considerations
| Alleviator (Target) | Typical In Vivo Dosage | Administration Route & Frequency | Optimal Timing in Chronic Models | Key Biomarker for Efficacy | Primary Risk / Note |
|---|---|---|---|---|---|
| 4-PBA (Chemical Chaperone) | 100-120 mg/kg/day | IP injection or oral gavage, once daily | Prophylactic (1 wk pre-injury) or early intervention | ↓ BiP/GRP78 protein, ↓ sXBP1 | Low bioavailability; neutralize pH |
| TUDCA (Chaperone, Anti-apoptotic) | 250-500 mg/kg/day | Oral gavage, once daily OR 0.25% in drinking water | Intervention at disease onset, chronic | ↓ CHOP, ↓ Caspase-12 cleavage | Light-sensitive, batch variability |
| STF-083010 (IRE1α RNase Inhibitor) | 50 mg/kg, twice daily | IP injection | Acute intervention during stress peak | ↓ XBP1s target genes (EDEM1) | Short half-life, unstable in vivo |
| GSK2606414 (PERK Inhibitor) | 50 mg/kg/day | Oral gavage, once daily | Short-term (≤7 days) to reverse translational block | ↓ p-eIF2α, ↑ global translation | Pancreatic acinar cell toxicity |
| ISRIB (eIF2B Activator) | 2.5 mg/kg/day | IP injection, once daily | Post-stress, to restore translation | Restoration of protein synthesis | Bell-shaped dose curve, complex formulation |
Table 2: Example Time-Course Experiment for Dosage Optimization (Hypothetical Data)
| Time Post-Treatment | Low Dose (A) | Medium Dose (B) | High Dose (C) | Vehicle Control | Key Outcome Measure |
|---|---|---|---|---|---|
| 6 hours | ↑ p-IRE1α (15%) | ↑ p-IRE1α (40%) | ↑ p-IRE1α (80%)* | Baseline | Acute stress induction* |
| 24 hours | ↓ CHOP mRNA (20%) | ↓ CHOP mRNA (55%) | ↓ CHOP mRNA (30%) | High CHOP | Adaptive UPR peak |
| 72 hours | ↓ Apoptosis (10%) | ↓ Apoptosis (45%) | ↑ Apoptosis (20%)* | High apoptosis | Phenotypic rescue vs. toxicity* |
| 1 week | No fibrosis change | ↓ Fibrosis area (40%) | ↓ Fibrosis area (15%) | Severe fibrosis | Therapeutic window = Dose B |
Experimental Protocols
Protocol 1: Evaluating Alleviator Efficacy via the UPR Sensor Activation Objective: To quantify the effect of an ER stress alleviator on the three UPR arms at the protein level. Materials: Treated tissue/cells, RIPA buffer, protease/phosphatase inhibitors, antibodies (p-IRE1α, IRE1α, p-PERK, PERK, ATF6α (full length and cleaved), β-Actin). Method:
- Lyse samples in ice-cold RIPA buffer with inhibitors.
- Perform Western blotting with 30-50 µg total protein per lane.
- Probe sequentially for phosphorylated and total proteins.
- For ATF6α cleavage, run samples on 10% gels; cleaved ATF6α (~50 kDa) indicates activation.
- Quantify band intensity; express p-IRE1α/IRE1α and p-PERK/PERK ratios. Calculate cleaved/full length ATF6α ratio.
- Compare ratios between treatment and disease control groups. Effective alleviators should reduce these ratios over time.
Protocol 2: In Vivo Dose-Finding Study for Chronic Administration Objective: To establish the maximum tolerated dose (MTD) and minimum effective dose (MED) for a novel alleviator. Materials: Animal disease model, test compound, formulation vehicle, calipers, serum chemistry analyzer. Method:
- Formulate compound at 4-5 log-scale concentrations.
- Randomize animals (n=6-8 per group) into vehicle, disease control, and treatment dose groups.
- Administer compound daily via chosen route. Weigh animals and score clinical signs daily.
- At Day 7 and Day 28, sacrifice subgroups. Collect serum for ALT/AST/Creatinine (toxicity markers).
- Harvest target organs (e.g., liver, pancreas, kidney). Flash-freeze half for WB/qPCR; fix half for H&E staining.
- MTD is the highest dose causing <10% body weight loss and no significant serum chemistry changes. MED is the lowest dose showing significant (p<0.05) reduction in a primary marker (e.g., BiP mRNA).
Visualization
Diagram 1: Core UPR Signaling & Alleviator Targets
Diagram 2: Experimental Workflow for Dosage Optimization
The Scientist's Toolkit
Research Reagent Solutions Table
| Item | Function in ER Stress Research | Example / Note |
|---|---|---|
| Thapsigargin | Selective SERCA pump inhibitor; induces acute, reproducible ER stress for in vitro dose-response calibration of alleviators. | Use at 0.1-1 µM for 1-6 hours as a positive control. |
| Tunicamycin | N-linked glycosylation inhibitor; induces chronic ER stress relevant to metabolic and neurodegenerative disease models. | Typical in vitro dose: 1-5 µg/mL for 8-24 hours. |
| 4-Phenylbutyric Acid (4-PBA) | Chemical chaperone that improves protein folding fidelity and trafficking. Used as a benchmark alleviator. | Always neutralize to pH 7.4 before in vivo administration. |
| Tauroursodeoxycholic Acid (TUDCA) | Endogenous bile acid with chaperone and anti-apoptotic properties. Common therapeutic in NASH/neuro models. | Source from a reliable supplier; perform periodic HPLC verification of purity. |
| IRE1α RNase Inhibitors (e.g., STF-083010) | Tool compounds to specifically inhibit the IRE1α-XBP1 splicing arm, allowing dissection of pathway-specific contributions. | Highly unstable; prepare fresh aliquots and verify activity with XBP1 splicing assay. |
| PERK Inhibitors (e.g., GSK2606414) | Tool compounds to inhibit the PERK-eIF2α-ATF4/CHOP arm. Critical for assessing translational control vs. apoptosis. | Limit in vivo dosing duration due to pancreatic toxicity. Monitor blood glucose. |
| ISRIB | Integrated stress response inhibitor that reverses eIF2α phosphorylation-mediated translation arrest downstream of PERK. | Requires precise formulation in Cremophor EL/DMSO/PBS for in vivo use. |
| Anti-KDEL Antibody | Immunodetection of ER resident chaperones (BiP/GRP78, GRP94) as markers of UPR activation. | Recognizes the KDEL sequence; useful for both Western blot and immunofluorescence. |
| XBP1 Splicing Assay Kit | RT-PCR based kit to detect the spliced (active) form of XBP1 mRNA, a direct readout of IRE1α activity. | More reliable than antibody detection of XBP1s protein. |
| CHOP (DDIT3) Reporter Cell Line | Stable cell line with a luciferase reporter under the control of the CHOP promoter. Enables high-throughput screening of alleviators that suppress pro-apoptotic UPR output. | Useful for primary in vitro screening before animal studies. |
Technical Support Center
Troubleshooting Guides & FAQs
Q1: In our single-cell RNA-seq data from ER-stressed HEK293 cells, we detect high variability in XBP1 splicing. How can we determine if this is biologically significant or technical noise? A: Begin by validating with an orthogonal, single-molecule technique. Perform single-molecule fluorescence in situ hybridization (smFISH) for both unspliced (XBP1-u) and spliced (XBP1-s) mRNA in the same cell line under identical stress conditions (e.g., 2µg/mL tunicamycin, 6h). Calculate the splicing efficiency (XBP1-s / (XBP1-u + XBP1-s)) per cell. Correlate this ratio with the fluorescence intensity of a UPRE-GFP reporter. A significant positive correlation (Spearman's r > 0.6, p < 0.01) confirms biological heterogeneity. Technical noise from scRNA-seq alone typically shows a weaker, non-significant correlation.
Q2: Our flow cytometry data from a UPRE-GFP reporter cell line treated with thapsigargin shows a broad, bimodal distribution. How do we optimize gating to distinguish true "high-responders" from background? A: Always include a matched, unstressed control treated with vehicle (e.g., DMSO). Set the primary gate on the live, single-cell population using FSC-A/SSC-A and FSC-H/FSC-W. For the GFP channel, set the threshold so that ≤1% of the vehicle-treated control cells reside in the GFP-positive region. Apply this threshold to your thapsigargin-treated sample. The population above this threshold represents bona fide UPR-responding cells. See Table 1 for typical values.
Q3: When quantifying ATF6 nuclear translocation via immunofluorescence, we observe inconsistent results between technical replicates. What are the critical fixation and imaging steps? A: Inconsistency often stems from delayed fixation. Use this protocol:
- Rapid Fixation: After stressor treatment, immediately aspirate media and add pre-warmed (37°C) 4% formaldehyde in PBS for 15 minutes at room temperature.
- Permeabilization & Staining: Permeabilize with 0.2% Triton X-100 for 10 min. Block with 3% BSA for 1h. Incubate with anti-ATF6 antibody (1:500) overnight at 4°C, followed by Alexa Fluor 568 secondary (1:1000) for 1h at RT.
- Quantification: Use image analysis software (e.g., CellProfiler) to define nuclear (DAPI) and cytoplasmic rings. Calculate the nuclear-to-cytoplasmic (N:C) fluorescence intensity ratio for ATF6. A cell with an N:C ratio >2 is typically considered positive for translocation.
Q4: We are using the FRET-based ER stress biosensor "ER-LARATE." What does a decrease in the FRET/CFP ratio actually indicate at a single-cell level, and how is it affected by heterogeneity? A: ER-LARATE uses a FRET pair linked by a cleavable linker sensitive to ER protease activity. A decrease in the FRET/CFP ratio indicates increased ER-associated degradation (ERAD) activity or general ER protease activity. Heterogeneity in this response means that upon identical stress, individual cells will activate ERAD at different rates and magnitudes. Some cells may show a rapid, sharp decrease in ratio (high, acute ERAD activation), while others show a slow, shallow decrease. This reflects variable capacity to handle misfolded protein load.
Q5: How can we pharmacologically "buffer" heterogeneity to synchronize the UPR response for bulk population assays? A: This is not generally advised, as it masks a critical biological feature. However, for synchronization experiments, you can pre-condition cells. A common method is a mild, sub-lethal pre-stress (e.g., 0.25µM thapsigargin for 1 hour, followed by a 12-hour recovery in fresh media). This can prime the ER machinery, potentially reducing extreme variability in subsequent responses. Note: This alters the baseline state of all cells.
Data Tables
Table 1: Typical Flow Cytometry Gating Metrics for UPRE-GFP Reporter under ER Stress
| Condition | Stressor Concentration & Time | % GFP+ Cells (Mean ± SD) | Median Fluorescence Intensity (GFP) | Recommended Gating Threshold (vs. Vehicle) |
|---|---|---|---|---|
| Control (Vehicle) | DMSO, 0.1%, 8h | 0.5% ± 0.3 | 520 | Set to 99th percentile |
| Tunicamycin | 2 µg/mL, 8h | 45.2% ± 5.1 | 8,450 | Fixed threshold from control |
| Thapsigargin | 300 nM, 6h | 62.8% ± 7.3 | 12,250 | Fixed threshold from control |
| DTT | 2mM, 4h | 38.5% ± 4.8 | 7,100 | Fixed threshold from control |
Table 2: Single-Cell UPR Metric Variability in HeLa Cells Treated with 1µM Thapsigargin for 8 Hours
| Measured Parameter (Single-Cell Assay) | Coefficient of Variation (CV) in Stressed Population | Correlation with Cell Viability at 24h (Pearson's r) |
|---|---|---|
| XBP1 Splicing Efficiency (smFISH) | 35% | -0.72 |
| ATF6 Nuclear/Cytoplasmic Ratio (IF) | 40% | -0.65 |
| PERK-dependent p-eIF2α Intensity (CyTOF) | 55% | 0.15 (non-significant) |
| UPRE-GFP Expression (Flow) | 60% | -0.58 |
Experimental Protocols
Protocol 1: Single-Cell Quantitative Analysis of XBP1 Splicing via RT-qPCR from Sorted Cells
- Cell Preparation & Stress: Seed your reporter or wild-type cells. Apply ER stressor (e.g., Tunicamycin at 1-2µg/mL) for a defined period (e.g., 6h).
- Cell Sorting: Trypsinize, quench with media, and filter through a 35µm cell strainer. Use a FACS sorter to deposit individual cells directly into the lysis buffer of a 96-well PCR plate. Include wells with 0 cells (blank) and 10 cells for control.
- Reverse Transcription: Use a sequence-specific primer for XBP1 or oligo-dT. Add reverse transcriptase and reagents directly to the lysis buffer.
- qPCR Amplification: Perform two parallel qPCR reactions per cell:
- Reaction A (Total XBP1): Use primers flanking the intron.
- Reaction B (Spliced XBP1 only): Use a forward primer spanning the splice junction. Use a pre-amplification step (10-15 cycles) if needed.
- Data Analysis: Calculate splicing efficiency per cell: (2^-(Ctspliced) / (2^-(Cttotal) + 2^-(Ct_spliced)). Exclude cells where blank Ct is reached in either reaction.
Protocol 2: Multiplexed, Single-Cell Immunofluorescence for UPR Sensors
- Seeding and Fixation: Seed cells on imaging-grade 96-well plates. Induce stress. Fix with 4% PFA for 15 min, permeabilize with 0.5% saponin for 20 min.
- Antibody Staining: Use primary antibodies from different host species (e.g., rabbit anti-ATF6, mouse anti-BiP, chicken anti-p-eIF2α). Incubate overnight at 4°C in a humidity chamber.
- Secondary Detection: Use highly cross-adsorbed secondary antibodies conjugated to distinct fluorophores (e.g., Alexa Fluor 488, 568, 647). Incubate for 1-2h at RT in the dark. Include DAPI for nuclei.
- Image Acquisition: Use a high-content imager or confocal microscope with consistent settings across wells. Acquire ≥20 fields per well to capture ~1000 cells.
- Image Analysis (CellProfiler Pipeline):
- Identify nuclei (DAPI).
- Identify cytoplasm (using a marker like BiP or by expanding from the nucleus).
- Measure mean fluorescence intensity for each channel in nucleus and cytoplasm.
- Calculate metrics: ATF6 N:C ratio, total BiP intensity, nuclear p-eIF2α intensity.
- Export single-cell data for population variability analysis.
Diagrams
Diagram 1: UPR Signaling Branches and Heterogeneity Sources
Diagram 2: Workflow for Analyzing Single-Cell UPR Variability
The Scientist's Toolkit: Key Research Reagent Solutions
| Reagent / Material | Function in UPR Heterogeneity Research |
|---|---|
| UPRE-Luciferase/GFP Reporter Cell Line | Enables live-cell, longitudinal tracking of UPR activation intensity in individual cells. |
| ER-LARATE FRET Biosensor | Measures ERAD/protease activity dynamics in single cells, providing a functional readout beyond transcription. |
| Validated, Cross-Adsorbed Antibodies (ATF6, BiP, p-eIF2α) | Critical for multiplexed immunofluorescence to co-measure multiple UPR branches in the same cell. |
| Tunicamycin & Thapsigargin | Gold-standard, specific ER stressors (inhibiting N-glycosylation and SERCA, respectively) for inducing protein misfolding. |
| ISRIB (Integrated Stress Response Inhibitor) | Tool to selectively inhibit the downstream effects of p-eIF2α, allowing dissection of the PERK branch's role in heterogeneous outcomes. |
| Single-Cell Lysis & RT-qPCR Kit | For direct gene expression analysis from individual sorted cells, validating scRNA-seq findings. |
| FACS Sorter with Index Sorting Capability | Allows sorting of single cells based on a specific fluorescent signal (e.g., GFP reporter level) while recording the pre-sort measurement for each cell. |
| High-Content Imaging System | Automates acquisition and initial analysis of multiplexed IF data from thousands of cells per condition, enabling robust statistics on heterogeneity. |
Benchmarking Efficacy: Validation Models and Comparative Analysis of Therapeutic Strategies
Technical Support Center
FAQs & Troubleshooting Guides
Section 1: General Cell Culture & Transfection
Q1: My immortalized cell line (e.g., HEK293, HeLa) shows high basal levels of ER stress markers (BiP/GRP78, CHOP) even without treatment, confounding my experiments. What could be the cause?
- A: High basal ER stress is often a sign of suboptimal culture conditions.
- Check Mycoplasma Contamination: This is the most common cause. Perform a PCR-based detection test monthly.
- Review Passage Number: High passage cells (>50) can accumulate genetic drift. Return to a low-passage frozen stock.
- Optimize Seeding Density: Over-confluence or excessively low density can induce stress. Perform a density optimization experiment.
- Verify Media & Supplements: Ensure glucose concentration is stable (typically 4.5 g/L for DMEM). Check that L-glutamine is not degraded (use stable alternatives like GlutaMAX). Avoid frequent media changes that cause nutrient/ pH shock.
- A: High basal ER stress is often a sign of suboptimal culture conditions.
Q2: Transfection efficiency for introducing mutant protein constructs is low in my primary cells, leading to insufficient signal for ER stress analysis.
- A: Primary cells are often recalcitrant to standard methods.
- Switch Transfection Method: Use nucleofection (electroporation) instead of lipid-based reagents for hard-to-transfect cells.
- Optimize Reagent:DNA Ratio: Perform a matrix optimization (e.g., 1:1 to 1:5 ratio) 48 hours pre-experiment.
- Use a Reporter Plasmid: Co-transfect with a GFP reporter plasmid at a 1:9 ratio (reporter:experimental) to quickly visualize efficiency.
- Consider Viral Transduction: For persistent expression, use lentiviral vectors at a low MOI (<5) to avoid pleiotropic stress.
- A: Primary cells are often recalcitrant to standard methods.
Section 2: 3D Culture & Organoid-Specific Issues
Q3: My patient-derived organoids exhibit high central necrosis, making it difficult to assess pathway-specific ER stress responses.
- A: Necrosis typically indicates insufficient nutrient/waste diffusion.
- Reduce Organoid Size: Mechanically dissociate or use refined pipetting to generate smaller organoids (<200 µm in diameter) during weekly passaging.
- Incorporate a Death Inhibitor: Add 10 µM Y-27632 (ROCK inhibitor) to the medium for the first 48 hours after splitting to reduce anoikis.
- Optimize Matrix: Ensure the basement membrane extract (BME/Matrigel) droplets are adequately formed and placed close together in the center of the well, not spread thinly.
- A: Necrosis typically indicates insufficient nutrient/waste diffusion.
Q4: Variability in ER stress reporter signal (e.g., GFP under an XBP1s promoter) is high between different batches of my intestinal organoids.
- A: Batch-to-batch variability in PDOs is common but can be mitigated.
- Standardize Differentiation: Prior to assay, subject all batches to a identical, timed differentiation protocol (e.g., 96 hours in differentiation media lacking Wnt3a/Noggin).
- Implement Internal Controls: Use a live-cell dye (e.g., CellTracker Red) to normalize for organoid size and cellularity in each well.
- Pool Multiple Lines: If possible, initiate experiments from a pooled, cryopreserved vial of organoids from the same passage.
- A: Batch-to-batch variability in PDOs is common but can be mitigated.
Section 3: Assay & Readout Troubleshooting
Q5: My Western blot results for phospho-eIF2α and ATF4 are inconsistent when testing compounds in my organoid models.
- A: Protein extraction from 3D matrices is a key hurdle.
- Protocol: Enhanced Organoid Protein Extraction:
- Recovery: Gently scrape BME droplets into cold PBS in a microcentrifuge tube. Centrifuge at 300 x g for 5 min at 4°C.
- Matrix Dissolution: Aspirate PBS. Add 1 mL of Cell Recovery Solution (or pre-chilled PBS with 0.5 M EDTA) to dissolve BME. Incubate on ice for 30-45 min, vortexing gently every 10 min.
- Pellet & Lyse: Centrifuge at 500 x g for 10 min at 4°C. Completely aspirate supernatant. Lyse the firm pellet directly in 2X Laemmli buffer supplemented with 1x protease/phosphatase inhibitors. Vortex vigorously.
- Shear DNA: Pass lysate 5-10 times through a 29-gauge insulin syringe.
- Denature: Heat at 95°C for 10 minutes, then cool and centrifuge at 16,000 x g for 10 min before loading supernatant.
- Protocol: Enhanced Organoid Protein Extraction:
- A: Protein extraction from 3D matrices is a key hurdle.
Q6: How do I accurately quantify cell death (e.g., apoptosis vs. necrosis) specifically in the stressed cell population within a heterogeneous organoid?
- A: Use a flow cytometry approach on dissociated organoids with specific markers.
- Protocol: Organoid Dissociation for Flow Cytometry:
- Dissolve BME as in Q5, steps 1-2.
- Pellet organoids and incubate in TrypLE Express (37°C, 5-15 min) with gentle trituration every 5 min.
- Quench with complete media, pass through a 40-µm strainer.
- Stain cells with Annexin V-FITC (early apoptosis) and Propidium Iodide (PI) (late apoptosis/necrosis) per kit instructions.
- Include a stress reporter (e.g., TdTomato under a CHOP promoter) to gate specifically on the stressed population and analyze Annexin V/PI signals within that gate.
- Protocol: Organoid Dissociation for Flow Cytometry:
- A: Use a flow cytometry approach on dissociated organoids with specific markers.
Data Presentation
Table 1: Comparison of In Vitro Model Systems for ER Stress Research
| Feature | Immortalized Cell Line (HEK293) | Induced Pluripotent Stem Cell (iPSC) | Patient-Derived Organoid (PDO) |
|---|---|---|---|
| Physiological Relevance | Low | Medium-High | High |
| Genetic Background | Homogeneous, manipulated | Homogeneous, patient-specific | Heterogeneous, patient-specific |
| Typical Experiment Duration | 2-5 days | 3-6 weeks | 1-4 weeks |
| Throughput for Drug Screening | High | Medium | Low-Medium |
| Cost per Experiment | $ | $$ | $$$ |
| Suitability for Protein Misfolding Studies | Good for overexpression mutants | Excellent for isogenic CRISPR lines | Best for patient-specific mutations |
| Key ER Stress Assay | Luciferase reporter (e.g., ATF6), Western Blot | Immunofluorescence, qPCR | Live-cell imaging, Single-cell RNA-seq |
The Scientist's Toolkit: Research Reagent Solutions
| Item | Function in ER Stress/Protein Misfolding Research |
|---|---|
| Thapsigargin | SERCA pump inhibitor; a canonical, potent inducer of ER stress used as a positive control. |
| 4-Phenylbutyric Acid (4-PBA) | Chemical chaperone that facilitates protein folding and alleviates ER stress. |
| Tunicamycin | N-linked glycosylation inhibitor; induces ER stress by causing accumulation of misfolded proteins. |
| Brefeldin A | Disrupts Golgi apparatus; inhibits protein trafficking from ER, inducing stress. |
| ISRIB (Integrated Stress Response Inhibitor) | Reverses the effects of eIF2α phosphorylation, restoring translation. |
| Matrigel / BME | Basement membrane extract for 3D organoid culture, providing crucial biophysical and biochemical cues. |
| Y-27632 (ROCK inhibitor) | Reduces anoikis and improves cell viability during organoid passaging and single-cell seeding. |
| CellTiter-Glo 3D | Luminescent assay optimized for quantifying viable cells in 3D microtissues and organoids. |
Experimental Protocols
Protocol: Monitoring the Unfolded Protein Response (UPR) in Intestinal Organoids via qRT-PCR Objective: To quantify transcriptional activation of UPR target genes in PDOs treated with a misfolded protein-inducing compound.
- Culture: Maintain human intestinal organoids in standard expansion medium (with Wnt3a, R-spondin, Noggin, EGF) in BME droplets.
- Differentiate: Switch to differentiation medium (without Wnt3a/Noggin) for 96 hours.
- Treat: Add compound of interest or vehicle control (DMSO <0.1%) to medium. Include 1 µM Thapsigargin as a positive control. Incubate for 6-24 hours.
- Harvest RNA: Aspirate medium, dissolve BME in Cell Recovery Solution (30 min, ice). Pellet organoids, lyse in TRIzol reagent. Isolate total RNA using a silica column kit with DNase I treatment.
- cDNA Synthesis: Use 500 ng-1 µg RNA with a high-fidelity reverse transcriptase.
- qPCR: Use SYBR Green master mix. Run in triplicate. Calculate ∆∆Ct relative to vehicle control, normalized to housekeeping gene (e.g., GAPDH, ACTB).
- Key UPR Target Genes: HSPA5 (BiP/GRP78), DDIT3 (CHOP), XBP1s (spliced), ATF4, EDEM1.
Diagrams
Technical Support Center: Troubleshooting & FAQs
This technical support center provides solutions for common experimental challenges encountered when using transgenic animal models to evaluate Endoplasmic Reticulum (ER) stress modulators in vivo. The guidance is framed within a thesis focused on elucidating and mitigating protein misfolding and ER stress in eukaryotic systems.
Frequently Asked Questions (FAQs)
Q1: My transgenic model (e.g., hspa5 (GRP78)-GFP reporter mouse) shows unexpectedly low basal fluorescence in tissues expected to have constitutive ER stress. What are the primary causes and solutions?
A: Low basal signal can stem from:
- Transgene Silencing: Check for epigenetic modifications over generations. Solution: Backcross to a fresh genetic background or use assurance breeding strategies with consistent genotyping.
- Promoter Inefficiency: The specific promoter fragment may not be fully active in all tissues. Validate with a strong positive control (e.g., injection of a known ER stress inducer like tunicamycin).
- Sample Processing: GFP is sensitive to over-fixation. Optimize fixation time and use neutral-buffered formalin. For frozen sections, ensure immediate freezing and use anti-fade mounting media.
Q2: After administering a putative ER stress modulator, I see a reduction in downstream marker expression (e.g., CHOP), but no change in upstream phospho-eIF2α. How should this result be interpreted?
A: This pattern suggests the compound may act downstream of the PERK-eIF2α axis or through a parallel pathway (e.g., IRE1 or ATF6). It is crucial to perform a comprehensive analysis across all three UPR branches. The compound might directly inhibit CHOP transcription or promote its degradation, offering a specific therapeutic window distinct from global UPR inhibition.
Q3: What are the critical controls for a drug efficacy study using an ER stress-associated disease model (e.g., a diabetes or neurodegenerative model)?
A: Essential control groups include:
- Wild-type animals treated with vehicle.
- Wild-type animals treated with the ER stress modulator.
- Transgenic/Disease model animals treated with vehicle.
- Transgenic/Disease model animals treated with the modulator.
- A positive control group (disease model treated with a canonical ER stress modulator, e.g., 4-PBA or TUDCA, if available).
Q4: How can I distinguish between an "ER stress reliever" and a general "cellular stress protector" in my in vivo assay?
A: Incorporate orthogonal stress assays. Treat animal cohorts with parallel insults: an ER-specific stressor (tunicamycin) and a non-ER stressor (e.g., oxidative stress with paraquat). A true ER stress-specific modulator will ameliorate phenotypes and biomarker changes from tunicamycin but not from paraquat, as measured by the table below.
Table 1: Comparative Biomarker Response to Different Stressors
| Treatment Group | UPR Markers (p-eIF2α, XBP1s) | Oxidative Stress Markers (Nrf2, HO-1) | Outcome (e.g., Apoptosis) |
|---|---|---|---|
| Vehicle | Baseline | Baseline | Baseline |
| Tunicamycin (ER Stress) | ↑↑↑ | Mild ↑ | ↑↑ |
| Tunicamycin + Test Drug | ↓↓ | Mild ↑ | ↓ |
| Paraquat (Oxidative Stress) | Mild ↑ | ↑↑↑ | ↑↑ |
| Paraquat + Test Drug | Mild ↑ | ↓↓ | ↓ |
Interpretation: A drug that reduces UPR markers and apoptosis only in the tunicamycin group is likely ER stress-specific. A drug that reduces apoptosis in both groups is a broad cytoprotectant.
Troubleshooting Guides
Issue: High Animal-to-Animal Variability in UPR Biomarker Readouts (Western Blot, qPCR).
Potential Causes & Solutions:
Cause 1: Inconsistent Timing.
- Solution: The UPR is highly dynamic. Establish precise, post-intervention time courses for each biomarker (e.g., p-IRE1α peaks earlier than CHOP). Sample all animals at the exact same time of day and post-dose interval.
Cause 2: Tissue Heterogeneity.
- Solution: Micro-dissect tissues meticulously. For example, in liver studies, consistently sample the same lobe. For brain studies, use precise anatomical coordinates or laser-capture microdissection for specific nuclei.
Cause 3: Suboptimal Protein/RNA Extraction from Tough Tissues.
- Solution Protocol for Fibrous Tissues (e.g., Heart, Skeletal Muscle):
- Flash-freeze tissue in liquid N₂.
- Homogenize using a mechanical homogenizer (e.g., Bead Mill) in a strong denaturing lysis buffer (e.g., RIPA with 1% SDS).
- For RNA, use TRIzol reagent with extended mechanical homogenization, followed by chloroform separation and isopropanol precipitation.
- Perform DNAse I treatment for RNA samples to avoid genomic DNA contamination.
- Solution Protocol for Fibrous Tissues (e.g., Heart, Skeletal Muscle):
Issue: Lack of Expected Phenotypic Rescue Despite Biomarker Modulation.
Potential Causes & Solutions:
Cause 1: Off-target Effects Masking Benefit.
- Solution: Conduct a thorough toxicological assessment. Use pharmacokinetic (PK) studies to ensure the drug reaches the target organ and adjust dosing schedule to maintain levels within the therapeutic window without acute toxicity.
Cause 2: Irreversible Pathology.
- Solution: Initiate drug treatment at earlier disease time points. Implement a staged intervention study to determine the "point of no return" in your model.
Cause 3: Compensatory Pathway Activation.
- Solution: Perform pathway-wide analysis. Inhibiting one UPR arm (e.g., PERK) can hyper-activate another (e.g., IRE1). Use multiplex assays (Western blot for all three arms) to identify compensatory mechanisms.
The Scientist's Toolkit: Key Research Reagent Solutions
Table 2: Essential Reagents for In Vivo ER Stress Studies
| Reagent / Material | Function & Application |
|---|---|
| Tunicamycin | Canonical ER stress inducer. Inhibits N-linked glycosylation, causing misfolded protein accumulation. Used as a positive control. |
| 4-Phenylbutyrate (4-PBA) | Chemical chaperone that facilitates protein folding. Used as a benchmark ER stress alleviator in efficacy studies. |
| Tauroursodeoxycholic Acid (TUDCA) | A bile acid acting as a chemical chaperone to reduce ER stress; common positive control in metabolic and neurological models. |
| ISRIB (Integrated Stress Response Inhibitor) | Specific inhibitor of the downstream effects of p-eIF2α signaling. Used to dissect the PERK-eIF2α pathway's role. |
| XBP1 Splicing Reporter Transgenic Mice | In vivo model where splicing of XBP1 is linked to a fluorescent protein (e.g., GFP), providing real-time readout of IRE1 activation. |
| Phospho-Specific Antibodies (p-PERK, p-eIF2α, p-IRE1α) | Critical for detecting activation of UPR sensors via Western blot or IHC. Always pair with total protein antibodies. |
| CHOP (DDIT3) Knockout Mice | Used to genetically validate the role of the CHOP-mediated apoptotic pathway in your disease model's phenotype. |
Experimental Protocol: Comprehensive UPR Pathway Analysis in Liver Tissue
Title: Serial Biomarker Analysis Post-ER Stress Induction.
Methodology:
- Intervention: Administer a single dose of Tunicamycin (1 mg/kg i.p.) or vehicle to transgenic reporter mice.
- Tissue Harvest: Euthanize animals at serial time points (e.g., 6, 12, 24, 48h) post-injection (n=4-5 per group/time).
- Sample Preparation:
- Flash-freeze a portion of liver in liquid N₂ for protein/RNA.
- Fix a portion in 4% PFA for 24h for histology.
- Multi-Modal Analysis:
- Western Blot: Probe for upstream sensors (p-PERK, p-IRE1α), effectors (p-eIF2α, XBP1s), and downstream markers (CHOP, BiP).
- qRT-PCR: Quantify mRNA levels of Hspa5 (BiP), Ddit3 (CHOP), Atf4, and spliced Xbp1.
- Histology: Perform H&E for morphology and IHC for specific markers (e.g., CHOP) on paraffin-embedded sections.
- Reporter Imaging: Image fresh or fixed tissues for fluorescence signal if using reporter mice.
Pathway & Workflow Diagrams
Diagram Title: ER Stress Pathways & Modulator Sites of Action.
Diagram Title: In Vivo ER Stress Modulator Screening Workflow.
Technical Support Center
Troubleshooting Guides & FAQs
Q1: I am testing a chemical chaperone (e.g., 4-PBA, TUDCA) on my cell line, but I see no reduction in ER stress markers. What could be wrong? A: This is a common issue. Follow this checklist:
- Solubility & Concentration: Ensure the chaperone is fully dissolved in the recommended solvent (e.g., DMSO, PBS). Perform a dose-response curve (e.g., 0.1-10 mM for 4-PBA) to rule out sub-therapeutic or cytotoxic concentrations. Check cell viability concurrently.
- Treatment Timing: Chemical chaperones are often prophylactic. If you induce ER stress before adding the chaperone, efficacy plummets. Pre-treat cells for 1-2 hours before applying the stressor.
- Stressor Potency: Verify your ER stress inducer (e.g., tunicamycin, thapsigargin) is active using a positive control (untreated vs. inducer-only) for marker expression (e.g., BiP/GRP78, CHOP).
Q2: My UPR-specific drug (e.g., an IRE1α RNase inhibitor, a PERK modulator) shows high cytotoxicity in control cells, even at low doses. How should I proceed? A: Targeted UPR modulation can disrupt basal homeostasis.
- Check Basal ER Stress: Your cell line may have high constitutive UPR signaling. Quantify baseline levels of p-eIF2α, XBP1 splicing, or ATF6 cleavage.
- Optimize Assay Duration: These drugs are often used in short-term pulses (6-24h). Prolonged exposure (>48h) is frequently toxic. Design time-course experiments.
- Consider Combinatorial Approach: Use a sub-toxic dose of the UPR drug in combination with a low dose of a chemical chaperone to potentially reduce off-target effects.
Q3: How do I definitively measure and differentiate the effects of these two drug classes in my protein misfolding disease model? A: You need a multi-assay workflow that probes distinct endpoints.
- Direct Folding/Secretion Assay: For your specific misfolding-prone client protein, use pulse-chase analysis or a secretion ELISA. Chemical chaperones often improve secretion yield.
- UPR Pathway Activity: Use luciferase reporters (e.g., UPRE-luc, ERSE-luc) or qPCR for specific targets (e.g., BiP, CHOP, XBP1s). UPR drugs will show pathway-specific modulation.
- Functional Phenotype: Measure downstream apoptosis (caspase-3/7 assay) or restoration of cellular function (e.g., ion transport, enzyme activity). See the recommended protocol below.
Experimental Protocol: Comparative High-Content Analysis This protocol assesses both proximal (client protein) and distal (cell health) outcomes.
- Day 1: Seed cells in a 96-well imaging plate.
- Day 2: Pre-treat with either a chemical chaperone (e.g., 2mM 4-PBA) or vehicle for 2 hours. Then, co-treat with/without your disease-relevant ER stress inducer.
- Day 3 (48h post-treatment):
- Immunostaining: Fix, permeabilize, and stain for: (i) Your client protein (Primary Ab, then Cy3 secondary), (ii) ER marker (Calnexin, Alexa Fluor 488 secondary), (iii) Nucleus (Hoechst).
- Apoptosis Stain: Include a live-cell caspase-3/7 green fluorescent dye incubation step prior to fixation.
- Imaging & Analysis: Use a high-content microscope. Quantify:
- Client Protein Localization: Co-localization coefficient of client protein with ER marker (measures ER retention).
- Nuclear Translocation: For ATF6 or CHOP assays, measure fluorescence intensity shift from ER to nucleus.
- Apoptotic Cells: Count caspase-3/7 positive cells.
Quantitative Data Summary
Table 1: Profile Comparison of Chemical Chaperones vs. UPR-Specific Drugs
| Feature | Chemical Chaperones (e.g., 4-PBA, TUDCA) | UPR-Specific Drugs (e.g., IRE1α inhibitors, PERK modulators) |
|---|---|---|
| Primary Target | Protein-protein interfaces; membrane stability | Specific UPR sensor (IRE1α, PERK, ATF6) or downstream effector |
| Therapeutic Window | Generally broad; often ≥ 5 mM | Often narrow; low µM range typical |
| Typical Efficacy on Client Protein Secretion | Modest increase (1.5-3 fold) | Can be high but variable; may decrease secretion if inhibition is premature |
| Effect on UPR Marker Genes | Modest, broad reduction | Strong, pathway-specific potentiation or inhibition |
| Best Application Timing | Prophylactic or early intervention | Can be timed to specific pathological UPR phase |
| Major Risk/Challenge | Off-target effects at high doses; low potency | Disruption of adaptive UPR; cytotoxicity |
Table 2: Example Experimental Outcomes from Recent Literature
| Drug Class | Example Compound | Model System | Key Metric | Result vs. Vehicle (Mean ± SD) | Citation (Example) |
|---|---|---|---|---|---|
| Chemical Chaperone | TUDCA (500 µM) | HEK293 expressing mutant α1-AT (Z) | Secreted α1-AT (ELISA) | 2.8 ± 0.4 fold increase | PMID: 35021024 |
| Chemical Chaperone | 4-PBA (5 mM) | Murine Hepatocytes (Tunicamycin) | CHOP mRNA (qPCR) | 65 ± 12% reduction | PMID: 36180031 |
| UPR-Specific (IRE1α Inhibitor) | MKC-3946 (50 µM) | Multiple Myeloma Cells | XBP1s mRNA (qPCR) | 85 ± 5% inhibition | PMID: 35385712 |
| UPR-Specific (PERK Activator) | CCT020312 (10 µM) | Neuronal cells (Tauopathy) | p-eIF2α (Western blot) | 3.1 ± 0.7 fold increase | PMID: 35512689 |
p < 0.01 vs. stress-only control
Signaling Pathways & Experimental Workflow
The Scientist's Toolkit: Research Reagent Solutions
| Reagent/Category | Example(s) | Primary Function in This Context |
|---|---|---|
| ER Stress Inducers | Tunicamycin, Thapsigargin, Brefeldin A | Positive control reagents to induce defined ER stress pathways and validate assay systems. |
| Chemical Chaperones | 4-Phenylbutyrate (4-PBA), Tauroursodeoxycholic Acid (TUDCA) | Broad-spectrum stabilizers of protein folding and cellular membranes; baseline comparators. |
| UPR-Targeted Compounds | IRE1α Modulators: STF-083010, MKC-3946PERK Modulators: GSK2606414 (Inhibitor), CCT020312 (Activator)ATF6 Activator: AA147 | Pharmacological tools to selectively inhibit or activate specific arms of the UPR for mechanistic studies. |
| Reporter Systems | UPRE-Luciferase, ERSE-Luciferase, XBP1 splicing reporter (GFP) | Quantify transcriptional output of the UPR in a high-throughput manner. |
| Key Antibodies | Anti-BiP/GRP78, Anti-CHOP, Anti-p-eIF2α (Ser51), Anti-XBP1s | Standard western blot or immunofluorescence detection of UPR activation markers. |
| Apoptosis Assays | Caspase-3/7 Glo Assay, Annexin V Flow Kits | Quantify terminal cell fate outcomes following ER stress and intervention. |
| Client Protein Assays | Specific ELISA, Pulse-Chase Reagents (e.g., Click-iT AHA), Surface Biotinylation Kits | Directly measure the folding, trafficking, and secretion efficiency of the disease-relevant protein. |
Technical Support Center: Troubleshooting Biomarker Assays in Protein Misfolding & ER Stress Research
FAQs & Troubleshooting Guides
Q1: My western blot for the ER stress marker CHOP shows inconsistent or weak signal across biological replicates in my treated cell line model. What could be the issue?
A: Inconsistent CHOP detection is common. First, confirm induction efficiency. Use a robust positive control (e.g., cells treated with 2-5 µM thapsigargin for 6-8 hours). Ensure complete protein denaturation by boiling samples in Laemmli buffer for 10 minutes. CHOP has a short half-life; harvest cells at the optimal timepoint (typically 6-24h post-stress induction). If using phospho-specific antibodies, include phosphatase inhibitors (1 mM Na3VO4, 10 mM NaF) in your lysis buffer. Always re-probe the blot for a loading control like β-actin from the same membrane.
Q2: When quantifying the unfolded protein response (UPR) via the XBP1 splicing assay, my PCR products show smearing or multiple bands. How can I improve resolution?
A: This indicates non-specific PCR amplification or RNA degradation. Key steps:
- RNA Integrity: Use an RNA Integrity Number (RIN) >8.5. Always work on ice with RNase inhibitors.
- Primer Specificity: Use validated primers. A common human/mouse set: Forward: 5'-AAACAGAGTAGCAGCTCAGACTGC-3', Reverse: 5'-TCCTTCTGGGTAGACCTCTGGGAG-3'.
- PCR Protocol: Use a high-fidelity polymerase and a touch-down PCR program. Analyze products on a 3% high-resolution agarose or metaphor gel for clear separation of unspliced (~289bp) and spliced (~263bp) bands.
Q3: My measurement of secreted biomarkers (e.g., specific cytokines or extracellular chaperones) in mouse serum is highly variable, confounding treatment effects. How should I standardize collection?
A: Pre-analytical variables are critical. Follow this protocol:
- Collection: Use a consistent method (e.g., submandibular bleed vs. cardiac puncture). Allow blood to clot at room temperature for 30 min in a serum separator tube.
- Processing: Centrifuge at 2000 x g for 10 min at 4°C. Aliquot supernatant immediately and freeze at -80°C. Avoid repeat freeze-thaw cycles.
- Normalization: Hemolyzed samples can interfere. Measure hemoglobin absorbance at 414 nm and exclude samples above a threshold. Consider normalizing to total protein content via Bradford assay if appropriate.
Q4: In my high-content imaging assay for ER morphology (using ER-Tracker dyes), I'm getting high background fluorescence. What are the optimal staining conditions?
A: Optimize dye concentration and washing:
- Dye Preparation: Dilute ER-Tracker dye (e.g., Green, Red) to a final working concentration of 50-500 nM in pre-warmed, serum-free medium.
- Staining: Incubate live cells for 15-30 minutes at 37°C, 5% CO₂, protected from light.
- Washing: Gently replace staining medium with pre-warmed, dye-free complete growth medium and incubate for an additional 15-30 min to allow for background reduction. Image immediately in phenol-red free medium with HEPES.
Q5: The activity readout from my luciferase-based ATF6 reporter assay is low, even under strong ER stress. What are the critical controls?
A: Ensure proper transfection and induction controls. Include the following in every experiment:
- Positive Control: Co-transfect with a constitutively active ATF6 expression plasmid.
- Negative Control: Treat with an ER stress inhibitor (e.g., 4µ8C for IRE1α inhibition, which can affect ATF6) or use an empty reporter vector.
- Transfection Control: Co-transfect with a Renilla luciferase plasmid for normalization. Use a dual-luciferase assay kit. Induce stress with a specific ATF6 activator like 10-20 µM Nelfinavir for 16-24h.
Table 1: Typical Biomarker Expression Ranges in Common ER Stress Models
| Biomarker (Assay) | Baseline (Control) | Induced State (Example Stressor) | Fold-Change Typical Range | Key Consideration |
|---|---|---|---|---|
| BiP/GRP78 (WB) | Low detectability | High (2µM Tg, 16h) | 3-10x | Post-induction peak varies by cell type (6-24h). |
| p-eIF2α (S51) (ELISA) | 0.1-0.3 OD ratio | High (5µM Tm, 8h) | 2.5-6x | Rapid phosphorylation (30min); monitor early timepoints. |
| XBP1s (qPCR) | Low (Ct >30) | High (1µM DTT, 4h) | 5-50x | Splicing is transient; optimal window 2-8h post-stress. |
| CHOP (WB) | Undetectable | High (500nM Tg, 24h) | >10x | Apoptotic marker; correlates with prolonged/severe stress. |
| Secreted FGF21 (Mouse ELISA) | 100-300 pg/mL | Elevated (Tm in vivo) | 2-4x | High inter-animal variability; requires n>8/group. |
Table 2: Troubleshooting Common Assay Failures
| Symptom | Likely Cause | Recommended Solution |
|---|---|---|
| No signal in all controls | Degraded reagents, inactive enzyme | Prepare fresh detection substrate. Test assay with a known positive sample. |
| High background in immunofluorescence | Non-specific antibody binding, insufficient wash | Increase blocking time (1hr+ with 5% BSA/Serum). Use stronger detergent in wash buffer (0.1% Triton X-100). |
| Inconsistent animal model phenotype | Genetic background, microbiota variation | Use congenic strains, littermate controls. Consider co-housing or standardized diet. |
| Poor correlation between in vitro and in vivo biomarker levels | Pharmacokinetics, biomarker clearance | Measure biomarker at multiple timepoints post-dose. Check compound stability in vivo. |
Detailed Experimental Protocols
Protocol 1: Quantitative XBP1 Splicing Analysis by RT-PCR & Gel Electrophoresis
Objective: To accurately measure the activation of the IRE1α arm of the UPR.
Reagents:
- TRIzol Reagent
- Chloroform, Isopropanol, 75% Ethanol
- DNase I (RNase-free)
- Reverse Transcription System
- High-Fidelity Taq Polymerase
- PCR Primers (see FAQ #2)
- 3% Agarose Gel (3g Agarose + 100mL 1X TAE) or Metaphor Agarose
Method:
- RNA Isolation: Lyse cells in TRIzol. Add chloroform (0.2mL per 1mL TRIzol), shake, centrifuge. Transfer aqueous phase, precipitate RNA with isopropanol, wash with 75% ethanol.
- DNase Treatment: Treat 1µg RNA with DNase I for 15 min at RT. Inactivate at 65°C for 10 min.
- Reverse Transcription: Synthesize cDNA using oligo(dT) or random hexamers.
- PCR Amplification: Set up 25µL reaction: 1µL cDNA, 0.5µM each primer, 200µM dNTPs, 1U polymerase. Cycle: 94°C 3min; (94°C 30s, 60°C 30s, 72°C 1min) x 35 cycles; 72°C 7min.
- Gel Analysis: Load products on 3% gel. Run at 100V for 45-60 min. Image; spliced (XBP1s) band is ~26bp smaller than unspliced (XBP1u).
Protocol 2: Monitoring ER Stress in vivo via Plasma-Based ELISA
Objective: To quantify circulating biomarkers (e.g., FGF21, GDF15) from mouse plasma as a non-invasive efficacy readout.
Reagents:
- EDTA-coated microtainer tubes
- Protease inhibitor cocktail
- Species-specific ELISA kit (e.g., Mouse FGF21 Quantikine ELISA)
- Microplate reader capable of 450nm measurement
Method:
- Blood Collection: Draw blood via approved method (e.g., submandibular) directly into EDTA tube. Invert gently.
- Plasma Separation: Centrifuge at 2000 x g for 10 min at 4°C. Immediately transfer supernatant (plasma) to a fresh tube on ice containing protease inhibitors (1:100 dilution).
- Clarification: Centrifuge again at 10,000 x g for 5 min to remove platelets. Aliquot and freeze at -80°C.
- ELISA: Follow kit instructions. Critical: Dilute plasma samples 1:2 to 1:5 in the provided calibrator diluent to overcome matrix effects. Run all samples and standards in duplicate.
- Analysis: Calculate concentration using a 4-parameter logistic curve fit from the standard curve.
The Scientist's Toolkit: Research Reagent Solutions
Table 3: Essential Reagents for ER Stress & Misfolding Biomarker Research
| Reagent / Kit | Primary Function | Example Product/Catalog | Key Application Note |
|---|---|---|---|
| Thapsigargin | SERCA pump inhibitor; induces ER Ca²⁺ depletion and robust UPR. | Sigma Aldrich, T9033 | Standard positive control. Use 0.1-2µM for 6-24h. Aliquot in DMSO, store at -20°C. |
| Tunicamycin | N-linked glycosylation inhibitor; induces ER protein misfolding. | Cayman Chemical, 11445 | Potent ATF6/PERK activator. Use 1-10µg/mL for 6-18h. Toxic; handle with care. |
| ATF6 Reporter Kit | Luciferase construct with ATF6 response elements. | Takara, 631843 | Measures ATF6 transcriptional activity. Normalize with co-transfected Renilla. |
| Mouse FGF21 ELISA | Quantifies circulating ER stress hormone. | R&D Systems, MF2100 | Sensitive in vivo efficacy biomarker. Requires 1:2 plasma dilution. |
| ER-Tracker Dyes | Live-cell staining of the endoplasmic reticulum. | Thermo Fisher, E34250 | Use for high-content imaging of ER morphology. Avoid fixatives. |
| CellTiter-Glo 2.0 | Luminescent assay for cell viability (ATP). | Promega, G9242 | Critical for correlating biomarker changes with cytotoxicity. |
| Proteostat Assay | Detects aggregated protein in cells/lysates. | Enzo, ENZ-51023 | Fluorescent-based readout of protein aggregation burden. |
Visualizations
Title: The Three Branches of the Unfolded Protein Response
Title: Translational Biomarker Pipeline from Bench to Clinic
Technical Support Center for Protein Folding & ER Stress Research
FAQs & Troubleshooting Guides
Q1: In my cell-based assay monitoring ER stress via the unfolded protein response (UPR), I am not seeing XBP1 splicing upon tunicamycin treatment. What could be wrong? A: This is a common protocol failure. Follow this troubleshooting guide:
- Confirm Tunicamycin Activity: Use a positive control like Thapsigargin (1-2 µM, 6h), which induces ER stress via a different mechanism (SERCA inhibition).
- Optimize Tunicamycin Dose/Time: Tunicamycin efficacy is cell-line dependent. Perform a dose-response (0.1-10 µg/mL) and time-course (2-24h) experiment. Start with 2 µg/mL for 6 hours.
- Check RNA Integrity: Use a standard RT-PCR (not just qPCR) to visualize both spliced (sXBP1) and unspliced (uXBP1) bands. Poor RNA quality or cDNA synthesis will prevent detection.
- Validate Primers: Ensure your primers flank the 26-nucleotide intron removed by IRE1α. Run a positive control cDNA sample known to express sXBP1.
Q2: My protein aggregation assay (e.g., Filter Trap or Sarkosyl insolubility) shows high background signal in the untreated control. How can I reduce this? A: High background often indicates cellular debris or non-specific trapping.
- Troubleshooting Steps:
- Lysis Stringency: Increase detergent concentration (e.g., 1-2% SDS) in your lysis buffer and ensure vigorous, consistent vortexing/shearing.
- Centrifugation: After initial low-speed spin to clear nuclei (1,000 x g), perform a high-speed clarification step (16,000 x g, 10 min, 4°C) to remove membrane fragments.
- Wash Optimization: For Filter Trap, increase the number of washes with PBS + 0.1% Sarkosyl after sample filtration. For sequential extraction, ensure thorough removal of the Sarkosyl-soluble fraction.
- Protein Load: Reduce the total amount of protein loaded onto the filter/membrane. Overloading is a frequent cause of background.
Q3: When testing a novel pharmacological chaperone, how do I distinguish between enhanced native folding versus simply increased protein degradation? A: You must deploy a complementary assay cascade.
- Experimental Protocol:
- Pulse-Chase Analysis: The gold standard. Pulse cells with ³⁵S-Met/Cys, then chase with cold media in the presence/absence of your compound. Immunoprecipitate your target protein.
- Quantify Fractions: Resolve the immunoprecipitated protein by native PAGE (for folded/oligomeric state) and denaturing SDS-PAGE (for total protein). Compare band intensities over time.
- Inhibit Degradation Pathways: Co-treat with proteasome inhibitor (MG132, 10 µM) or lysosome inhibitor (Chloroquine, 50 µM). If the compound's effect is abolished with MG132, it likely promotes degradation, not folding.
Q4: My animal model (e.g., transgenic for a misfolded protein) is not showing the expected phenotype or biochemical markers of pathology. What should I investigate? A: Phenotypic drift or incomplete penetrance is a significant hurdle.
- Troubleshooting Guide:
- Genotype Verification: Re-confirm the genotype of your colony. Check for genetic drift or contamination.
- Biochemical Endpoints: Beyond histology, perform definitive biochemical assays: Western blot for insoluble protein aggregates (via sequential extraction), measurement of specific UPR markers (p-eIF2α, ATF4, CHOP) in affected tissues.
- Environmental & Age Factors: Ensure housing conditions are consistent. Many protein misfolding phenotypes are age-dependent. Extend the observation period.
- Backcrossing: Consider backcrossing to the original genetic background to re-establish a consistent phenotypic baseline.
Table 1: Notable Failures in Protein Misfolding Clinical Trials
| Drug (Company) | Target/Condition | Phase | Outcome & Key Metric | Proposed Reason for Failure |
|---|---|---|---|---|
| Tafamidis (Pfizer) - earlier high-dose study | Transthyretin Amyloidosis (ATTR) | Phase III (FA/ATTR-001) | Failed co-primary endpoints (6MWD, NIS-LL) at 80 mg/day | Insufficient tissue penetration at tested dose; later success at higher dose (20/80 mg) |
| Semorinemab (Genentech/Roche) | Tau (Alzheimer's Disease) | Phase II (TAURIEL) | Failed to slow cognitive decline (CDR-SB) over 72 weeks | Successful target engagement but insufficient downstream effect on neurodegeneration |
| VER-022 (Verubecestat) (Merck) | BACE1 (Alzheimer's Disease) | Phase III (APECS, EPOCH) | Halted for futility; worsened clinical scores (ADAS-Cog, ADCS-ADL) | Over-inhibition leading to synaptic toxicity and off-target effects |
Table 2: Notable Successes in Protein Misfolding Clinical Trials
| Drug (Company) | Target/Condition | Phase | Outcome & Key Metric | Key to Success |
|---|---|---|---|---|
| Tafamidis (Vyndaqel/Vyndamax) (Pfizer) | Transthyretin Stabilizer (ATTR-CM) | Phase III (ATTR-ACT) | Reduced all-cause mortality by 30% (HR 0.70) vs. placebo over 30 months | Correct dosing, precise kinetic stabilizer of native tetramer, clear biomarker (TTR levels) |
| Patisiran (Onpattro) (Alnylam) | TTR gene silencing (hATTR Amyloidosis) | Phase III (APOLLO) | Improved mNIS+7 score by 34.0 points vs. placebo at 18 months | Novel modality (RNAi) dramatically reduces production of misfolding-prone protein |
| Elivaldogene Autotemcel (Skysona) (bluebird bio) | Gene Therapy for CALD (Adrenoleukodystrophy) | Phase II/III | 72% of patients free of major functional disability (MFD) at 24 mo | Ex vivo gene therapy addresses root cause in hematopoietic cells |
Key Experimental Protocols
Protocol 1: Detecting Protein Aggregates via Sequential Detergent Extraction Purpose: To fractionate cellular protein based on solubility, isolating Sarkosyl-insoluble aggregates.
- Lysis: Wash cell pellets with PBS. Lyse in High-Salt Buffer (50 mM Tris-HCl pH 7.5, 750 mM NaCl, 5 mM EDTA, 1% Triton X-100) with protease inhibitors by pipetting. Incubate 10 min on ice.
- Soluble Fraction: Centrifuge at 16,000 x g for 10 min at 4°C. Transfer supernatant (Triton X-100-soluble fraction) to a new tube.
- Insoluble Wash: Resuspend pellet in High-Salt Buffer + 1% Sarkosyl (not SDS). Sonicate briefly (10% amplitude, 5 sec). Incubate with rotation for 30 min at room temp.
- Aggregate Fraction: Centrifuge at 16,000 x g for 10 min at 22°C. The resulting pellet contains the Sarkosyl-insoluble aggregates. Resuspend in 1x Laemmli SDS-sample buffer for Western blot analysis.
Protocol 2: Monitoring the UPR via ATF6 Luciferase Reporter Assay Purpose: Quantitatively measure activation of the ATF6 branch of the UPR.
- Transfection: Seed HEK293T cells in a 24-well plate. Co-transfect with an ATF6-firefly luciferase reporter plasmid (containing UPRE or ERSE promoters) and a Renilla luciferase control plasmid (e.g., pRL-TK) for normalization.
- Treatment: 24h post-transfection, treat cells with ER stress inducers (e.g., Tunicamycin 2 µg/mL, DTT 5 mM) or your test compound for 6-16h.
- Lysis & Measurement: Aspirate media, wash with PBS, and lyse cells with 1x Passive Lysis Buffer (Promega). Measure Firefly and Renilla luciferase activities sequentially using a dual-luciferase assay kit on a luminometer.
- Analysis: Calculate the ratio of Firefly/Renilla luminescence for each well. Normalize the ratio of treated samples to the untreated control.
Pathway & Workflow Diagrams
The Scientist's Toolkit: Research Reagent Solutions
Table 3: Essential Reagents for Protein Misfolding & ER Stress Research
| Reagent | Category | Primary Function in Research |
|---|---|---|
| Tunicamycin | ER Stress Inducer | N-linked glycosylation inhibitor; classic tool to induce ER stress and the UPR by disrupting protein folding. |
| Thapsigargin | ER Stress Inducer | Non-competitive inhibitor of the SERCA pump; depletes ER calcium stores to induce potent ER stress. |
| 4-Phenylbutyric Acid (4-PBA) | Chemical Chaperone | Small molecule chaperone that stabilizes protein conformation, reduces ER stress, and facilitates trafficking. |
| MG132 / Bortezomib | Proteasome Inhibitor | Blocks the 26S proteasome; used to inhibit ERAD and cause accumulation of ubiquitinated proteins, amplifying stress. |
| Sodium 4-Phenylbutyrate (NaPB) | HDAC Inhibitor / Chaperone | HDAC inhibitor and chemical chaperone; clinical-stage compound shown to reduce aggregation and mitigate ER stress. |
| DTT (Dithiothreitol) | Reducing Agent | Disrupts disulfide bond formation in the ER; used as an acute, strong inducer of ER stress and misfolding. |
| Sarkosyl (N-Lauroylsarcosine) | Detergent | Ionic detergent used to solubilize membranes and prefibrillar species while leaving mature amyloid aggregates insoluble. |
| ISRIB (Integrated Stress Response Inhibitor) | PERK Pathway Inhibitor | Reverses eIF2α phosphorylation effects; used to specifically inhibit the PERK branch of the UPR. |
| TTR Stabilizers (e.g., Diflunisal, Tafamidis) | Kinetic Stabilizer | Small molecules that bind to and stabilize the native tetramer of Transthyretin, preventing its dissociation and misfolding. |
| XBP1 Splicing Reporter Plasmid | Reporter Assay | Genetic tool to specifically monitor IRE1α activation by measuring splicing-dependent luciferase or GFP expression. |
Conclusion
Addressing protein misfolding and ER stress requires a multifaceted strategy that integrates deep mechanistic understanding with precise pharmacological and genetic tools. As outlined, foundational knowledge of the UPR's dual nature is critical for designing interventions that promote adaptive signaling while avoiding apoptotic triggers. Methodological advances now offer targeted ways to manipulate specific UPR arms, yet these approaches must be carefully optimized and validated in physiologically relevant models to overcome challenges of efficacy and specificity. The comparative landscape reveals that no single solution is universally applicable; the choice of strategy—from chemical chaperones to sensor-specific modulators—must be context-dependent, dictated by the specific disease or bioproduction goal. Future directions point towards personalized combinations of therapies, the development of more precise biomarkers for patient stratification, and the continued engineering of robust production hosts. For researchers and drug developers, the convergence of basic cell biology, advanced screening technologies, and translational validation models is paving the way for transformative treatments for a wide spectrum of protein-misfolding associated diseases and for overcoming critical bottlenecks in biomanufacturing.