Enzyme Stability Solutions: Advanced Strategies to Prevent Denaturation and Boost Activity in Biotech & Pharma
This article provides a comprehensive guide for researchers and drug development professionals on addressing enzyme instability and denaturation.
Enzyme Stability Solutions: Advanced Strategies to Prevent Denaturation and Boost Activity in Biotech & Pharma
Abstract
This article provides a comprehensive guide for researchers and drug development professionals on addressing enzyme instability and denaturation. We explore the fundamental mechanisms of structural degradation, review cutting-edge stabilization methodologies and formulation strategies, offer practical troubleshooting and optimization protocols for real-world scenarios, and present robust frameworks for validating enzyme stability and comparing stabilization techniques. This guide synthesizes the latest research to equip scientists with actionable knowledge for enhancing enzyme performance in industrial processes and therapeutic applications.
Understanding Enzyme Instability: The Molecular Basis of Denaturation and Structural Degradation
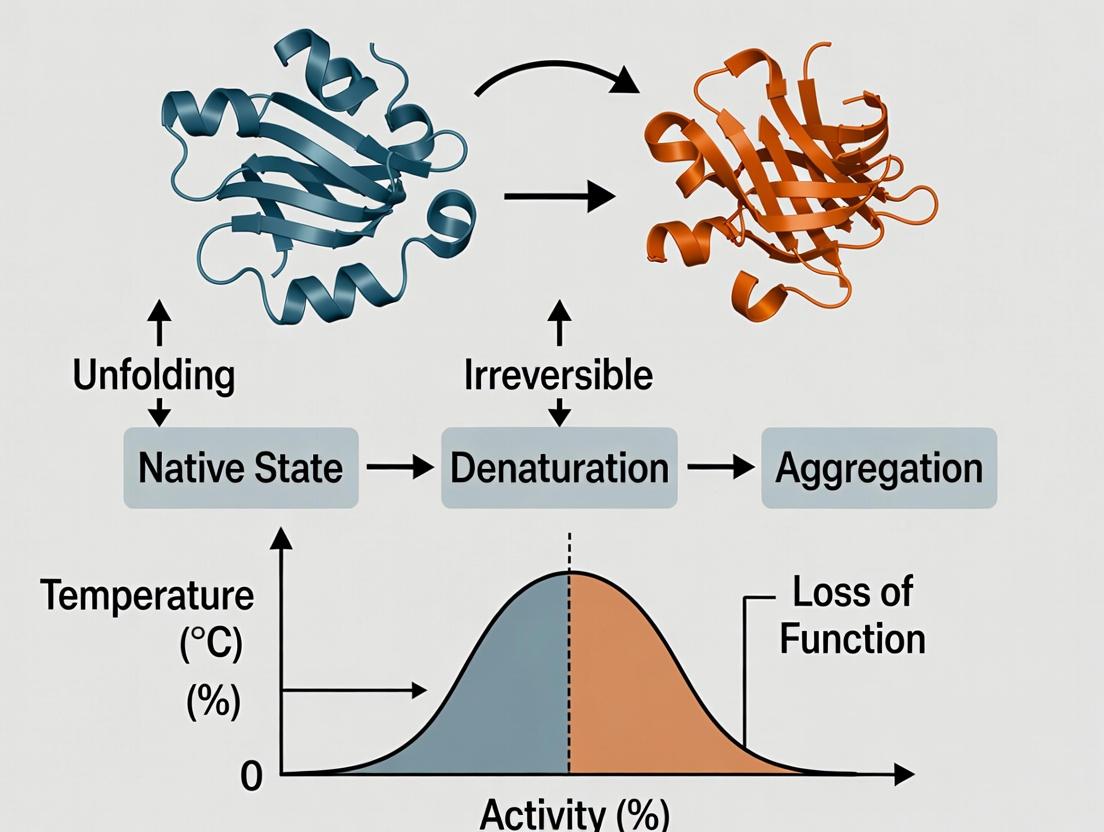
Welcome to the Technical Support Center for Enzyme Stability Research. This resource is framed within our broader thesis on mitigating physical instability and denaturation—the irreversible loss of structure and function—in enzymatic applications for therapeutics and industrial processes. Below are troubleshooting guides and FAQs addressing common experimental challenges.
Troubleshooting Guide & FAQs
FAQ 1: How do I distinguish between reversible instability (e.g., aggregation) and irreversible denaturation during my assay?
- Answer: The key is to test for recoverable activity after removing or reversing the stressor.
- Protocol: Subject your enzyme (e.g., lysozyme) to a stress (e.g., heat shock at 50°C for 10 min). Split the sample.
- Test for Reversibility: Centrifuge one aliquot (15,000 x g, 20 min). Assay activity in the supernatant. Then, gently re-suspend the pellet in a native buffer and assay again.
- Test for Irreversible Denaturation: Dialyze the second aliquot against standard assay buffer to remove the stressor, then assay.
- Interpretation: Recovery of activity in the re-suspended pellet or after dialysis suggests reversible aggregation or unfolding. Permanent activity loss indicates irreversible denaturation.
FAQ 2: My enzyme activity drops sharply in a pH screen. Is it denatured or just transiently inhibited?
- Answer: You must assay after returning to optimal pH.
- Protocol: Incubate enzyme at various pH buffers (pH 3-10) for 1 hour at 4°C. Then, take an aliquot from each condition and dilute it (≥ 1:10) into your standard activity assay buffer at the enzyme's optimal pH. Measure initial velocities.
- Interpretation: If activity is restored, the enzyme was transiently inhibited. If activity remains lost, acid/base-induced denaturation has likely occurred. Use spectroscopic methods (e.g., circular dichroism) to confirm structural loss.
FAQ 3: How do I quantify the extent of denaturation in my stored enzyme sample?
- Answer: Combine activity assays with structural probes. The following table summarizes quantitative metrics:
Table 1: Quantitative Measures of Enzyme Instability and Denaturation
| Metric | Method | Native State Value | Denatured State Indicator | Typical Threshold for "Denatured" |
|---|---|---|---|---|
| Residual Activity | Kinetic assay (e.g., Michaelis-Menten) | 100% | <10% | Loss >90% of initial specific activity |
| Thermal Melting Point (Tm) | Differential Scanning Calorimetry (DSC) | Sharp, high Tm peak (e.g., 55°C) | Lower Tm, broad peak | ΔTm > 10°C decrease from control |
| Aggregate Content | Size-Exclusion Chromatography (SEC) | >95% monomeric peak | Increased high-molecular-weight peaks | >10% aggregates/subvisible particles |
| Secondary Structure Loss | Circular Dichroism (CD) at 222 nm | High ellipticity | Signal attenuation | >50% loss of mean residue ellipticity |
| Surface Hydrophobicity | ANS Fluorescence Probe | Low fluorescence | High fluorescence intensity | >5-fold increase in ANS fluorescence |
Experimental Protocol: Assessing Thermal Denaturation
Title: Protocol for Determining Thermal Denaturation Midpoint (Tm) via Intrinsic Fluorescence.
Methodology:
- Prepare enzyme in a stable buffer (e.g., 20 mM phosphate, pH 7.0). Filter (0.22 µm).
- Use a fluorometer with a thermal Peltier controller. Set excitation to 280 nm (Trp/Tyr) and emission to 320-350 nm.
- Equilibrate at 20°C. Record initial fluorescence (F0).
- Ramp temperature from 20°C to 80°C at a rate of 1°C/min, continuously recording fluorescence (F).
- Plot normalized fluorescence (F/F0) vs. Temperature.
- Fit the sigmoidal curve to a Boltzmann function. The inflection point is the Tm.
Visualization: Enzyme Denaturation Pathways & Assay Workflow
Title: Enzyme Denaturation Pathways Under Stress
Title: Troubleshooting Workflow for Enzyme Loss
The Scientist's Toolkit: Research Reagent Solutions
Table 2: Essential Reagents for Enzyme Stability Studies
| Reagent / Material | Function & Rationale |
|---|---|
| Thermophilic Enzyme (e.g., Taq Polymerase) | Positive control for thermal stability studies; provides a high-Tm benchmark. |
| Chaotrope (e.g., Guanidine HCl, Urea) | Induces controlled unfolding to create denaturation curves and study refolding. |
| Hydrophobic Probe (e.g., ANS, Sypro Orange) | Binds exposed hydrophobic patches on unfolded proteins, enabling fluorescence detection of unfolding. |
| Size-Exclusion Chromatography (SEC) Standards | Monodisperse proteins of known MW to calibrate columns and quantify aggregate formation. |
| Stabilizing Excipients (e.g., Trehalose, Sucrose) | Preferentially excluded cosolvents that stabilize the native state by thermodynamic mechanisms. |
| Protease Inhibitor Cocktail (e.g., EDTA, PMSF) | Prevents proteolytic degradation during stability assays, isolating physical denaturation causes. |
| Spectrophotometric Cuvettes (Stirred, Thermostatted) | Allows for continuous monitoring of spectral changes (CD, fluorescence) under controlled stress. |
Troubleshooting Guides & FAQs
Q1: My enzyme activity dropped sharply after incubation. How do I determine if thermal denaturation is the cause? A: A sharp, often irreversible, loss of activity after incubation is a classic sign of thermal denaturation. To troubleshoot:
- Perform a Temperature Stability Assay: Incubate separate aliquots of your enzyme at a range of temperatures (e.g., 4°C, 25°C, 37°C, 45°C, 55°C, 65°C) for a fixed time (e.g., 30 minutes). Rapidly cool them on ice, then measure residual activity under standard assay conditions.
- Analyze the Data: Plot % residual activity vs. temperature. A sharp inflection point indicates the melting temperature (Tm). Compare the incubation temperature from your experiment to the Tm.
- Confirm with Spectroscopy: Use circular dichroism (CD) spectroscopy to monitor changes in secondary structure (alpha-helix, beta-sheet) at the suspect temperature.
Q2: My enzyme preparation is forming aggregates. Could shear force from pipetting or mixing be responsible? A: Yes, especially for large, multi-subunit, or partially unfolded enzymes. Shear forces can cause localized unfolding and expose hydrophobic regions, leading to aggregation.
- Minimize Mechanical Stress: Avoid vortexing; instead, mix by gentle inversion or slow pipetting. Use wide-bore or low-binding pipette tips.
- Add Stabilizers: Include mild stabilizing agents like glycerol (5-10%) or polysorbate 20 (0.01%) in your buffers to protect against shear.
- Test the Hypothesis: Compare activity and aggregation (via dynamic light scattering or native PAGE) in samples subjected to vigorous mixing vs. gentle handling.
Q3: I see a precipitate when I adjust the pH of my enzyme buffer. What happened and can I recover the enzyme? A: Precipitation indicates the enzyme's isoelectric point (pI) has been reached, where net charge is zero and solubility is minimal, often leading to denaturation.
- Identify the pI: Check the protein's documented pI. Avoid buffering within ±1.5 pH units of this value.
- Prevention: Always adjust pH slowly with dilute acid/base while the enzyme solution is on ice and mixing gently.
- Recovery Attempt: If precipitation occurs, immediately return to a safe pH (e.g., back to the original storage pH) and incubate on ice. Centrifuge to remove precipitate and assay the supernatant for activity. Recovery is often partial.
Q4: How can I quickly screen for the best pH and temperature conditions for a new enzyme? A: Use a matrix-based activity assay.
- Prepare a master mix of enzyme and substrate (if stable).
- Dispense into wells of a plate pre-loaded with buffers covering a pH range (e.g., pH 3-9).
- Run the plate reader at a gradient of temperatures or incubate separate plates at different set temperatures.
- Measure initial velocity. Plot activity as a 2D heatmap (pH vs. Temperature) to identify the optimum zone.
Table 1: Representative Melting Temperatures (Tm) of Enzymes Under Various Conditions
| Enzyme Class | Example Enzyme | Baseline Tm (°C) | Tm with 10% Glycerol (°C) | Tm at Optimal pH vs. +2 pH units shift (°C change) |
|---|---|---|---|---|
| Glycoside Hydrolase | Lysozyme | 72 | 78 | 72 vs. 58 (Δ -14) |
| Protease | Trypsin | 55 | 62 | 55 vs. 49 (Δ -6) |
| Polymerase | Taq Polymerase | 80-85 | >95 (est.) | N/A |
| Oxidoreductase | Lactate Dehydrogenase | 62 | 68 | 62 vs. 54 (Δ -8) |
Table 2: Critical Shear Stress Thresholds Leading to Activity Loss
| Enzyme Form | Molecular Weight | Critical Shear Stress (N/m²) | Observed Effect |
|---|---|---|---|
| Monomeric, Globular | ~50 kDa | >1000 | Minimal loss (<5%) |
| Multimeric, Native | ~250 kDa | 50-200 | Subunit dissociation, ~30% loss |
| Partially Unfolded | N/A | 10-50 | Aggregation, >70% loss |
Experimental Protocols
Protocol 1: Determining Thermal Melting Temperature (Tm) via CD Spectroscopy Objective: Quantify the temperature at which an enzyme loses 50% of its secondary structure. Materials: See "The Scientist's Toolkit" below. Method:
- Dialyze purified enzyme into a low-absorbance buffer (e.g., 10 mM potassium phosphate, pH 7.0).
- Load sample into a quartz CD cuvette (path length 0.1 cm). Adjust protein concentration for an optimal signal (typically 0.1-0.2 mg/mL).
- Set the CD spectrophotometer to scan at 222 nm (for alpha-helix) or 215 nm (for beta-sheet).
- Ramp temperature from 20°C to 90°C at a rate of 1°C per minute, continuously recording the CD signal (ellipticity).
- Plot mean residue ellipticity (θ) vs. Temperature. Fit the data to a sigmoidal curve. The Tm is the midpoint of the transition.
Protocol 2: Assessing Shear Sensitivity via Stirring Stress Test Objective: Empirically determine an enzyme's susceptibility to shear-induced denaturation. Materials: Magnetic stirrer, small stir bars, microcentrifuge tubes, activity assay reagents. Method:
- Prepare identical aliquots of the enzyme in its storage buffer.
- Place tubes on a magnetic stirrer. Set different stirring speeds (e.g., 0, 500, 1000, 1500 rpm) for a fixed duration (e.g., 30 minutes). Keep samples at constant temperature (e.g., 4°C).
- Stop stirring. Immediately remove an aliquot from each tube and assay for enzymatic activity.
- Plot % initial activity vs. applied stirring speed/rpm. A sharp decline indicates high shear sensitivity.
Visualizations
Title: Thermal Denaturation Pathway of Enzymes
Title: pH Impact on Enzyme Charge & Stability
Title: Enzyme Instability Troubleshooting Decision Tree
The Scientist's Toolkit: Research Reagent Solutions
| Item | Function in Stability Research |
|---|---|
| Glycerol (20% stock) | Cryoprotectant and kosmotrope. Reduces molecular mobility and strengthens water structure, stabilizing native fold against thermal and shear stress. |
| Polysorbate 20/80 | Non-ionic surfactant. Coats protein surfaces, minimizing aggregation at interfaces and from shear-induced unfolding. |
| HEPES, Tris, Phosphate Buffers | Maintain pH within optimal range. Good buffering capacity at biological pH prevents local shifts during reactions. |
| Circular Dichroism (CD) Spectrophotometer | Key instrument for monitoring secondary and tertiary structural changes in real-time during thermal or chemical denaturation. |
| Dynamic Light Scattering (DLS) Instrument | Measures hydrodynamic radius and polydispersity. Critical for detecting early aggregation events before precipitation. |
| Differential Scanning Calorimetry (DSC) | Directly measures heat capacity changes during thermal unfolding, providing precise Tm and denaturation enthalpy (ΔH). |
| Low-Binding Pipette Tips & Tubes | Minimize surface adsorption losses, especially critical for low-concentration enzymes and when assessing shear effects. |
| Trehalose or Sucrose | Excipients that form a stabilizing glassy matrix, preferentially excluded from protein surface, enhancing thermodynamic stability. |
Technical Support Center
Troubleshooting Guide: Common Experimental Issues in Enzyme Stability Research
Issue 1: Unexpected Loss of Enzyme Activity During Thermal Shift Assays
- Problem: Measured Tm (melting temperature) is significantly lower than literature values, or the unfolding curve shows multiple transitions.
- Diagnosis: This often indicates partial denaturation prior to the assay, buffer incompatibility, or the presence of residual chelators.
- Solution: Ensure fresh protein purification, dialyze into assay buffer without EDTA, and include a reducing agent if cysteines are present. Perform a control with a known stabilizer (e.g., 100 mM NaCl) to validate the setup.
Issue 2: Inconsistent Results from Hydrogen-Deuterium Exchange Mass Spectrometry (HDX-MS)
- Problem: Poor deuterium uptake reproducibility or high back-exchange, obscuring local motif dynamics.
- Diagnosis: Inconsistent quench conditions, pH fluctuations, or poor chromatography column performance.
- Solution: Strictly control quench temperature (0°C) and pH (2.5). Use freshly prepared guanidinium chloride in the quench. Regularly clean and validate the LC-MS system with a standard peptide mix.
Issue 3: High Background in Förster Resonance Energy Transfer (FRET) Denaturation Studies
- Problem: Low signal-to-noise ratio when monitoring distance changes between donor and acceptor dyes.
- Diagnosis: Non-specific dye labeling, inadequate purification of labeled protein, or dye photobleaching.
- Solution: Optimize labeling stoichiometry and use size-exclusion chromatography post-labeling. Include oxygen scavenging systems in the assay buffer and minimize exposure to excitation light.
Frequently Asked Questions (FAQs)
Q1: What are the first spectroscopic signs of local motif disruption in a multi-domain enzyme? A: Circular Dichroism (CD) spectroscopy in the near-UV region (250-320 nm) is most sensitive to changes in aromatic side-chain packing, often an early sign of tertiary structure perturbation in a specific domain before global secondary structure loss (observed in far-UV CD, 190-250 nm).
Q2: Which technique is best for quantifying the population of partially unfolded states during the cascade? A: Native Mass Spectrometry coupled with Ion Mobility (Native IM-MS) is excellent for separating and quantifying populations of folded, partially unfolded, and collapsed monomers in solution under non-denaturing conditions.
Q3: How can I distinguish between cooperative global collapse and a sequential domain-by-domain unfolding? A: Differential Scanning Calorimetry (DSC) provides a direct measurement of unfolding cooperativity. A single sharp transition peak suggests highly cooperative unfolding, while multiple resolved peaks indicate independent domain unfolding. Complementary multi-parametric Single-Molecule FRET can visualize the sequence of events.
Q4: What are the recommended positive and negative controls for a denaturation kinetics experiment? A:
- Positive Control (Stable protein): Use a well-characterized, hyper-stable enzyme like bovine pancreatic ribonuclease A (RNase A) or a thermophilic homolog of your enzyme.
- Negative Control (Unstable protein): Use an enzyme with a known destabilizing point mutation in a critical folding motif, or incubate your wild-type enzyme with a chelator if it's a metalloprotein.
Table 1: Common Biophysical Techniques for Monitoring Unfolding Cascades
| Technique | What it Measures | Key Parameter(s) | Typical Time Resolution | Information Level |
|---|---|---|---|---|
| Differential Scanning Fluorimetry (DSF) | Thermal unfolding | Tm (Melting Temp), ΔH | Minutes | Global stability |
| Circular Dichroism (CD) | Secondary & Tertiary Structure | Mean Residual Ellipticity ([θ]) | Seconds | Global & Local structure |
| Static Light Scattering (SLS) | Oligomeric State & Aggregation | Radius of Gyration (Rg) | Seconds | Global conformation/aggregation |
| Hydrogen-Deuterium Exchange MS (HDX-MS) | Solvent Accessibility & Dynamics | Deuteration % per peptide | Seconds to Hours | Local motif resolution |
| Stopped-Flow Fluorescence | Unfolding/Refolding Kinetics | Rate Constants (k_obs) | Milliseconds | Kinetic intermediates |
Table 2: Example Stabilizing Agents and Their Observed Effects on Model Enzyme (Lysozyme)
| Agent Class | Specific Agent | Concentration | Observed ΔTm (°C) | Proposed Primary Mechanism |
|---|---|---|---|---|
| Osmolyte | Trehalose | 0.5 M | +4.2 | Preferential hydration, strengthens H-bonds |
| Salt | Potassium Sulfate | 100 mM | +3.1 | Shields charged groups, anion-specific |
| Co-solvent | Glycerol | 20% v/v | +2.5 | Increases solvent viscosity, dampens dynamics |
| Pharmacologic Chaperone | N-Acetylglucosamine | 5 mM | +6.8 | Binds active site, stabilizes native fold |
Detailed Experimental Protocols
Protocol 1: Fast-Kinetics Stopped-Flow Circular Dichroism to Capture Early Unfolding Objective: To measure the rapid loss of secondary structure following a rapid jump to denaturing conditions. Materials: Stopped-flow instrument with CD module, purified enzyme (>95%), native buffer, denaturant stock (e.g., 8M Urea). Method:
- Load one syringe with enzyme in native buffer (final conc. ~0.2 mg/mL).
- Load second syringe with native buffer containing concentrated denaturant (e.g., calculated to achieve 4M Urea final upon mixing).
- Set CD wavelength to 222 nm (α-helix) or 215 nm (β-sheet).
- Rapidly mix equal volumes (typical dead time ~1-10 ms) and record ellipticity change over time (0.001 to 10 s).
- Fit the resulting kinetic trace to a mono- or multi-exponential model to extract apparent rate constants.
Protocol 2: HDX-MS to Map Local Motif Disruption Objective: To identify regions of the enzyme that become solvent-accessible early in the denaturation cascade. Materials: LC-MS system with pepsin column, deuterated buffer (pD 7.0), quench buffer (0.1% formic acid, 4°C). Method:
- Labeling: Dilute enzyme 10-fold into D₂O-based buffer. Incubate for varying timepoints (10s, 1min, 10min, 1hr) at 25°C.
- Quench: At each timepoint, mix 50 µL labeling reaction with 50 µL ice-cold quench buffer (pH 2.5) to reduce pH and temperature, slowing exchange.
- Digestion & Analysis: Immediately inject onto immobilized pepsin column (2°C) for rapid digestion (<1 min). Desalt peptides online and analyze by high-resolution MS.
- Data Processing: Use software (e.g., HDExaminer) to calculate deuteration level for each peptide over time. Peptides showing fast, early deuteration indicate locally disrupted motifs.
Visualization: Experimental Pathways and Relationships
Diagram 1: The Unfolding Cascade & Detection Methods
Diagram 2: HDX-MS Experimental Workflow
The Scientist's Toolkit: Key Research Reagent Solutions
Table 3: Essential Reagents for Enzyme Stability Research
| Item | Function in Experiment | Key Considerations |
|---|---|---|
| Ultra-Pure Guanidine HCl / Urea | Chemical denaturant for equilibrium and kinetic unfolding studies. | Check for absence of cyanate (urea) or ionic impurities (GdnHCl); use fresh solutions. |
| SYPRO Orange / Nile Red Dye | Environment-sensitive fluorescent probes for DSF thermal scans. | Dye stock concentration is critical; optimize for each protein to avoid signal saturation. |
| Deuterium Oxide (D₂O, 99.9%) | Solvent for HDX-MS to allow H/D exchange measurement. | Store under inert atmosphere; account for pD (pH + 0.4). |
| Size-Exclusion Chromatography (SEC) Resins | Purification of natively folded protein and removal of aggregates post-stress. | Choice of resin (e.g., Superdex, Sephacryl) depends on protein size range. |
| Stabilizer/Cofactor Library | Small molecules, salts, and cofactors to test for stabilization effects. | Use a plate-based DSF screen to efficiently identify hits. |
| Protease (Pepsin) Immobilized Column | For rapid, low-pH digestion in HDX-MS workflows. | Must be kept cold (2°C) and used with appropriate flow rate for efficiency. |
Troubleshooting Guides & FAQs
Q1: My target enzyme shows a sudden, irreversible loss of activity after purification and concentration. What are the most likely causes and how can I diagnose them? A: The most likely cause is non-native aggregation driven by protein-protein interactions (PPIs). This often occurs during concentration steps or buffer exchange. Diagnose by:
- Dynamic Light Scattering (DLS): Check for a polydisperse sample or large hydrodynamic radius (>10 nm for a typical monomeric enzyme).
- Size-Exclusion Chromatography (SEC): Look for high-molecular-weight shoulders or peaks eluting in the void volume.
- Native PAGE: Observe smearing or high-molecular-weight bands.
- Spectroscopic Probes: Use Thioflavin T (for amyloid-like structures) or ANS (for exposed hydrophobic patches) to confirm aggregation-prone states.
Q2: My protein is prone to aggregation during storage. What formulation strategies can I use to improve stability? A: Formulation is critical to prevent aggregation. Key strategies include:
- Optimize Buffer Conditions: Increase ionic strength to shield electrostatic attractions, or use specific ions (e.g., sulfate, citrate) that are stabilizing.
- Add Excipients: Include non-reducing sugars (e.g., trehalose, sucrose >0.2 M), polyols (e.g., sorbitol), or specific amino acids (e.g., arginine, glycine) to preferentially hydrate and stabilize the native state.
- Use Surfactants: Add low concentrations (e.g., 0.01-0.05% w/v) of non-ionic surfactants like polysorbate 20/80 to compete at air-water interfaces and prevent surface-induced aggregation.
Q3: How can I distinguish between functional oligomerization and pathological aggregation in my experiments? A: Use a combination of functional and structural assays:
| Assay | Functional Oligomer | Pathological Aggregate |
|---|---|---|
| SEC-MALS | Defined, monodisperse peak. | Polydisperse, high Mw. |
| Activity Assay | Specific activity retained or regulated. | Specific activity irreversibly lost. |
| Kinetics of Formation | Reaches equilibrium. | Often irreversible, time-dependent. |
| Protease Sensitivity | Defined cleavage pattern. | Heterogeneous, often resistant. |
| EM/Microscopy | Uniform particles. | Amorphous or fibrillar structures. |
Q4: What experimental protocols can I use to monitor aggregation kinetics in real-time? A: Protocol for Real-Time Aggregation Monitoring via Static Light Scattering (SLS)
- Objective: Quantify the increase in high-molecular-weight species over time under stress conditions.
- Materials: Purified protein, microplate reader with temperature control and ability to read at >320 nm, 96-well or 384-well plates (preferably with non-binding surface).
- Procedure: a. Prepare protein samples at desired concentration (e.g., 0.1-1 mg/mL) in relevant buffer. Include stabilizing and destabilizing conditions. b. Add samples to plate (50-100 µL/well). Seal plate to prevent evaporation. c. Place plate in pre-equilibrated reader (e.g., 37°C or higher for accelerated studies). d. Measure scattered light intensity at 350 nm or 600 nm every 2-5 minutes for 12-48 hours with brief shaking before each read. e. Plot intensity vs. time. The lag time, growth rate, and plateau can be extracted to compare conditions.
Q5: Which signaling pathways are implicated in the cellular handling of protein aggregates, and how can I model them in vitro? A: The primary pathways are the Ubiquitin-Proteasome System (UPS) and Autophagy-Lysosome Pathway (ALP). In vitro, you can model the initial recognition steps.
Diagram 1: Cellular aggregate clearance pathways
The Scientist's Toolkit: Key Research Reagent Solutions
| Reagent/Material | Function in Studying Aggregation |
|---|---|
| Thioflavin T (ThT) | Fluorescent dye that binds cross-β-sheet structures in amyloid-type aggregates. Use at 10-20 µM for kinetic assays. |
| 8-Anilino-1-naphthalenesulfonic acid (ANS) | Polarity-sensitive fluorescent probe that binds exposed hydrophobic clusters on misfolded/aggregation-prone proteins. |
| DTT / TCEP (Reducing Agents) | Break disulfide bonds to test if aggregation is driven by improper covalent crosslinking. |
| Trehalose | Stabilizing excipient. Preferentially excludes from protein surface, stabilizing native fold and inhibiting aggregation. Use at 0.2-0.5 M. |
| L-Arginine Hydrochloride | Common additive (0.1-0.5 M) to suppress protein-protein interactions and non-specific aggregation during refolding or storage. |
| Polysorbate 20/80 (Tween) | Non-ionic surfactant. Competes for interfaces (air-water, vial surface) to prevent adsorption and interface-induced denaturation/aggregation. |
| Size-Exclusion Chromatography (SEC) Standards | High and low molecular weight protein standards for column calibration to identify aggregate peaks. |
| Cross-linking Reagents (e.g., BS3, glutaraldehyde) | Chemically "freeze" transient PPIs for analysis by SDS-PAGE or mass spectrometry to identify early oligomeric species. |
Diagram 2: Key experiments for aggregation analysis
Technical Support Center
FAQ & Troubleshooting Guide
Q1: My Circular Dichroism (CD) spectrum shows excessive noise, making the signal unreliable. What could be the cause?
- A: Excessive noise in CD spectra is commonly due to high absorbance from the sample buffer or cell pathlength issues. Ensure the total absorbance (including buffer components) at the working wavelength is below 1.5 AU. For far-UV CD, use a shorter pathlength cell (e.g., 0.1 mm or 0.2 mm) and ensure it is scrupulously clean. Check and purge the instrument with high-purity nitrogen for longer periods, especially for signals below 200 nm. Always subtract a meticulously matched buffer baseline.
Q2: During Differential Scanning Calorimetry (DSC), my protein shows no clear thermal transition peak. Why might this happen?
- A: A missing transition peak indicates that the observed enthalpy change is below the instrument's detection limit. This can occur if the protein concentration is too low (<0.5 mg/mL) or if the protein is already unfolded/aggregated prior to the run. Increase protein concentration if solubility allows. Check sample integrity via a complementary technique (e.g., SEC, DLS) before the DSC experiment. Ensure the scan rate is appropriate (e.g., 1-2 °C/min for higher resolution).
Q3: My fluorescence emission spectrum shows an unexpected shift or intensity change after repeated scanning of the same sample. What is happening?
- A: This is likely due to photobleaching, where the fluorophore (intrinsic tryptophan or added dye) is degraded by the excitation light. To mitigate, reduce the excitation slit width, use a faster scan speed, or employ a cut-off filter to minimize light exposure. Always use a fresh sample aliquot for critical measurements and shield the sample from ambient light when preparing.
Q4: The DSC thermogram for my enzyme shows multiple overlapping transitions. How can I deconvolute this data?
- A: Multiple transitions suggest a multi-domain protein where domains unfold independently. Use the instrument's software (e.g., NanoAnalyze for TA Instruments, CpCalc for MicroCal) to perform a non-two-state fit. This model assumes independent transitions and fits the data to individual transitions, providing apparent Tm and ΔH for each domain. Verify the fit quality by the residual plot.
Q5: In fluorescence spectroscopy, I observe inner filter effects. How do I correct for them?
- A: Inner filter effects occur when the sample absorbance at the excitation or emission wavelength is >0.1, attenuating the signal. The primary correction is to dilute the sample to an absorbance (at λex) < 0.1. If dilution is not possible, apply the inner filter effect correction formula: Fcorr = Fobs * antilog10[(Aex + Aem)/2], where Aex and Aem are the absorbances at the excitation and emission wavelengths, respectively.
Experimental Protocols
Protocol 1: Far-UV CD for Secondary Structure Assessment of an Enzyme
- Buffer Preparation: Use a low-absorbance buffer (e.g., 10 mM phosphate, pH 7.4). Filter through a 0.22 µm membrane.
- Sample Preparation: Dialyze the enzyme exhaustively against the measurement buffer. Determine concentration accurately (A280). Dilute to an optimal concentration (e.g., 0.1-0.2 mg/mL for a 0.1 mm pathlength cell) to keep high-tension voltage < 700V.
- Data Acquisition: Load sample into a quartz CD cell of appropriate pathlength (0.1 mm). Set instrument parameters: wavelength range 260-180 nm, step size 0.5 nm, bandwidth 1 nm, averaging time 1-2 seconds. Acquire spectrum at 20°C. Perform baseline subtraction with buffer alone.
- Analysis: Smooth data if necessary (Savitzky-Golay). Convert raw ellipticity (mdeg) to mean residue ellipticity [θ]. Analyze using deconvolution algorithms (e.g., CONTIN, SELCON3) via online servers (DICHROWEB).
Protocol 2: DSC for Thermal Stability Profiling
- Sample Preparation: Dialyze protein and reference buffer (from the final dialysis) identically. Degas both sample and buffer for 10-15 minutes under mild vacuum to prevent bubbles.
- Loading: Carefully load >400 µL of sample and reference into the calorimeter cells using a precision syringe, avoiding bubbles.
- Method Setup: Set a temperature scan range from 20°C to at least 20°C past the expected Tm. Use a scan rate of 1.5 °C/min and a filtering period of 2 seconds. Ensure adequate pre-scan thermostat time (10-15 min).
- Data Processing: After the run, subtract the buffer-buffer baseline run. Normalize the thermogram for concentration. Fit the baseline and integrate the peak to obtain the calorimetric enthalpy (ΔH_cal). Determine Tm at the peak maximum.
Protocol 3: Intrinsic Tryptophan Fluorescence for Tertiary Structure Monitoring
- Sample Prep: Prepare enzyme sample in a non-fluorescent buffer at A280 < 0.1 to avoid inner filter effects.
- Instrument Setup: Set excitation wavelength to 295 nm (to selectively excite tryptophan). Set emission scan from 310 nm to 400 nm. Use slit widths of 2.5-5 nm.
- Acquisition: Place sample in a quartz cuvette (pathlength 10 mm). Record emission spectrum. For thermal scans, use a Peltier-controlled cell holder to increase temperature incrementally, allowing equilibration at each step before scanning.
- Analysis: Plot fluorescence intensity at λmax (or the ratio of intensities at two wavelengths, e.g., 350/330 nm) versus temperature or denaturant concentration to generate a unfolding curve. Fit to a suitable model (e.g., two-state) to derive thermodynamic parameters.
Data Summary Tables
Table 1: Typical Experimental Parameters for Structural Techniques
| Technique | Key Parameter | Typical Value/Range | Purpose/Note |
|---|---|---|---|
| CD Spectroscopy | Pathlength | 0.1 mm (Far-UV), 10 mm (Near-UV) | Controls absorbance to prevent signal distortion. |
| Protein Concentration | 0.1-0.5 mg/mL (Far-UV) | Optimizes signal-to-noise. | |
| Data Pitch | 0.5 nm | Determines spectral resolution. | |
| DSC | Scan Rate | 1.0 - 2.0 °C/min | Balances detection sensitivity & thermal equilibrium. |
| Protein Concentration | 0.5 - 2.0 mg/mL | Ensures sufficient heat signal. | |
| Cell Volume | ~0.5 mL | Standard for most commercial instruments. | |
| Fluorescence | Excitation Slit | 2.5 - 5 nm | Controls intensity & photobleaching rate. |
| A280 (Sample) | < 0.1 | Minimizes inner filter effects. | |
| λex (Intrinsic) | 295 nm | Selective for Trp over Tyr. |
Table 2: Diagnostic Spectral Changes Indicative of Instability/Denaturation
| Technique | Observation (vs. Native State) | Structural Implication |
|---|---|---|
| Far-UV CD | Loss of negative ellipticity at 222 nm & 208 nm. | Loss of α-helical content. |
| Shift or flattening of minimum. | General loss of ordered secondary structure. | |
| DSC | Decrease in Tm value. | Decreased thermal stability. |
| Decrease in ΔH_cal. | Loss of cooperative unfolding (may indicate aggregation). | |
| Broadening of transition peak. | Increase in unfolding heterogeneity. | |
| Fluorescence | Red shift of λmax (e.g., from 330 nm to 350 nm). | Trp residues becoming more solvent-exposed. |
| Quenching of intensity. | Increased collisional quenching or energy transfer. | |
| Change in spectral shape. | Alteration in local Trp microenvironment. |
The Scientist's Toolkit: Key Research Reagent Solutions
| Item | Function in Structural Interrogation |
|---|---|
| Ultra-Pure Buffers (e.g., Tris, Phosphate) | Provides stable, non-interfering ionic environment for spectroscopy; low UV absorbance is critical. |
| Chaotropes (e.g., Guanidine HCl, Urea) | Used as controlled denaturants in fluorescence or CD titration experiments to measure folding stability. |
| Chemical Denaturant (e.g., GdnHCl) | Induces unfolding; used to determine free energy of unfolding (ΔG°) via equilibrium methods. |
| High-Purity Nitrogen Gas | Essential for purging CD spectrometers to reduce oxygen absorbance and ozone generation below 200 nm. |
| Quartz Cuvettes (Various Pathlengths) | UV-transparent cells for CD (short path) and fluorescence (standard 10 mm) measurements. |
| Dialysis Cassettes / Desalting Columns | For exhaustive buffer exchange into the exact spectroscopic measurement buffer. |
| Syringe Filters (0.22 µm) | For clarifying all solutions (buffers and samples) to remove particulate light-scattering agents. |
Visualizations
Title: Structural Interrogation Workflow for Enzyme Stability
Title: Linking Analytical Techniques to Stability Hypotheses
Stabilization Strategies in Practice: From Rational Design to Advanced Formulation
Technical Support Center
Troubleshooting Guides & FAQs
Q1: My designed mutations for thermostability, based on computational predictions, consistently result in a complete loss of enzymatic activity. What are the primary causes and solutions? A: This is often due to disrupting the active site architecture or critical catalytic residues.
- Cause 1: Mutation in Catalytic or Binding Residues. Your chosen site may be part of the active site. Even distal mutations can allosterically affect the active site.
- Solution: Re-analyze your protein structure using tools like PyMOL or ChimeraX. Map known catalytic residues (from databases like Catalytic Site Atlas) and ensure your mutagenesis targets are >10 Å away. Prioritize surface-exposed, flexible loops and residue clusters.
- Cause 2: Introduction of Excessive Steric Clash or Charge Repulsion.
- Solution: Use structural energy minimization tools (e.g., FoldX, Rosetta) in silico to evaluate the steric and electrostatic compatibility of the mutant before synthesis. Avoid substituting large hydrophobic residues (e.g., Trp, Phe) into charged pockets.
- Cause 3: Destabilization of a Critical Folding Intermediate.
- Solution: Consider targeting different structural elements (e.g., β-turns instead of α-helices). Implement "consensus" or "ancestral" sequence design approaches instead of single-point mutagenesis.
Q2: During the purification of my thermostability mutant, I observe significant protein aggregation and precipitation, even under native conditions. How can I mitigate this? A: This indicates physical instability, likely due to exposed hydrophobic patches or incorrect folding.
- Cause 1: Mutation Creates a Sticky, Partially Unfolded State.
- Solution: Add low concentrations of stabilizing co-solutes (e.g., 0.5 M L-arginine, 10% glycerol) to the lysis and purification buffers. Perform purification at a lower temperature (4°C) to reduce hydrophobic interactions.
- Cause 2: Inefficient Folding After Expression.
- Solution: Optimize expression conditions: reduce induction temperature (e.g., 18°C), use a slower induction (lower IPTG concentration), and ensure adequate aeration. Consider using a solubility-enhancing tag (e.g., MBP, SUMO) and performing on-column cleavage.
- Protocol - Aggregation Mitigation during Ni-NTA Purification:
- Lyse cells in Buffer A+: 50 mM Tris-HCl (pH 8.0), 300 mM NaCl, 10 mM Imidazole, 10% Glycerol, 0.5 M L-arginine, 1 mM DTT, and protease inhibitors.
- Clarify lysate by centrifugation at 20,000 x g for 30 min at 4°C.
- Pre-equilibrate Ni-NTA resin with Buffer A+.
- Perform binding via batch or column method for 1 hour at 4°C with gentle mixing.
- Wash with 10 column volumes (CV) of Buffer B+: 50 mM Tris-HCl (pH 8.0), 500 mM NaCl (increased), 20 mM Imidazole, 10% Glycerol.
- Elute with Buffer C: 50 mM Tris-HCl (pH 8.0), 150 mM NaCl, 250 mM Imidazole, 5% Glycerol.
- Immediately desalt into final storage buffer using a PD-10 column.
Q3: My mutant shows improved thermal stability in the Thermofluor assay (Tm increase of +5°C), but its half-life at a lower, physiologically relevant temperature (e.g., 37°C) is unchanged. Why does this discrepancy occur? A: Thermal melting temperature (Tm) and operational half-life (t1/2) measure different aspects of stability.
- Cause: The mutation may stabilize the final, fully unfolded state but not affect the rate-limiting step of inactivation at lower temperatures, which is often local unfolding or chemical degradation (e.g., deamidation).
- Solution: Complement Tm measurements with long-term stability assays. Incubate the enzyme at 37°C in its operational buffer, taking aliquots over days/weeks to measure residual activity. Use the table below to compare metrics.
Table 1: Comparison of Thermostability Metrics for Mutant vs. Wild-Type (WT) Enzyme
| Metric | WT Enzyme | Mutant V72I | Mutant D185K | Assay Conditions & Interpretation |
|---|---|---|---|---|
| Melting Temp (Tm) | 62.5 °C | 67.8 °C | 61.0 °C | DSF, 0.5 mg/mL protein, pH 7.4. ∆Tm > +2°C is significant. |
| Inactivation Temp (T50) | 58.0 °C | 63.5 °C | 56.5 °C | 30 min incubation, activity assay. Measures kinetically relevant stability. |
| Half-life at 37°C (t1/2) | 48 hours | 52 hours | 12 hours | Incubation in PBS, periodic activity sampling. Critical for application. |
| Aggregation Onset Temp (Tagg) | 60.1 °C | 66.3 °C | 58.5 °C | Static light scattering, 1 mg/mL. Predicts solution behavior under stress. |
Q4: What are the most reliable computational tools and servers for predicting stabilizing mutations in 2024, and what are their key inputs? A: The field integrates machine learning with physics-based models. Below is a recommended protocol.
- Protocol - In Silico Thermostability Prediction Workflow:
- Input Preparation: Obtain a high-resolution 3D structure (PDB file). If unavailable, generate a reliable homology model using SWISS-MODEL or AlphaFold2.
- Stability Change Prediction (∆∆G): Submit your structure to:
- POPMusic 2.0: For rapid scanning of single-point mutants. Input: PDB file, mutation list (e.g., A100S).
- FoldX5: For detailed energy calculations and repairing/relaxing the structure. Use the
BuildModelcommand on the repaired PDB. - DeepDDG: A neural network-based predictor for ∆∆G. Often used to cross-validate results from FoldX.
- Analysis: Focus on mutations predicted by at least two tools to have a ∆∆G < -1.0 kcal/mol (more negative = more stabilizing). Visually inspect the top candidates for favorable interactions (salt bridges, hydrogen bonds, hydrophobic packing).
Diagram Title: Computational Workflow for Predicting Stabilizing Mutations
The Scientist's Toolkit: Research Reagent Solutions
Table 2: Essential Reagents for Site-Directed Mutagenesis & Thermostability Assays
| Item | Function & Rationale |
|---|---|
| High-Fidelity DNA Polymerase (e.g., Q5) | Essential for error-free amplification during PCR-based SDM. Offers superior fidelity over Taq polymerase. |
| DpnI Restriction Enzyme | Selectively digests the methylated parental DNA template post-PCR, enriching for the newly synthesized mutant plasmid in E. coli. |
| Competent E. coli Cells (Cloning Strain) | High-efficiency cells (e.g., DH5α, NEB 5-alpha) for plasmid transformation after SDM. Crucial for obtaining sufficient colonies for sequencing. |
| SYPRO Orange Protein Dye | Environmentally sensitive dye used in Differential Scanning Fluorimetry (DSF/Thermofluor) to measure protein thermal unfolding (Tm). |
| Size-Exclusion Chromatography (SEC) Column (e.g., Superdex 75 Increase) | For assessing aggregation state and obtaining monodisperse protein post-purification, a prerequisite for reliable stability assays. |
| Chaotropic Agent (GdnHCl or Urea) | Used in chemical denaturation experiments to calculate free energy of unfolding (∆G), providing a quantitative measure of stability. |
| Thermostable DNA Ligase | For multi-site mutagenesis or assembly protocols (e.g., Gibson Assembly), enabling more complex engineering strategies. |
| Real-Time PCR System with HRM Capability | Enables high-resolution melt (HRM) curve analysis for quick screening of mutant plasmid libraries. |
Diagram Title: Thesis Context: From Instability Problem to Engineering Impact
Troubleshooting Guides & FAQs
Q1: My cross-linked enzyme precipitates out of solution. What went wrong and how can I fix it? A: This is typically due to over-cross-linking, causing excessive aggregation. Key troubleshooting steps:
- Reduce cross-linker concentration. Perform a matrix experiment varying cross-linker from 0.1 to 5.0 mM.
- Shorten reaction time. Limit the reaction to 5-30 minutes on ice.
- Quench efficiently. Add a quenching agent (e.g., Tris buffer, glycine) immediately after the reaction time.
- Check pH. Ensure the cross-linking reaction buffer pH is optimal for your specific cross-linker and does not deviate from the enzyme's stable range.
Q2: After cross-linking, my enzyme loses >50% of its catalytic activity. How can I preserve activity better? A: Activity loss indicates modification of critical residues in or near the active site.
- Solution 1: Switch to a homobifunctional cross-linker with a longer spacer arm (e.g., BS3 (11.4 Å) instead of DSP (12 Å)). This may allow more flexibility and avoid perturbing the active site geometry.
- Solution 2: Use a site-directed cross-linking strategy. Introduce unique cysteine residues via mutagenesis away from the active site, then use a thiol-reactive cross-linker.
- Solution 3: Employ reversible cross-linkers (e.g., Dithiobis(succinimidyl propionate) (DSP)) that can be cleaved under reducing conditions to confirm if activity loss is directly due to cross-linking.
Q3: My SDS-PAGE analysis shows high-molecular-weight smears instead of clear cross-linked bands. How do I improve analysis? A: Smearing indicates heterogeneous cross-linking products.
- Optimize Reaction Conditions: Ensure the enzyme is in a monodisperse, native state before cross-linking (use size-exclusion chromatography if necessary).
- Purify Post-Reaction: Use a buffer exchange or purification column to remove excess cross-linker and aggregates before electrophoresis.
- Use the Correct Gel: For large complexes, use lower percentage acrylamide gels (e.g., 4-12% gradient) for better resolution of high molecular weight species.
- Include Proper Controls: Always run samples: 1) No cross-linker, 2) Cross-linked, non-reduced, 3) Cross-linked, reduced (if using cleavable cross-linker).
Q4: I need to cross-link my enzyme for structural studies, but it has no native lysines. What are my options? A: Utilize alternative chemistries targeting other amino acids.
- Cysteine-specific: Use maleimide or pyridyldithiol-based cross-linkers (e.g., BMH, DTME).
- Carboxyl-to-amine: Use zero-length cross-linkers like EDC/NHS to conjugate aspartate/glutamate to lysine or another amine.
- Incorporation of Unnatural Amino Acids: Utilize amber codon suppression to introduce bioorthogonal handles (e.g., azides, alkynes) for specific, "click chemistry" cross-linking.
Q5: How do I determine the optimal cross-linker-to-protein molar ratio for my new enzyme? A: A systematic titration is required. Follow this protocol:
Protocol: Determining Optimal Cross-linker Ratio
- Prepare Enzyme: Dialyze your enzyme into a compatible buffer (PBS or HEPES, pH 7.0-8.0). Avoid amines (e.g., Tris, glycine).
- Setup Reactions: In a series of tubes, hold enzyme concentration constant (e.g., 1 µM). Add cross-linker (e.g., BS3) from a fresh stock solution to achieve final molar ratios of: 1:1, 5:1, 10:1, 20:1, 50:1 (cross-linker:enzyme).
- Incubate: React at room temperature or 4°C for 30 minutes.
- Quench: Add Tris-HCl, pH 8.0, to a final concentration of 50 mM and incubate for 15 minutes.
- Analyze: Run all samples on SDS-PAGE (non-reducing) alongside a native marker.
- Assess: The optimal ratio yields a clear band shift corresponding to the desired oligomeric state with minimal high-MW aggregation. Test activity of each band.
Table 1: Common Homobifunctional NHS-Ester Cross-Linkers (Targeting Lysine)
| Cross-Linker | Spacer Arm Length | Cleavable | Key Feature | Typical Concentration Range |
|---|---|---|---|---|
| BS³ | 11.4 Å | No | Hydrophilic, membrane-impermeable | 0.5 - 2.0 mM |
| DSS | 11.4 Å | No | Analog of BS³, water-insoluble (use DMSO) | 0.5 - 2.0 mM |
| DSP (Lomant's Reagent) | 12.0 Å | Yes (Reducing) | Cleavable with DTT, useful for analysis | 0.1 - 1.0 mM |
| DTSSP | 12.0 Å | Yes (Reducing) | Water-soluble version of DSP | 0.1 - 1.0 mM |
| EGS | 16.1 Å | Yes (Acidic) | Long arm, cleaved at low pH | 1.0 - 5.0 mM |
Table 2: Troubleshooting Matrix: Symptoms, Causes, and Solutions
| Symptom | Likely Cause | Immediate Fix | Preventive Action for Future Experiments |
|---|---|---|---|
| Enzyme precipitation/aggregation | Over-cross-linking, incorrect pH | Dilute sample, add mild detergent (e.g., 0.1% CHAPS) | Titrate cross-linker concentration; perform reaction on ice. |
| Complete loss of activity | Modification of active site residue | Switch to a reversible cross-linker (DSP) to test | Use a site-directed or zero-length cross-linker. |
| No observable cross-linking on SDS-PAGE | Cross-linker is hydrolyzed, no target residues | Use fresh cross-linker from dry DMSO stock | Ensure buffer is amine-free (no Tris, glycine). Quickspin desalt protein if needed. |
| Multiple, unexpected bands | Heterogeneous population or partial denaturation | Purify protein via SEC before cross-linking | Check protein homogeneity (DLS, SEC) prior to experiment. |
Experimental Protocol: Standard Protein Cross-Linking with BS³
Objective: To covalently stabilize the native quaternary structure of an oligomeric enzyme.
Materials:
- Purified enzyme in amine-free buffer (e.g., 20 mM HEPES, 150 mM NaCl, pH 7.5).
- BS³ (Bis(sulfosuccinimidyl)suberate) cross-linker, fresh.
- Quenching Buffer: 1 M Tris-HCl, pH 8.0.
- SDS-PAGE loading buffer (non-reducing).
- Pre-cast SDS-PAGE gel (4-20% gradient).
Method:
- Preparation: Dialyze or desalt the enzyme into the reaction buffer. Keep on ice.
- Cross-linker Solution: Immediately before use, prepare a fresh 20 mM stock of BS³ in ultrapure water or reaction buffer.
- Reaction Setup: To 50 µL of enzyme (1 mg/mL, ~1-5 µM), add 5.5 µL of the 20 mM BS³ stock to achieve a final concentration of 2 mM. Mix gently by pipetting. Perform a control with buffer instead of BS³.
- Incubation: Allow the reaction to proceed on ice for 30 minutes.
- Quenching: Stop the reaction by adding 5 µL of 1 M Tris-HCl, pH 8.0. Incubate for 15 minutes at room temperature.
- Analysis: Add non-reducing SDS-PAGE loading buffer to quenched samples. Heat at 70°C for 10 minutes (do not boil). Load and run the gel alongside molecular weight standards. Visualize by Coomassie or Western blot.
Visualization: Cross-Linking Workflow & Analysis
Title: Experimental Workflow for Protein Cross-Linking
Title: Covalent Strategies to Lock Enzyme Conformation
The Scientist's Toolkit: Research Reagent Solutions
Table 3: Essential Materials for Conformational Locking Experiments
| Reagent / Material | Primary Function | Key Consideration |
|---|---|---|
| Homobifunctional NHS-Esters (BS³, DSS) | Forms stable amide bonds between primary amines (lysines) on interacting protein surfaces. | Use amine-free buffers (HEPES, phosphate). Prepare fresh in water or DMSO. |
| Cleavable Cross-linkers (DSP, DTSSP) | Allows biochemical dissection of cross-linked complexes via reducing agents or pH change. | Essential for identifying cross-linked partners by mass spectrometry. |
| Size Exclusion Chromatography (SEC) Column | Purifies native oligomeric state and removes aggregates before/after cross-linking. | Critical for ensuring homogeneous starting material and analyzing cross-linking products. |
| Non-Reducing SDS-PAGE Gels | Analyzes cross-linked complexes without breaking disulfide or cleavable cross-links. | Must omit β-mercaptoethanol or DTT from sample buffer. |
| Mass Spectrometry-Compatible Stains (e.g., Coomassie, Silver) | Visualizes cross-linked bands for subsequent excising and in-gel digest/MS analysis. | Avoid fixatives like glutaraldehyde that interfere with MS. |
| Activity Assay Kit/Reagents | Quantifies functional retention post-modification, the ultimate test of native conformation. | Perform assay under initial velocity conditions for accurate comparison. |
| Dynamic Light Scattering (DLS) Instrument | Assesses monodispersity and hydrodynamic radius before cross-linking, detects aggregation after. | Quick screen for sample quality. |
Technical Support Center: Troubleshooting Guides & FAQs
Context: This support center is framed within a thesis focused on addressing physical instability, denaturation, and loss of catalytic efficiency in industrial enzyme applications. The following FAQs address common experimental challenges encountered when working with advanced immobilization supports like nanomaterials and Metal-Organic Frameworks (MOFs).
Frequently Asked Questions (FAQs)
Q1: My enzyme loading efficiency on magnetic nanoparticles (MNPs) is consistently lower than expected (< 30%). What could be the cause and how can I improve it? A: Low loading efficiency is often due to improper activation of the nanomaterial surface or suboptimal coupling conditions.
- Troubleshooting Steps:
- Verify Activation: Ensure carboxylated or aminated MNPs are freshly activated. For EDC/NHS chemistry, use a molar ratio of EDC:NHS:COOH of 1:2:1. Prolong activation beyond 20 minutes in aqueous buffer can lead to hydrolysis of the NHS ester.
- Check pH: The coupling pH must be between 7.0 and 8.5 (non-amine buffers like MES or phosphate) to facilitate nucleophilic attack by enzyme lysine residues while maintaining protein stability.
- Optimize Incubation: Increase incubation time to 2-4 hours at 4°C with gentle agitation to maximize diffusion and binding without causing aggregation.
- Protocol (EDC/NHS Coupling to Carboxylated MNPs):
- Wash 10 mg of carboxylated MNPs (e.g., Fe₃O₄@SiO₂-COOH) twice with 1 mL of 0.1 M MES buffer (pH 6.0).
- Resuspend particles in 1 mL MES buffer. Add 400 µL of freshly prepared EDC solution (50 mg/mL in MES) and 600 µL of NHS solution (50 mg/mL in MES).
- Activate with agitation for 15 minutes at room temperature.
- Wash 3x with coupling buffer (e.g., 0.1 M phosphate, pH 7.5) to stop reaction and remove excess reagents.
- Immediately incubate with 2-5 mg/mL of your target enzyme in coupling buffer for 3 hours at 4°C with rotation.
- Separate particles magnetically and wash thoroughly. Determine loading efficiency via Bradford assay on supernatant.
Q2: After immobilization in a ZIF-8 MOF via co-precipitation, my enzyme shows negligible activity. Is the enzyme being denatured during synthesis? A: This is a common issue, often related to the rapid crystallization and localized exothermic reaction of ZIF-8. The enzyme may be physically trapped in a distorted conformation or exposed to low pH.
- Troubleshooting Steps:
- Moderate Synthesis Conditions: Perform the synthesis at 0-4°C to slow crystallization and minimize thermal denaturation. Pre-chill all solutions (zinc salt, 2-methylimidazole, enzyme buffer) on ice.
- Buffer Compatibility: Ensure your enzyme storage buffer is compatible. Avoid Tris or high-phosphate buffers, as they can interfere with ZIF-8 crystallization. Use low-ionic-strength HEPES or MOPS buffers (10-20 mM, pH 7-7.5).
- Characterize Encapsulation: Use SEM to confirm MOF formation and FTIR to check for preservation of enzyme secondary structure post-encapsulation.
- Protocol (Gentle ZIF-8 Encapsulation at 4°C):
- Prepare 5 mL of 25 mM 2-methylimidazole in 20 mM HEPES buffer (pH 7.5) and chill on ice.
- Prepare 5 mL of 12.5 mM Zn(NO₃)₂·6H₂O in the same chilled HEPES buffer.
- Mix 2 mg of your enzyme in 1 mL of chilled HEPES buffer with the zinc nitrate solution.
- Rapidly pour the 2-methylimidazole solution into the enzyme-zinc mixture under gentle vortexing.
- Let the reaction proceed for 1 hour on ice.
- Centrifuge (5000 x g, 5 min, 4°C) to collect enzyme@ZIF-8 composites. Wash 3x with chilled assay buffer.
Q3: My immobilized enzyme preparation has high activity recovery but leaches >15% of protein over 5 reaction cycles. How can I enhance binding stability? A: Leaching indicates weak or non-covalent attachment. For covalent strategies, ensure bond formation; for encapsulation, check pore size/composite integrity.
- Troubleshooting Guide:
Immobilization Method Potential Cause of Leaching Solution Covalent (e.g., on Graphene Oxide) Insufficient functional groups or blocked active sites. Introduce a longer spacer arm (e.g., PEG-bis(amine)) between support and enzyme to reduce steric hindrance. Encapsulation (MOFs) MOF crystal defects or smaller enzyme diameter than pore aperture. Apply a thin polymeric coating (e.g., polydopamine) via secondary immersion to seal defects. Adsorption (on MNPs) Weak ionic/hydrophobic interactions under operational conditions. Perform a post-immobilization cross-linking step using low concentrations (0.1% v/v) of glutaraldehyde for 30 minutes.
Research Reagent Solutions Toolkit
| Reagent / Material | Function in Immobilization | Key Consideration |
|---|---|---|
| EDC (1-Ethyl-3-(3-dimethylaminopropyl)carbodiimide) | Activates carboxyl groups for direct amide bond formation with enzyme amines. | Hydrolyzes rapidly in water; must be used fresh. Quench with β-mercaptoethanol or glycine. |
| NHS (N-Hydroxysuccinimide) | Stabilizes the EDC-activated ester intermediate, greatly improving coupling efficiency. | Often used in conjunction with EDC. NHS ester is more stable but still hydrolyzes over hours. |
| Aminated Magnetic Nanoparticles | Provides primary amine groups on particle surface for covalent attachment to enzyme carboxyls. | Surface amine density (µmol/g) is a critical specification; higher density isn't always better due to crowding. |
| Zinc Nitrate Hexahydrate & 2-Methylimidazole | Precursors for ZIF-8 MOF synthesis. Facilitates rapid in situ encapsulation of enzymes. | Ratio and concentration control crystal size and porosity. High 2-MIm concentrations can deprotonate and denature enzymes. |
| Glutaraldehyde (25% solution) | Homobifunctional crosslinker for post-adsorption stabilization or creating cross-linked enzyme aggregates (CLEAs). | Concentration is critical; high concentrations can over-crosslink and deactivate the enzyme. |
| Polydopamine Precursor | Forms a universal, gentle adhesive coating on any support, providing a secondary layer to prevent leaching. | Polymerization time controls coating thickness; typically 2-8 hours at pH 8.5. |
Table 1: Comparative Performance of Immobilization Supports (Recent Data)
| Support Type | Example Material | Typical Enzyme Loading (mg/g support) | Activity Recovery (%) | Operational Stability (Half-life) | Key Advantage |
|---|---|---|---|---|---|
| Magnetic Nanoparticle | Fe₃O₄@SiO₂-NH₂ | 80 - 150 | 60 - 80 | 5-15 cycles | Easy magnetic separation, good recyclability |
| Metal-Organic Framework | ZIF-8 | 100 - 200 | 50 - 70* | 10-30 cycles | Extreme physical protection, high loading |
| Graphene Oxide Sheet | GO-COOH | 120 - 300 | 40 - 65 | 8-20 cycles | High surface area, conductive properties |
| Mesoporous Silica | SBA-15 | 50 - 100 | 70 - 90 | 15-40 cycles | Well-defined porosity, high stability |
*Highly dependent on synthesis method; co-precipitation often yields lower recovery than diffusion.
Table 2: Troubleshooting Metrics & Targets
| Problem | Measurement Method | Acceptable Range | Target for Optimization |
|---|---|---|---|
| Low Loading Efficiency | Bradford/BCA assay on supernatant | > 70% of offered enzyme | > 90% |
| High Activity Loss | Specific activity assay (immob. vs. free) | > 50% activity recovery | > 80% |
| Leaching | Protein assay on reaction cycles 1-5 | < 5% cumulative loss over 5 cycles | < 2% |
| Aggregation of Supports | Dynamic Light Scattering (DLS) | PDI < 0.2 | PDI < 0.1 |
Experimental Workflow Diagrams
Title: Enzyme Immobilization Development & Troubleshooting Workflow
Title: Gentle ZIF-8 Encapsulation Protocol to Prevent Denaturation
Troubleshooting & FAQ Technical Support Center
Q1: During lyophilization of our enzyme formulation, we observe collapse of the cake structure and a significant loss in activity post-reconstitution. What are the primary causes and solutions?
A: Cake collapse during lyophilization often indicates that the primary drying temperature exceeded the collapse temperature (T꜀) of the formulation. This leads to structural loss, reduced reconstitution time, and potential denaturation. The primary cause is insufficient lyoprotectant concentration or an inappropriate excipient matrix.
Solutions:
- Optimize Lyoprotectant: Increase the concentration of a non-reducing disaccharide (e.g., sucrose, trehalose) to a typical final ratio of 1:1 to 5:1 (lyoprotectant:protein). This forms an amorphous glassy matrix with a higher T꜀.
- Incorporate Bulking Agent: For low solute concentrations, add a crystalline bulking agent like mannitol (5-10% w/v) to provide structural integrity. Ensure it is fully crystalline by annealing during freeze-drying.
- Adjust Process Parameters: Lower the shelf temperature during primary drying to stay 2-5°C below the T꜀ of your formulation.
Relevant Protocol: Determination of Collapse Temperature
- Prepare formulations with varying sucrose concentrations (1%, 5%, 10% w/v).
- Use Freeze-Drying Microscopy (FDM) to visually observe the collapse event under controlled temperature and vacuum.
- Record the temperature at which the microstructure collapses for each formulation.
- Correlate with DSC data to confirm the glass transition temperature of the maximally freeze-concentrated solute (Tg').
| Lyoprotectant (10% w/v) | Typical Tg' (°C) | Typical Recommended Primary Drying Temp (°C) |
|---|---|---|
| Sucrose | -32 to -34 | -35 to -40 |
| Trehalose | -30 to -32 | -32 to -37 |
| Mannitol (Crystalline) | N/A (Crystallizes) | Can be higher (e.g., -25) |
Q2: In our liquid protein formulation, we are observing aggregation and precipitation upon long-term storage at 2-8°C. Which polyalcohols can stabilize against cold denaturation and how do they work?
A: Certain polyalcohols act as stabilizing osmolytes, preferentially excluding themselves from the protein surface. This favors the native, compact conformation and discourages unfolding and aggregation.
Recommended Polyalcohols & Mechanism:
- Sorbitol (2-5% w/v): Effective at reducing protein-protein interactions and surface adsorption.
- Glycerol (5-20% v/v): Lowers the freezing point, reduces ice-water interfacial denaturation, and increases solution viscosity to slow degradation kinetics.
Experimental Protocol: Screening Polyalcohols for Cold Stability
- Prepare identical enzyme solutions in buffers containing 5% w/v sorbitol, 10% v/v glycerol, or a control with no polyalcohol.
- Aliquot and store at 5°C and 25°C (accelerated condition).
- At weekly intervals (for 4-8 weeks), analyze samples by:
- Size-Exclusion HPLC (SEC-HPLC): Quantify soluble aggregate and monomer percentages.
- Dynamic Light Scattering (DLS): Measure hydrodynamic radius (Rh) for early aggregation detection.
- Activity Assay: Measure residual enzymatic activity.
| Stabilizer | Common Use Concentration | Primary Stabilizing Mechanism | Key Consideration |
|---|---|---|---|
| Sorbitol | 2 - 5% w/v | Preferential exclusion, Molecular crowding | High concentrations can increase viscosity. |
| Glycerol | 5 - 20% v/v | Preferential exclusion, Reduction of interfacial stress | Hygroscopic; may affect reconstitution if used in lyophilization. |
| Trehalose (Liquid) | 5 - 15% w/v | Preferential exclusion, Water replacement | Often preferred for dual liquid/lyo use. |
Q3: What is the critical difference between a cryoprotectant and a lyoprotectant, and can one excipient serve both roles?
A: Yes, many excipients serve dual roles, but the mechanisms differ.
- Cryoprotectant: Protects during the freezing phase. It inhibits ice crystal formation, minimizes freeze-concentration stress, and stabilizes against cold denaturation at the ice-water interface.
- Lyoprotectant: Protects during the drying and storage phases. It forms an amorphous glass, provides a hydrogen-bonding network to replace water (Water Replacement Theory), and immobilizes the protein in a stable matrix (Vitrification Theory).
Dual-Function Excipients: Sucrose and trehalose are premier examples. They function as cryoprotectants during freezing and as lyoprotectants during drying and storage.
Experimental Workflow: Formulation Development for an Unstable Enzyme
Figure 1: Workflow for developing stable enzyme formulations.
Q4: Our reconstituted lyophilized enzyme shows sub-visible particles. Is this indicative of instability, and what analytical methods are key for characterization?
A: Yes, the presence of sub-visible particles (SVP) is a critical quality attribute indicating protein aggregation and physical instability. A multi-method approach is required.
Essential Characterization Toolkit:
| Method | Measures | Information Provided |
|---|---|---|
| Micro-Flow Imaging (MFI) / Light Obscuration | Particle count & size distribution (2-100+ µm) | Number of particles per mL, visual morphology (MFI). |
| Dynamic Light Scattering (DLS) | Hydrodynamic radius (Rh) | Early detection of oligomers/aggregates in the nanometer range. |
| Size-Exclusion HPLC (SEC-HPLC) | Soluble aggregate percentage | Quantifies dimer, trimer, and higher-order soluble aggregates. |
| Turbidity (Absorbance at 350-600 nm) | Light scattering | Simple, rapid assessment of overall particulation. |
The Scientist's Toolkit: Key Research Reagent Solutions
| Item | Function in Formulation Science |
|---|---|
| High-Purity Sucrose/Trehalose | Primary lyo-/cryoprotectant. Forms stable amorphous glass. |
| Mannitol (USP Grade) | Crystalline bulking agent for lyophilized cake structure. |
| Histidine or Succinate Buffer Salts | Provides pH control with low temperature sensitivity. |
| Polysorbate 20 or 80 | Surfactant to minimize interfacial denaturation (ice-water, air-water). |
| Sorbitol or Glycerol | Polyalcohol stabilizer for liquid formulations. |
| Recombinant Enzyme Standard | High-purity reference material for analytical method development. |
| Lyophilization Vials & Stoppers | Primary packaging compatible with freeze-drying process. |
Technical Support Center
Frequently Asked Questions (FAQs)
Q1: After running a molecular dynamics (MD) simulation to assess protein stability, the root-mean-square deviation (RMSD) values keep increasing and do not plateau. What does this indicate and how should I proceed?
- A: A continuously increasing RMSD often suggests the protein structure is undergoing significant conformational change or denaturation during the simulation timescale. This could indicate intrinsic instability or that your simulation parameters (e.g., temperature, force field, solvation model) are inappropriate. First, verify your simulation setup (correct protonation states, proper equilibration). Consider running a shorter, repeated simulation to check for consistency. If the issue persists, the simulation may be accurately reflecting the protein's instability, which could be the target for your stabilizing mutations.
Q2: My in silico mutation scan predicted a potentially stabilizing mutation, but experimental thermal shift assay (TSA) shows a decrease in melting temperature (Tm). What are the possible reasons?
- A: Discrepancies between computational predictions and experimental results are common. Key reasons include:
- Solvent/Formulation Effects: The in silico model often uses an idealized aqueous environment, while the experimental buffer may contain specific ions, excipients, or pH conditions that alter the mutation's effect.
- Long-Range Effects: The mutation might stabilize the local region but disrupt critical long-range interactions or allosteric networks not fully captured in the simulation.
- Aggregation: The mutation could improve conformational stability but increase surface hydrophobicity, leading to aggregation at higher temperatures, which TSA may not distinguish from unfolding.
- A: Discrepancies between computational predictions and experimental results are common. Key reasons include:
Q3: When using machine learning (ML) tools for stability prediction, how do I handle missing or sparse data for my specific protein family?
- A: For protein families with limited data, consider these approaches:
- Use Transfer Learning: Employ pre-trained models on general protein datasets and fine-tune them with whatever small, high-quality experimental data you have for your target family.
- Leverage Evolutionary Coupling Analysis: Use tools like EVcoupling or DeepSequence to extract evolutionary constraints from multiple sequence alignments, which provide family-specific stability information.
- Feature Engineering: Combine ML predictions with physics-based energy scores (e.g., FoldX, Rosetta ddG) to create ensemble models that are more robust to data sparsity.
- A: For protein families with limited data, consider these approaches:
Q4: How can I computationally screen for formulation excipients that are compatible with my enzyme and likely to inhibit aggregation?
- A: You can perform molecular docking and MD simulations to study excipient-protein interactions.
- Docking: Screen a library of common stabilizers (euglycan, arginine, sucrose, etc.) against known aggregation-prone regions (APRs) or surface hydrophobic patches identified by tools like TANGO or CamSol.
- MD Simulations: Run short simulations of the protein in the presence of high concentrations of the docked excipients. Analyze metrics such as:
- Number and stability of hydrogen bonds between excipient and protein.
- Reduction in solvent-accessible surface area (SASA) of APRs.
- Excipient residence time near key regions.
- A: You can perform molecular docking and MD simulations to study excipient-protein interactions.
Troubleshooting Guides
Issue: High False Positive Rate in Stabilizing Mutation Prediction.
- Step 1: Verify the structural quality of your input protein model. Errors in side-chain packing or loops will propagate. Use MolProbity to check and refine the model.
- Step 2: Cross-validate predictions using at least three different computational methods (e.g., FoldX, Rosetta ddG, I-Mutant3.0). Only consider mutations predicted as stabilizing by a consensus.
- Step 3: Manually inspect the structural context of top predictions. Use visualization software (PyMOL, ChimeraX) to ensure the mutation doesn't create steric clashes or disrupt key catalytic or binding residues.
- Step 4: If available, check the evolutionary conservation of the wild-type residue. Highly conserved sites are less tolerant to mutation.
Issue: Unrealistic Excipient Binding in Docking Simulations due to High Flexibility.
- Step 1: Employ flexible docking protocols if available, or perform docking against an ensemble of protein conformations (snapshots from an MD simulation) rather than a single static structure.
- Step 2: Use induced-fit docking algorithms that allow for limited side-chain or backbone movement upon excipient binding.
- Step 3: Post-docking, always subject the top-ranked complexes to short, explicit-solvent MD simulations (50-100 ns) to assess the stability of the predicted binding pose. A pose that quickly dissociates is likely an artifact.
Experimental Protocols (Cited)
Protocol: In Silico Saturation Mutagenesis and Stability Change Calculation (ΔΔG)
- Input Preparation: Obtain a high-resolution 3D structure of your wild-type enzyme (PDB format). Use PDBFixer or the
clean_pdbfunction in Rosetta to add missing atoms/residues and assign standard protonation states at pH 7.0. - Mutation Generation: Use the
RosettaScriptsinterface orFoldXBuildModelcommand to generate all 19 possible point mutations at each residue position of interest. - Energy Minimization: Relax both wild-type and mutant structures using a short energy minimization protocol (e.g., Rosetta
FastRelaxor FoldXRepairPDB) to remove steric clashes. - ΔΔG Calculation: Calculate the difference in folding free energy (ΔΔG = ΔGmutant - ΔGwild-type) using the
ddg_monomerapplication in Rosetta or theStabilitycommand in FoldX. Run each calculation in triplicate with different random seeds. - Analysis: Mutations with ΔΔG < -1.0 kcal/mol are typically considered stabilizing. Compile results, focusing on mutations with negative ΔΔG and high prediction confidence (low standard deviation).
- Input Preparation: Obtain a high-resolution 3D structure of your wild-type enzyme (PDB format). Use PDBFixer or the
Protocol: Molecular Dynamics Simulation for Assessing Conformational Stability
- System Setup: Solvate the protein in a cubic water box (e.g., TIP3P model) with a minimum 10 Å distance from the box edge. Add ions (e.g., Na⁺, Cl⁻) to neutralize the system and reach a physiological concentration of 150 mM.
- Energy Minimization: Perform 5,000 steps of steepest descent minimization to remove bad contacts.
- Equilibration:
- NVT: Heat the system from 0 K to 300 K over 100 ps, restraining protein heavy atoms.
- NPT: Equilibrate the system at 1 atm pressure for 1 ns, gradually releasing restraints on the protein backbone and side-chains.
- Production Run: Run an unrestrained simulation for a duration relevant to your stability metric (typically 100 ns to 1 µs). Use a 2 fs integration time step. Save coordinates every 10 ps.
- Analysis: Calculate RMSD, root-mean-square fluctuation (RMSF), radius of gyration (Rg), and the number of native hydrogen bonds over time using tools like
gmx rms,gmx rmsf, andgmx gyratefrom GROMACS or equivalent in AMBER/NAMD.
Data Presentation
Table 1: Comparison of Computational Tools for Predicting Protein Stability Changes (ΔΔG) Upon Mutation
| Tool Name | Method Principle | Typical Runtime per Mutation | Recommended Use Case | Key Metric Output |
|---|---|---|---|---|
| FoldX | Empirical force field | < 30 seconds | Rapid, high-throughput scanning of many mutations. | ΔΔG (kcal/mol) |
| Rosetta ddG | Physical energy function & conformational sampling | 2-5 minutes | High-accuracy predictions for detailed study of select mutations. | ΔΔG (kcal/mol), ensemble structures |
| I-Mutant3.0 (SUPREX) | Machine Learning (SVM) trained on experimental data | < 5 seconds | Initial prioritization when only protein sequence is available. | ΔΔG (kcal/mol), reliability index |
| CUPSAT | Statistical potential & torsion angle potential | < 1 minute | Analysis incorporating backbone and side-chain flexibility. | ΔΔG (kcal/mol), stability probability |
Table 2: Key Output Metrics from a 200 ns MD Simulation for Stability Assessment
| Metric | Wild-Type Protein | Mutant (A124V) | Interpretation |
|---|---|---|---|
| Final RMSD (Å) | 1.8 ± 0.2 | 1.5 ± 0.1 | Mutant shows lower overall structural drift. |
| Average Rg (Å) | 17.3 ± 0.3 | 17.1 ± 0.2 | Mutant is slightly more compact. |
| Native H-Bonds (%) | 82 ± 3 | 88 ± 2 | Mutant maintains more stabilizing H-bonds. |
| SASA of APR₉₂₋₁₀₀ (nm²) | 8.5 ± 1.0 | 6.2 ± 0.8 | Mutant buries a key aggregation-prone region. |
Visualizations
Diagram Title: Integrated Computational Workflow for Stability & Formulation Screening
Diagram Title: Dual Routes to Stabilize an Enzyme
The Scientist's Toolkit: Research Reagent Solutions
| Item | Function in Computational Stability/Compatibility Research |
|---|---|
| Molecular Dynamics Software (GROMACS/AMBER) | Provides the simulation engine to model protein motion, dynamics, and interactions with excipients in a solvated environment over time. |
| Rosetta Suite (ddG_monomer) | A comprehensive software suite for high-resolution protein structure prediction and design, used for precise ΔΔG calculations and de novo mutation design. |
| FoldX Force Field | A fast, empirical force field specifically parameterized for predicting the effect of point mutations on protein stability, folding, and interactions. |
| Aggregation Prediction Server (TANGO) | Identifies aggregation-prone regions (APRs) in protein sequences based on physico-chemical principles, guiding mutation and excipient targeting. |
| Thermal Shift Assay (TSA) Kit | The primary experimental validation tool for measuring changes in protein melting temperature (ΔTm) resulting from mutations or excipient addition. |
| High-Performance Computing (HPC) Cluster | Essential infrastructure for running computationally intensive MD simulations and large-scale in silico mutation screens within a practical timeframe. |
Troubleshooting Enzyme Degradation: Protocols for Identifying and Solving Stability Issues
Troubleshooting Guides & FAQs
Q1: After prolonged storage at -80°C, my enzyme shows a >50% loss in specific activity. What are the primary suspects?
A: The root causes typically fall into three categories: physical instability, chemical degradation, or process-related damage. The most common culprits are repeated freeze-thaw cycles, improper buffer composition, or trace contamination. A systematic diagnostic protocol is required.
Experimental Protocol: Storage Stability Assessment
- Prepare aliquots of the enzyme in candidate storage buffers (e.g., with/without glycerol, reducing agents, or stabilizers).
- Subject aliquots to defined stress conditions: multiple freeze-thaw cycles (e.g., 0, 1, 3, 5 cycles) vs. continuous storage at -80°C.
- After storage, thaw samples on ice and assay activity under standard kinetic conditions immediately.
- Analyze protein integrity via SDS-PAGE and size-exclusion chromatography (SEC) to check for aggregation or fragmentation.
Quantitative Data Summary:
| Suspect Cause | Diagnostic Test | Expected Result if Positive | Typical Activity Loss Range |
|---|---|---|---|
| Freeze-Thaw Damage | Compare single-aliquot vs. multi-thawed samples | Significant drop in multi-thaw samples | 30-70% after 3-5 cycles |
| Oxidation | Incubate with/without DTT/TCEP in assay buffer | Activity restored with reducing agent | 20-60% |
| Aggregation | SEC or Dynamic Light Scattering (DLS) | Increased high-molecular weight peak / Polydispersity >20% | Variable, often >50% |
| Proteolysis | SDS-PAGE (Silver Stain) | Additional lower molecular weight bands | 25-100% |
Q2: My enzyme loses activity immediately after purification or during a reaction process. How do I distinguish between inherent instability and process-induced denaturation?
A: This requires real-time monitoring and controlled step-back experiments to pinpoint the exact stage of failure.
Experimental Protocol: Step-Back Process Analysis
- Baseline: Measure activity of the "gold standard" sample (freshly purified, never frozen).
- Process Replication: Subject an aliquot of the gold standard to each individual step of your suspect process (e.g., dilution into specific buffer, incubation at reaction temperature, exposure to a substrate/cofactor mix).
- Immediate Assay: Measure activity immediately after each discrete step.
- Kinetic Thermostability: Use a method like differential scanning fluorimetry (DSF) to compare the melting temperature (Tm) of the sample before and after the critical process step. A drop in Tm indicates physical destabilization.
Quantitative Data Summary:
| Process Step | Activity Post-Step (% Baseline) | ΔTm (Post-Step vs. Baseline) | Likely Conclusion |
|---|---|---|---|
| Dilution into Low-Ionic Buffer | 40% | -4.5°C | Physical Instability: Colloidal dispersion failure |
| Addition of Substrate X | 85% | +0.2°C | Not the primary cause |
| Incubation at 37°C for 10 min | 30% | -6.1°C | Thermal Denaturation |
| Exposure to Stainless Steel Surface | 70% | -1.0°C | Minor surface adsorption |
The Scientist's Toolkit: Research Reagent Solutions
| Item | Primary Function in Stabilization |
|---|---|
| Trehalose (0.5-1.0 M) | Biophysical stabilizer; forms a glassy matrix, preserves hydration shell during freezing/dehydration. |
| Glycerol (10-20% v/v) | Cryoprotectant; reduces ice crystal formation and mechanical shear during freezing/thawing. |
| TCEP (0.5-2 mM) | Reducing agent; prevents disulfide scrambling and cysteine oxidation, more stable than DTT. |
| HEPES Buffer (50-100 mM) | Non-metal chelating buffer; maintains pH during temperature shifts, avoids catalytic metal ion depletion. |
| BSA or Gelatin (0.1 mg/mL) | Inert protein additive; reduces surface adsorption to tubes and pipette tips. |
| Protease Inhibitor Cocktail (EDTA-free) | Prevents cleavage by trace contaminant proteases during storage or assay. |
| Size-Exclusion Chromatography Resin | Diagnostic tool; separates native monomer from aggregates post-storage. |
| Differential Scanning Fluorimetry Dye | Identifies optimal buffer conditions and detects process-induced unfolding. |
Diagnostic Workflow for Activity Loss
Signaling Pathways in Enzyme Denaturation
Troubleshooting Guides & FAQs
Ionic Strength
Q1: My enzyme precipitates upon addition to my standard assay buffer. What is wrong? A: This is a classic symptom of suboptimal ionic strength. Your buffer's ionic strength may be too low, failing to shield charged groups on the enzyme's surface, leading to aggregation. First, measure the conductivity of your enzyme storage buffer and your assay buffer. Gradually increase the ionic strength of your assay buffer by adding a neutral salt like KCl or NaCl in 25-50 mM increments, monitoring activity and clarity.
Q2: How does ionic strength specifically affect catalytic rate (kcat)? A: Excessively high ionic strength can compete for essential electrostatic interactions within the active site or between subunits, reducing kcat. If you observe a decrease in kcat as ionic strength rises beyond an optimum, it suggests specific ion pairs are being shielded. Systematically vary salt concentration (see Protocol A) and fit data to a model to find the optimum.
Co-factors
Q3: My metalloenzyme loses activity over time despite adding cofactor to the buffer. Why? A: The cofactor may be precipitating or oxidizing. For example, divalent cations like Mg²⁺ or Zn²⁺ can form insoluble complexes with phosphates or carbonates at certain pH levels. Always prepare fresh cofactor stock solutions, chelate trace contaminants with EDTA (where appropriate), and use ultrapure water. For redox-active cofactors (e.g., Fe-S clusters), maintain anaerobic conditions.
Q4: How do I determine the optimal concentration for an essential cofactor? A: Perform a saturation kinetic experiment. Hold all other components constant and vary the cofactor concentration across a broad range (e.g., 0.1x to 100x the suspected Km). Plot initial velocity vs. [cofactor] and fit to the Michaelis-Menten equation to find the apparent Kd and optimal saturating concentration (typically 10x Kd).
Redox Potential
Q5: My cysteine-dependent enzyme is irreversibly inactivated. How can I prevent this? A: This likely involves disulfide bridge scrambling or over-oxidation of active-site cysteines. You must control the redox potential (Eh) of your buffer. Incorporate a redox buffer system, such as a reduced/oxidized glutathione (GSH/GSSG) mix or cysteine/cystine pair. The ratio determines the Eh (see Protocol C). Use a 2-10 mM total concentration of the redox couple.
Q6: How do I measure and adjust the redox potential in my experimental setup? A: While calculated using the Nernst equation, the actual Eh should be verified with a redox-sensitive electrode (platinum electrode paired with a Ag/AgCl reference). For most thiol-dependent enzymes, maintain an Eh between -200 mV and -300 mV. Prepare anoxic buffers and add the redox couple just before use.
Experimental Protocols
Protocol A: Determining Optimal Ionic Strength
- Prepare 10x stock of your core buffer (e.g., 500 mM Tris-HCl, pH 8.0).
- Prepare a 2M stock of neutral salt (KCl or NaCl).
- In a series of tubes, mix components to create a 1x buffer series with final [Salt] from 0 to 500 mM in 50 mM increments. Keep total volume constant.
- Initiate the enzyme reaction in each buffer and measure initial velocity.
- Plot activity vs. ionic strength (I) where I = 1/2Σci*zi².
Protocol B: Titrating Cofactor Concentration
- Prepare a master mix containing all reaction components except the cofactor.
- Aliquot the master mix into a microplate.
- Add cofactor from a serial dilution to create a concentration range spanning three orders of magnitude.
- Initiate reaction, collect kinetic data for 5-10 minutes.
- Fit the velocity vs. [cofactor] data to a hyperbolic curve to derive Kd.
Protocol C: Preparing a Redox Buffer
- In an anaerobic chamber, prepare 100 mM stocks of reduced (GSH) and oxidized (GSSG) glutathione in degassed, nitrogen-sparged buffer.
- Calculate the required GSH:GSSG ratio to achieve target Eh using the Nernst equation: Eh = E°' + (RT/nF)ln([GSSG]/[GSH]²). For GSH/GSSG, E°' ≈ -240 mV at pH 7.0, 25°C.
- Mix the stocks to achieve the desired ratio and a final total concentration of 5 mM.
- Verify pH after addition, as thiols can affect it.
Data Presentation
Table 1: Effect of Ionic Strength (KCl) on Model Enzyme Activity and Stability
| [KCl] (mM) | Ionic Strength (I) | Relative Activity (%) | Observed Aggregation (after 1h) | Recommended Use |
|---|---|---|---|---|
| 0 | 0.02 | 100 | None | Storage |
| 50 | 0.07 | 125 | None | Optimal Assay |
| 150 | 0.17 | 115 | Slight | Assay (sub-opt) |
| 300 | 0.32 | 75 | Moderate | Not Recommended |
| 500 | 0.52 | 20 | Heavy | Avoid |
Table 2: Common Redox Buffers and Their Properties
| Redox Couple | E°' at pH 7.0 (mV) | Typical Total [Couple] | Useful pH Range | Key Application |
|---|---|---|---|---|
| GSH/GSSG | -240 | 2-10 mM | 6.5-8.5 | General thiol enzymes |
| Cysteine/Cystine | -220 | 1-5 mM | 6.0-8.5 | Specific active sites |
| DTTred/DTTox* | -330 | 1-5 mM | 6.5-9.0 | Strong reducing agent |
| β-Mercaptoethanol | - | 0.1-1.0% v/v | 7.0-8.5 | Non-buffering reductant |
*DTT is not a true buffer but a strong reductant that defines a very low Eh.
Visualizations
Title: Ionic Strength Impact on Enzyme Stability
Title: Redox Potential Control for Enzyme Activity
The Scientist's Toolkit: Research Reagent Solutions
| Item | Function & Rationale |
|---|---|
| HEPES Buffer (1M, pH 7.0-8.0) | Superior biological buffer with minimal metal chelation, ideal for cofactor studies. |
| Ultrapure KCl/NaCl (≥99.99%) | Source of neutral ions for modulating ionic strength without introducing reactive impurities. |
| MgCl₂ or ZnCl₂ (Aqueous, TraceMetal Grade) | Essential divalent cation cofactors; metal-grade purity prevents inhibition by competing metals. |
| Reduced (GSH) & Oxidized (GSSG) Glutathione | Paired thiols for creating a defined, biologically relevant redox buffer environment. |
| TCEP-HCl (Tris(2-carboxyethyl)phosphine) | Odorless, stable, metal-free reducing agent superior to DTT for breaking disulfides. |
| EDTA (0.5M, pH 8.0) | Metal chelator used at low concentrations (0.1-1 mM) to sequester trace inhibitory metals. |
| Glycerol (Molecular Biology Grade) | Cryoprotectant and stabilizer (10-20% v/v) to reduce denaturation during storage and handling. |
| Anaerobic Chamber / Sealed Vials | Essential for working with oxygen-sensitive cofactors (e.g., Fe-S clusters, reduced flavins). |
Technical Support Center
Troubleshooting Guides & FAQs
Q1: My enzyme activity drops significantly during stirred-tank purification or formulation. What are the primary agitation-related causes and how can I mitigate them? A: Agitation introduces shear stress and creates air-liquid interfaces, both leading to interfacial denaturation. Key mitigation strategies include:
- Reduce Shear: Optimize impeller type (e.g., prefer pitched-blade over Rushton turbine) and lower tip speed (<1.5 m/s). Consider using shear-protective additives.
- Minimize Air Entrainment: Avoid vortex formation by using baffles. Subsurface sparging is preferable to surface aeration.
- Add Stabilizers: Incorporate non-ionic surfactants (e.g., Polysorbate 20/80) or polymers (e.g., PEG, Ficoll) to compete for the interface.
Q2: How can I prevent or reduce protein foaming during mixing or filling operations, and what should I do if foam is already present? A: Foam presents extensive air-water interfaces.
- Prevention: Add anti-foaming agents (e.g., silicone-based emulsions, Simethicone) or surface-active stabilizers prior to agitation. Control filling speeds to avoid splashing.
- Remediation: If foam forms, avoid destructive methods like vigorous spraying. Apply a gentle vacuum or a localized spray of a defoaming agent. Centrifugation can sometimes recover protein from persistent foam.
Q3: What are the most effective excipients to protect against surface-induced denaturation, and what are their mechanisms? A: Excipients function via competitive adsorption and surface tension reduction.
| Excipient Class | Example(s) | Typical Working Concentration | Proposed Mechanism |
|---|---|---|---|
| Non-ionic Surfactants | Polysorbate 20, Polysorbate 80 | 0.01% - 0.1% w/v | Compete for interface, reduce surface tension, prevent protein unfolding at boundary. |
| Polymers | PEG 3000-8000, Ficoll 70 | 0.1% - 2% w/v | Increase solution viscosity, reduce diffusion to interface, steric stabilization. |
| Sugars / Polyols | Sucrose, Sorbitol, Trehalose | 5% - 10% w/v | Preferential exclusion, which stabilizes native conformation, indirectly reducing interfacial affinity. |
| Proteins / Amino Acids | BSA, Human Serum Albumin, Glycine | 0.1% - 1% w/v (BSA) | Act as sacrificial agents, adsorbing at the interface in place of the target protein. |
Q4: I need a standardized lab-scale protocol to test an enzyme's susceptibility to interfacial stress. What method do you recommend? A: Protocol for Shear & Interface Stress Testing via Orbital Shaking Objective: Quantify activity loss due to combined agitation and surface exposure. Materials: Enzyme sample, assay reagents, orbital shaker, low-protein-binding microcentrifuge tubes (e.g., LoBind), protective excipients for testing. Procedure:
- Prepare identical enzyme samples (e.g., 1 mL) in desired formulation buffers, with and without protective excipients.
- Fill tubes to varying headspace volumes (e.g., 50% full for high interface, 90% full for low interface).
- Secure tubes on an orbital shaker platform. Run parallel, static controls stored on the bench.
- Agitate at a defined speed (e.g., 250 rpm) and temperature for a set duration (e.g., 2, 4, 8, 24 hours).
- At each time point, remove samples and immediately assay for enzymatic activity and concentration (e.g., via specific activity assay and SE-HPLC).
- Calculate percent activity recovery relative to the static control.
Q5: How do I distinguish between aggregation caused by interfacial denaturation versus other pathways (e.g., thermal)? A: Key diagnostic indicators are outlined below:
| Diagnostic Test | Interfacial Denaturation Signature | Thermal/Chemical Denaturation Signature |
|---|---|---|
| Onset Kinetics | Often rapid, correlates with intensity of mixing/foaming. | Correlates with temperature or time of exposure to denaturant. |
| Aggregate Type (SEC-MALS) | High molecular weight, insoluble aggregates often dominate. | Can produce soluble oligomers or insoluble aggregates. |
| Surface Tension Measurement | Surface tension of solution may decrease over time during stress. | Typically no change in surface tension. |
| Effect of Surfactants | Significant inhibition of aggregation upon addition. | Minimal to no protective effect. |
| Microscopy of Foam | Proteinaceous film visible at bubble interfaces. | Not applicable. |
The Scientist's Toolkit: Key Research Reagent Solutions
| Item | Function & Rationale |
|---|---|
| Low-Binding Tubes/Plates | Minimize protein adsorption to container walls, reducing surface-area-induced losses. |
| Non-ionic Surfactants (Polysorbate 20/80) | Gold-standard for interfacial protection; competitively adsorb to air-liquid and solid-liquid interfaces. |
| Silicone-based Anti-foam Emulsions | Rapidly collapse pre-existing foam structures during processing steps. |
| Precision Orbital Shaker | Provides reproducible, controlled agitation stress for comparative stability studies. |
| Tensiometer (Surface Tensiometer) | Quantifies surface tension changes, confirming interfacial activity of protein/excipient. |
| Size-Exclusion HPLC (SEC-HPLC) | Monitors soluble aggregate formation and monomer loss with high resolution. |
| Microfluidic Shear Device | Applies defined, quantifiable laminar or extensional shear for mechanistic studies. |
Experimental Workflow for Interfacial Stress Analysis
Title: Interfacial Stress Test Workflow
Pathways to Aggregation from Interfacial Stress
Title: Interfacial Denaturation Aggregation Pathways
Troubleshooting Guides & FAQs
Q1: During primary drying, my product temperature approaches or exceeds the collapse temperature (Tc). What immediate steps should I take to prevent structural collapse and denaturation?
A: Immediately reduce the shelf temperature by 5-10°C to lower the product temperature. Ensure your chamber pressure is accurately controlled and not too low, as an excessively low pressure can increase heat transfer and raise product temperature. Verify the Tc of your formulation using Freeze-Dry Microscopy; typical Tc for amorphous formulations like sucrose-based buffers is between -30°C to -35°C. The primary drying phase must maintain product temperature at least 2-5°C below the Tc.
Q2: My enzyme shows significant loss of activity post-lyophilization. I suspect freeze-thaw stress during the freezing phase. How can I diagnose and mitigate this?
A: Freeze-thaw stress often results from pH shifts, ice crystal formation, and cryoconcentration. To diagnose, measure activity after freezing/thawing but before drying. Mitigation strategies include:
- Optimizing Cryoprotectants: Increase the concentration of amorphous stabilizers like sucrose or trehalose to 2-5% (w/v).
- Controlled Nucleation: Use an ice fog technique or a controlled nucleation device to induce freezing at a higher, more uniform temperature, leading to larger ice crystals and less interfacial stress.
- Annealing: Incorporate an annealing step (hold at -10°C to -25°C for several hours after initial freezing) to promote complete crystallization of bulking agents (e.g., mannitol) and allow for ice crystal growth.
Q3: How do I determine if my product has undergone collapse, and what are the consequences for an enzyme-based therapeutic?
A: Visual inspection shows a shrunken, irregular cake with poor reconstitution time (>3 minutes). Analytical assays reveal:
- Reduced Specific Activity: Loss of >15% compared to pre-lyophilization control.
- Increased Aggregation: Visible by Size-Exclusion Chromatography (SEC-HPLC).
- Moisture Content: May be abnormally low or high due to entrapped moisture. Consequences include irreversible denaturation of the enzyme's active site, reduced shelf-life stability, and potential immunogenicity due to aggregate formation.
Q4: My cycle is excessively long. What parameters can I safely adjust to reduce primary drying time without risking collapse?
A: The key is to maximize the driving force for sublimation (vapor pressure difference) while keeping product temperature < Tc. Adjust in this order:
- Safely Increase Shelf Temperature: If product temperature is >5°C below Tc, raise shelf temp in 2°C increments.
- Optimize Chamber Pressure: Find the "sweet spot" pressure that maximizes heat transfer. For most vials, this is between 50-150 mTorr. Use the Manometric Temperature Measurement (MTM) or Tunable Diode Laser Absorption Spectroscopy (TDLAS) to monitor sublimation rate in real-time.
- Reduce Cake Resistance: Ensure a controlled nucleation step to create larger ice crystals, resulting in a more porous cake with lower resistance.
Experimental Protocols
Protocol 1: Determination of Critical Temperatures (Tc, Tg') via Freeze-Dry Microscopy (FDM) Objective: To visually determine the collapse temperature (Tc) and glass transition of the frozen solution (Tg'). Materials: FDM stage, cryo-system, small sample aliquot (~2 µL), cover slip, temperature controller. Method:
- Place a 2 µL droplet of the formulation between a cover slip on the FDM stage.
- Cool the stage rapidly to -50°C and hold for 5 min to freeze the sample.
- Set the vacuum to ~200 mTorr and begin controlled warming at a rate of 2°C/min.
- Continuously observe the frozen structure under polarized light. The temperature at which the microscopic structure begins to lose rigidity and flow/viscously collapse is recorded as the Tc.
- The onset of ice melting can indicate Tg'. Data Application: Set primary drying shelf temperature to keep product temperature 2-5°C below the measured Tc.
Protocol 2: Formulation Screening for Enzyme Stabilization Objective: To identify optimal excipients that protect against both freezing and drying stresses. Method:
- Prepare 1 mL aliquots of the enzyme in buffers containing various stabilizers (see Toolkit Table).
- Split each sample: (A) immediate activity assay, (B) freeze-thaw cycle x3, (C) full lyophilization.
- Use a standard activity assay (e.g., spectrophotometric kinetics) to determine residual activity for conditions B and C relative to A.
- Analyze data to select the formulation yielding >90% recovery post-lyophilization.
Research Reagent Solutions Toolkit
| Item | Function in Lyophilization |
|---|---|
| Sucrose/Trehalose (2-5% w/v) | Amorphous stabilizer; forms a glassy matrix that protects enzymes by water substitution and vitrification, preventing denaturation during drying. |
| Mannitol (3-5% w/v) | Crystalline bulking agent; provides elegant cake structure but offers no direct protein stabilization. Must be fully crystallized via annealing. |
| Polysorbate 80 (0.01-0.1% w/v) | Surfactant; minimizes surface-induced denaturation at the ice-water or air-water interface during freezing and drying. |
| Histidine or Potassium Phosphate Buffer | Buffer system; maintains pH. Avoid sodium phosphate due to pH shift during freezing. Use concentration ≤ 50 mM. |
| Dextran or Hydroxyethyl Starch (1-5%) | Bulk filler/Stabilizer; used for very low protein concentration formulations to provide cake structure and may offer cryoprotection. |
Data Presentation
Table 1: Impact of Stabilizers on Enzyme Recovery Post-Lyophilization
| Formulation (Enzyme @ 1 mg/mL) | Residual Activity Post Freeze-Thaw (%) | Residual Activity Post Lyophilization (%) | Cake Appearance |
|---|---|---|---|
| 20 mM His Buffer Only | 45 ± 5 | 20 ± 8 | Collapsed, Shrunken |
| Buffer + 3% Sucrose | 92 ± 3 | 88 ± 4 | Elegant, Porous |
| Buffer + 3% Mannitol | 48 ± 4 | 25 ± 6 | Elegant, Crystalline |
| Buffer + 3% Sucrose + 0.02% PS80 | 95 ± 2 | 95 ± 3 | Elegant, Porous |
Table 2: Optimized Cycle Parameters for an Amorphous Enzyme Formulation (Tc = -33°C)
| Process Step | Shelf Temp (°C) | Hold Time (hr) | Chamber Pressure (mTorr) | Objective |
|---|---|---|---|---|
| Freezing | -45 | 2.0 | ATM | Solidification |
| Annealing | -20 | 4.0 | ATM | Complete crystallization |
| Primary Drying | -25 | 40 | 100 | Sublimate ice (Tprod ~ -36°C) |
| Secondary Drying | 25 (ramp) | 10 | 50 | Desorb bound water |
Visualizations
Title: Enzyme Freeze-Thaw Stress Pathway & Mitigations
Title: Lyophilization Cycle Development Workflow
Technical Support Center: Troubleshooting & FAQs
Q1: Our in-line NIR probe is showing significant signal drift during a fermentation run, leading to unreliable glucose concentration predictions. What could be the cause and how can we correct it? A: Signal drift in NIR spectroscopy is a common PAT challenge. Primary causes are (1) changes in process conditions (temperature, pressure, air bubbles) affecting the optical interface, or (2) fouling of the probe window. For immediate correction, pause the measurement and perform a manual reference scan or "dark current" measurement as per your instrument's protocol. Long-term, implement a scheduled cleaning-in-place (CIP) protocol for the probe. For experiments focused on enzyme denaturation, ensure temperature fluctuations near the probe are minimized, as this can alter the water absorption spectrum, a key NIR reference.
Q2: Our Raman spectroscopy data for monitoring protein conformational change shows high background noise, obscuring the amide I band. How do we improve signal quality? A: High fluorescence background is typical in bioprocess streams. First, optimize the laser wavelength; a 785 nm laser typically generates less fluorescence than 532 nm. Second, increase integration time to improve the signal-to-noise ratio, but ensure this does not compromise the real-time nature of your monitoring (e.g., a 60-second scan may be acceptable). Third, apply a baseline correction algorithm (e.g., asymmetric least squares) post-acquisition. For denaturation studies, consistently high noise may indicate the presence of fluorescent impurities from cell lysis, requiring a review of harvest timing.
Q3: When using dielectric spectroscopy for biomass monitoring, the capacitance signal plateaus unexpectedly in the late growth phase, contradicting offline cell count data. What does this indicate? A: A plateau in the permittivity signal (often at ~0.5-100 MHz frequencies) can indicate a physiological shift in the cells, not necessarily a cessation of growth. In the context of enzyme production, this often signals a shift from growth to production phase, where cell size and membrane integrity change. Verify by taking a sample for viability staining (e.g., trypan blue). If viability is high, the signal is accurate, reflecting stable, metabolically active biomass. Calibrate your model using viable cell density, not total cell count.
Q4: Our chemometric model (PLS) for predicting product titer from MIR spectra performs well in one bioreactor but fails when applied to another of the same design. How do we ensure model robustness? A: This is a model transferability issue. Key factors are (1) probe positioning and (2) subtle differences in reactor environment affecting the spectra. Implement a standardization protocol: collect spectra from both reactors during a water calibration run under standard process conditions. Use spectral preprocessing techniques like Standard Normal Variate (SNV) or Direct Standardization (DS) to correct for systematic differences. For stability studies, ensure the calibration set includes data across the full range of intended process conditions (pH, temperature shifts that induce denaturation).
Q5: We are implementing an FBRM (Focused Beam Reflectance Measurement) probe to monitor aggregate formation. The chord count increases dramatically after a pH shift. How do we distinguish product aggregates from cell debris? A: This is critical for instability monitoring. Use a complementary method: take a sample and analyze it via off-line microscopy (with a stain specific for your protein product, if available) to confirm the nature of particles. Experimentally, perform a controlled, small-scale test: induce aggregation by intentionally shifting to a known destabilizing pH and track the FBRM trend. Correlate this with sample analysis via SEC-HPLC. This creates a reference library. FBRM cannot identify particle composition, so it must be part of a PAT toolbox.
Table 1: Common PAT Tools for Stability Monitoring & Key Performance Indicators
| PAT Tool | Measured Parameter | Typical Frequency | Key Advantage for Denaturation Studies | Common Calibration Challenge |
|---|---|---|---|---|
| Near-Infrared (NIR) | Substrates (Glucose), Metabolites, Biomass | Seconds to Minutes | Non-invasive, multi-parameter | Susceptible to water signal & temperature drift |
| Raman Spectroscopy | Protein Conformation, Product Titer, Metabolites | 1-5 Minutes | Provides structural info (e.g., amide I/III bands) | Fluorescence background from media |
| Dielectric Spectroscopy | Viable Biomass (Capacitance) | Seconds | Direct measure of viable cell volume | Signal plateaus at high cell density |
| FBRM | Particle Count & Size (Chord Length) | Seconds | Real-time aggregation monitoring | Cannot distinguish particle type |
| MIR/ATR-FTIR | Protein Secondary Structure, Concentrations | 1-3 Minutes | Direct probing of amide bands for denaturation | Probe fouling in dense cultures |
Table 2: Correlation Between PAT Signals and Physical Instability Indicators
| Instability Event | Primary PAT Signal | Secondary PAT Signal | Offline Validation Method |
|---|---|---|---|
| Enzyme Unfolding | Raman: Shift in Amide I band (1650-1680 cm⁻¹) | MIR: Change in α-helix/β-sheet ratio | Circular Dichroism (CD) Spectroscopy |
| Soluble Aggregate Formation | FBRM: Increase in fine chord counts (2-10 μm) | Turbidity: Rising baseline in NIR | Size-Exclusion HPLC (SEC-HPLC) |
| Precipitation | FBRM: Rapid increase in large chord counts (>100 μm) | NIR: Scattering increase | Visual inspection, Centrifugation |
| Cell Lysis (leading to host protein contamination) | Dielectric: Drop in capacitance | Raman: Appearance of DNA/RNA bands | Viability stain, Conductivity spike |
Experimental Protocols
Protocol 1: Establishing a Raman Spectroscopy Method for Monitoring Protein Conformational Stability In-Line Objective: To detect real-time changes in the secondary structure of a target enzyme during a bioreactor process. Materials: Bioreactor equipped with immersion Raman probe (785 nm laser recommended), chemometric software, sampling kit for offline validation. Procedure:
- Pre-process Calibration: With the reactor containing buffer only, collect a reference spectrum. Set laser power and integration time to avoid saturation (typical range: 400-500 mW, 30-60 sec integration).
- Spectral Collection: Initiate bioprocess. Collect spectra at 5-minute intervals. Focus on the "fingerprint region" (600-1800 cm⁻¹) and the amide I band (~1650-1680 cm⁻¹).
- Data Preprocessing: Apply smoothing (Savitzky-Golay) and baseline correction to each live spectrum. Use vector normalization.
- Model Development (Offline): Use offline CD spectroscopy or FTIR on samples taken at key times to classify spectra as "native" or "denatured." Build a PLS-DA or SIMCA model correlating spectral features to conformation.
- Real-time Prediction: Implement the model in the process software to output a "Stability Index" in real time.
- Validation: Trigger a controlled denaturation event (e.g., a temperature ramp) and confirm the PAT system alarms coincide with offline CD detection of unfolding.
Protocol 2: Using FBRM and NIR in Tandem to Monitor Aggregation in Real-Time Objective: To distinguish growth-related particle changes from product aggregation. Materials: Bioreactor with in-line FBRM probe and transflectance NIR probe, peristaltic pump for bypass loop (for FBRM if not immersion), SEC-HPLC. Procedure:
- Baseline Establishment: During the early growth phase, record baseline FBRM chord length distribution (CLD) and NIR spectra.
- Monitoring Phase: Log CLD counts in the 1-10 μm and 10-50 μm bins every 2 minutes. Simultaneously, monitor the NIR scattering signal (often at the high wavenumber end, e.g., 9000-9500 cm⁻¹).
- Perturbation Test: At a predetermined point, induce a stressor known to cause aggregation (e.g., shift pH by 0.5 units outside optimal range).
- Data Correlation: Observe the timing and magnitude of response in both tools. True product aggregation typically shows a correlated rise in FBRM fine counts and NIR scattering.
- Offline Correlation: At points of signal change, aseptically sample and analyze by SEC-HPLC to quantify monomer loss and aggregate formation. Correlate aggregate percentage with PAT signal magnitudes to build a quantitative model.
Visualization: Diagrams
Diagram Title: PAT-Enabled Stability Monitoring Feedback Loop
Diagram Title: Data Integration for Denaturation Thesis Research
The Scientist's Toolkit: Key Research Reagent Solutions
Table 3: Essential Materials for PAT-Enabled Stability Experiments
| Item | Function in PAT Stability Research | Key Consideration |
|---|---|---|
| Chemometric Software (e.g., SIMCA, Unscrambler) | For developing PLS/PCA models that correlate spectral data to stability parameters. | Must enable real-time prediction and model updating. |
| Calibration Standards for Spectroscopy | Certified standards (e.g., glucose, ammonium) for building quantitative NIR/MIR models. | Must be matrix-matched to culture media to avoid prediction errors. |
| Stability-Indicating Assay Kits | Offline validation (e.g., fluorescence-based thermal shift kits, static light scattering). | Provides ground-truth data for PAT model training and validation. |
| Probe Cleaning Solutions & Kits | For maintaining signal integrity of immersion probes (e.g., mild acids, enzymes for biofilm). | Must be compatible with probe materials and not leave interfering residues. |
| Model Enzyme/Protein | A well-characterized protein (e.g., Lysozyme, BSA) for method development and stress testing. | Known denaturation profile allows for controlled PAT system challenge. |
| Data Integration Platform (e.g., Pi System, UNICORN) | To unify PAT data streams with traditional process data (pH, DO, temp). | Essential for holistic process analysis and root-cause investigation of instability. |
Validating Stability & Benchmarking Methods: Metrics for Reliable Comparison and Deployment
FAQs & Troubleshooting Guides
Q1: What is the fundamental concept of a stability-indicating assay (SIA) in the context of enzyme research?
A: A stability-indicating assay (SIA) is a validated analytical method that can accurately and reliably measure the active enzyme concentration (functional activity) while simultaneously detecting and quantifying changes in the enzyme's structure (e.g., aggregation, fragmentation, deamidation) that result from degradation or denaturation. Within our thesis on physical instability, the SIA links specific structural metrics (like particle count, secondary structure loss) directly to the loss of specific functional activity (e.g., catalytic rate, substrate binding), providing a predictive model for enzyme shelf-life and performance under stress.
Q2: During forced degradation studies, my enzyme shows less than 10% loss in functional activity, but size-exclusion chromatography (SEC) shows a significant increase in high-molecular-weight species (HMWS). How should I interpret this?
A: This is a common observation indicating early-stage aggregation. The functional assay may still measure the activity of non-aggregated monomers, while SEC is more sensitive to the formation of soluble aggregates that may remain catalytically active but are thermodynamically unstable precursors to larger, inactive precipitates. This disconnect is precisely why multiple analytical techniques are required. Your SIA should track both metrics. A recommended action is to subject the sample to additional stress (e.g., mild heat, freeze-thaw) and re-measure; the activity will likely drop precipitously as aggregation progresses.
Q3: My circular dichroism (CD) spectroscopy data shows a loss of alpha-helical content after thermal stress, but my activity assay shows no change. Is the structural change irrelevant?
A: Not necessarily. This could indicate: 1) The loss of helical structure is in a region not critical for the active site or catalysis (e.g., a stabilizing domain). 2) Your activity assay conditions (dilution into optimal buffer/temperature) may allow for partial refolding of the enzyme during the measurement, masking the instability. To troubleshoot, perform the activity assay at a stress-relevant temperature (e.g., 37°C instead of 25°C) or use a real-time, continuous activity measurement immediately after stress to capture transient denaturation.
Q4: When developing a high-throughput screening SIA, which stability metric should I prioritize for correlating with functional loss?
A: Current research (2023-2024) suggests that for predicting long-term physical instability, subvisible particle count (measured by microflow imaging or resonant mass measurement) and thermal melt midpoint (Tm) shift (from differential scanning fluorimetry, DSF) often show the highest correlation with functional decay across many enzyme classes. These are amenable to high-throughput formats. See the quantitative data summary below.
Table 1: Correlation Coefficients (R²) Between Structural Metrics and Residual Activity After Accelerated Stability Studies for Model Enzymes (Lysozyme, mAb-Conjugated Enzymes).
| Structural/Physical Metric | Analytical Technique | Avg. R² vs. Activity Loss | Time to Result | HT-Compatible? |
|---|---|---|---|---|
| Thermal Shift (ΔTm) | Differential Scanning Fluorimetry (DSF) | 0.89 | 1-2 hours | Yes |
| Subvisible Particles (>2µm) | Microflow Imaging (MFI) | 0.85 | 30 min | Moderate |
| Monomer Loss (%) | Size-Exclusion Chromatography (SEC) | 0.78 | 30-60 min | Low |
| Z-Average Diameter Increase | Dynamic Light Scattering (DLS) | 0.72 | 5 min | Yes |
| Surface Hydrophobicity | ANS/DS Fluorescence | 0.81 | 15 min | Yes |
Detailed Experimental Protocols
Protocol 1: Linking Thermal Unfolding (DSF) to Functional Activity
Objective: To determine the correlation between the enzyme's thermal stability (Tm) and its residual specific activity after exposure to isothermal stress.
Materials: See "The Scientist's Toolkit" below. Method:
- Sample Preparation: Aliquot the enzyme formulation into PCR tubes or a 96-well plate. Include a buffer-only blank.
- Isothermal Stress: Place aliquots in a thermal cycler or oven at a sub-denaturing stress temperature (e.g., 40°C, 45°C). Remove replicate tubes at defined timepoints (t=0, 1, 2, 4, 7, 14 days).
- DSF Measurement (Post-Stress): a. Centrifuge stressed samples briefly to collect condensation. b. Mix 10 µL of sample with 10 µL of 10X SYPRO Orange dye in a real-time PCR tube. c. Run a thermal ramp from 25°C to 95°C at a rate of 1°C/min with fluorescence acquisition. d. Calculate the Tm using the first derivative of the fluorescence curve.
- Functional Activity Assay (Post-Stress): a. Dilute stressed samples into assay buffer to a concentration within the linear range. b. Immediately initiate the reaction with saturating substrate. c. Measure initial velocity (e.g., absorbance, fluorescence change per minute). d. Calculate specific activity relative to the t=0 control.
- Data Correlation: Plot ΔTm (Tmt - Tmt0) vs. % Residual Specific Activity for each timepoint. Perform linear or non-linear regression to establish the relationship.
Protocol 2: High-Throughput SIA Using DLS and Microplate Activity Readout
Objective: Rapidly screen formulation excipients for their ability to prevent agitation-induced aggregation and activity loss.
Method:
- Formulation Plate Setup: Prepare a 96-well plate with different candidate formulations (varying buffers, salts, stabilizers, surfactants). Dispense identical enzyme concentrations into each well.
- Controlled Stress: Seal the plate and subject it to orbital agitation (e.g., 1000 rpm) at 25°C for 24 hours in a plate shaker. Include a non-agitated control plate.
- DLS Measurement (In-situ): Using a plate reader DLS system, measure the Z-average diameter and polydispersity index (PdI) of each well directly.
- Immediate Activity Assay: Using the same plate, add assay buffer and substrate via injector system. Measure the kinetic signal over 5-10 minutes.
- Analysis: Calculate % activity remaining (stressed/control) and correlate with the increase in Z-average diameter. Optimal formulations will minimize size increase and maximize activity retention.
Diagrams
Diagram 1: SIA Development & Correlation Workflow
Diagram 2: Enzyme Instability Pathways & Assay Links
The Scientist's Toolkit: Key Research Reagent Solutions
Table 2: Essential Materials for Stability-Indicating Assay Development
| Item / Reagent | Function / Role in SIA | Example Vendor/Product |
|---|---|---|
| SYPRO Orange Dye | Fluorescent dye used in DSF to monitor protein unfolding by binding hydrophobic patches exposed during denaturation. | Thermo Fisher Scientific, Sigma-Aldrich |
| Recombinant Lysyl Endopeptidase | Highly pure, stable enzyme used as a model system for developing SIAs due to its well-characterized structure and activity. | Takara Bio, rLys-C |
| ANS (1-Anilinonaphthalene-8-sulfonate) | Fluorescent probe for detecting changes in surface hydrophobicity, an early marker of unfolding. | MilliporeSigma |
| Stable Substrate Analogue (e.g., MCA-peptide) | Fluorogenic or chromogenic substrate for continuous, real-time kinetic activity measurements under stress conditions. | Peptide Institute, R&D Systems |
| Size-Exclusion HPLC Columns (e.g., AdvanceBio SEC) | For high-resolution separation of monomeric enzyme from aggregates and fragments. | Agilent Technologies |
| Formulation Excipient Library | A set of buffers, sugars, polyols, amino acids, and surfactants for screening stabilizing conditions. | Hampton Research, Formatrix |
| Microflow Imaging (MFI) Particle Standards | Polystyrene beads of known size for calibrating and validating subvisible particle counting instruments. | ProteinSimple, Micromod |
| Differential Scanning Calorimetry (DSC) Capillary Cells | High-sensitivity cells for measuring absolute thermal stability (Tm, ΔH) of enzymes in formulation. | Malvern Panalytical |
Technical Support Center
Troubleshooting Guides & FAQs
Q1: During an ASS for a lyophilized enzyme, we observed an unexpected increase in enzymatic activity at the initial 40°C timepoint, followed by a sharp decline. What could cause this? A: This is a common anomaly indicating initial structural relaxation or disaggregation before thermal denaturation dominates.
- Check: The reconstitution protocol (buffer, temperature, time). Ensure identical reconstitution for all samples.
- Action: Run complementary assays: Dynamic Light Scattering (DLS) to check for initial monomerization, and Differential Scanning Calorimetry (DSC) to identify the protein's glass transition temperature (Tg). The storage temperature (40°C) may be near or above the Tg of the formulation, causing a transient physical change.
Q2: Our ICH Q1A(R2)-based ASS predicts a shelf life of 24 months at 2-8°C, but real-time data at 12 months shows significant loss of activity. Where did our prediction fail? A: The prediction likely failed due to an invalid linear extrapolation from high-temperature data, often caused by a change in the degradation mechanism at lower temperatures.
- Check: The Arrhenius plot (ln(k) vs. 1/T). Look for non-linearity, indicating a shift in the rate-limiting step (e.g., from chemical degradation at high T to physical aggregation at low T).
- Action: Incorporate data from intermediate temperatures (e.g., 25°C) and use a more conservative model (e.g., reduced maximum allowable degradation). Implement assays for subvisible particles and SEC-HPLC for aggregates at the real-time condition.
Q3: When performing ASS on a liquid enzyme formulation, what are the critical controls for physical instability, and how are they measured? A: Physical instability is a primary failure mode not always predicted by chemical stability assays.
- Controls & Measurements:
- Visual Inspection: Against a white/black background for color, clarity, particulates.
- Subvisible Particles: Using light obscuration or micro-flow imaging per USP <787> or <1787>.
- Aggregation: Size-Exclusion Chromatography (SEC-HPLC) for soluble aggregates, and Dynamic Light Scattering (DLS) for hydrodynamic radius.
- Turbidity: Measured by absorbance at 350 nm (A350).
- Activity Assay: The primary functional readout must be correlated with physical changes.
Summarized Quantitative Data
Table 1: ICH Q1A(R2) Recommended Stability Testing Conditions for Climatic Zones III & IV
| Study Type | Temperature | Relative Humidity | Minimum Time Period at Submission |
|---|---|---|---|
| Long-Term* | 25°C ± 2°C | 60% ± 5% RH | 12 months |
| Intermediate | 30°C ± 2°C | 65% ± 5% RH | 6 months |
| Accelerated | 40°C ± 2°C | 75% ± 5% RH | 6 months |
*Can be 30°C ± 2°C / 65% ± 5% RH per alternative labeling.
Table 2: Example ASS Data for Hypothetical Enzyme ALP-1
| Condition (Time) | % Potency Remaining (Mean ± SD) | % High-Molecular Weight Aggregates | Appearance |
|---|---|---|---|
| Initial | 100.0 ± 2.5 | 0.5 | Clear, colorless |
| 40°C / 1 Month | 98.5 ± 1.8 | 1.2 | Clear, colorless |
| 40°C / 3 Months | 95.1 ± 2.1 | 3.8 | Slightly opalescent |
| 40°C / 6 Months | 89.3 ± 3.4 | 8.7 | Opalescent |
| 25°C / 12 Months (Real-Time) | 94.8 ± 1.9 | 4.1 | Clear, slight opalescence |
Experimental Protocols
Protocol 1: Conducting an ICH-Compliant Accelerated Stability Study for a Liquid Enzyme Formulation
- Sample Preparation: Fill the enzyme product in its final marketed container-closure system (e.g., 3mL Type I glass vials with butyl rubber stopper). Prepare a minimum of 60 units.
- Storage Chambers: Place samples in validated stability chambers set at 40°C ± 2°C / 75% ± 5% RH. Include calibrated temperature/RH data loggers.
- Timepoints: Remove a minimum of n=3 independent units at t=0, 1, 2, 3, and 6 months.
- Analysis: For each timepoint, perform:
- Visual Inspection (USP <1>).
- Potency Assay (enzyme-specific kinetic activity assay).
- Purity Assay (SEC-HPLC to quantify monomers and aggregates).
- pH Measurement.
- Data Analysis: Plot % label claim (potency) vs. time. Determine the degradation rate constant (k) at 40°C using zero or first-order kinetics. Use the Arrhenius equation to extrapolate k to the recommended storage temperature (e.g., 5°C) and predict shelf life.
Protocol 2: Monitoring Physical Denaturation via Dynamic Light Scattering (DLS)
- Sample Prep: Clarify enzyme solution by centrifugation at 10,000-15,000xg for 10 minutes. Filter through a 0.22 µm syringe filter (protein-low binding).
- Instrument Setup: Equilibrate DLS instrument (e.g., Malvern Zetasizer) at 25°C. Use a disposable microcuvette.
- Measurement: Load 50-100 µL of sample. Set measurement angle to 173° (backscatter). Perform a minimum of 12 sub-runs.
- Data Collection: Record the Z-average diameter (d.nm) and the Polydispersity Index (PDI). Analyze correlation function for mono/multi-modal size distribution.
- Interpretation: An increasing Z-average and PDI >0.2 over time indicates aggregation and physical instability.
Visualizations
The Scientist's Toolkit: Research Reagent Solutions
Table 3: Essential Materials for Enzyme Stability Studies
| Item | Function & Rationale |
|---|---|
| Validated Stability Chambers | Provide precise, ICH-compliant control of temperature and humidity for forced degradation studies. |
| Size-Exclusion HPLC (SEC-HPLC) Columns (e.g., Tosoh TSKgel, Waters UPLC) | Separate and quantify native enzyme monomers from higher molecular weight aggregates, a key metric of physical instability. |
| Dynamic Light Scattering (DLS) Instrument | Measures hydrodynamic size and size distribution of particles in solution, critical for detecting early-stage aggregation. |
| Forced Degradation Buffers (e.g., Wide-range pH buffers, Oxidizing agents) | Systematically challenge enzyme stability to identify degradation pathways and validate assay stability-indicating power. |
| Low-Protein Binding Filters & Tubes (e.g., PVDF membranes, polypropylene tubes) | Minimize loss of enzyme, especially low-concentration samples, via surface adsorption during sample preparation. |
| Differential Scanning Calorimetry (DSC) | Determines the protein's melting temperature (Tm) and formulation Tg, informing appropriate ASS temperature selection. |
| Activity Assay Substrates & Reagents | Enzyme-specific kits or components to accurately measure catalytic function as the primary stability indicator. |
Introduction Within the critical field of enzymes research, combating physical instability and denaturation is paramount for advancing drug discovery and biochemical applications. This technical support center provides targeted guidance for researchers evaluating the cost-effectiveness and scalability of contemporary enzyme stabilization platforms, including polymer-based matrices, silica-based mesoporous materials, lipid-based systems, and protein engineering approaches. The following troubleshooting guides and FAQs address common experimental challenges.
Troubleshooting Guides & FAQs
Q1: After immobilizing my enzyme on a polymer-based support, I observe a >70% loss in specific activity. What are the primary causes? A: A significant activity drop post-immobilization typically stems from suboptimal binding chemistry or diffusion limitations.
- Cause A – Non-Specific or Multi-Point Binding: Random orientation or excessive covalent attachments can distort the enzyme's active site.
- Troubleshooting: Introduce a spacer arm (e.g., PEG linker) between the support and the coupling agent. Shift from amine-reactive (e.g., glutaraldehyde) to site-directed chemistry (e.g., targeting histidine tags or free cysteine residues).
- Cause B – Mass Transfer Limitations: Substrates cannot efficiently diffuse into the support matrix, or products are trapped.
- Troubleshooting: Use a support with larger pore diameter (>2x the hydrodynamic radius of your enzyme). Increase agitation rate during your reaction to reduce the external boundary layer.
Q2: My silica-encapsulated enzyme shows excellent stability in the first 5 cycles but a sharp decline in activity thereafter. How can I improve operational stability? A: This pattern often indicates mechanical fracture of the silica matrix or gradual leaching of the enzyme.
- Solution: Optimize the sol-gel encapsulation protocol to strengthen the silica network.
- Protocol: Increase the molar ratio of tetraethyl orthosilicate (TEOS) precursor to water (e.g., from 1:4 to 1:8) and include a co-precursor like methyltrimethoxysilane (MTMS) at 20% molar ratio. This creates a more hydrophobic, flexible, and crack-resistant xerogel. Ensure a slow, controlled drying phase (over 48-72 hours at 4°C) to prevent capillary stress and cracking.
Q3: When scaling up a lipid-based stabilization (e.g., in nanodiscs or liposomes) from 1 mL to 100 mL batch size, my encapsulation efficiency plummets. What parameters should I control? A: Scaling lipid-based systems requires precise control of mixing dynamics and purification.
- Critical Parameters:
- Mixing Energy & Time: Maintain consistent shear force during lipid self-assembly. If using direct sonication, ensure the probe tip energy input per volume (J/mL) is constant. Transitioning to high-pressure homogenization may be necessary for reproducibility.
- Purification Scalability: Size-exclusion chromatography (SEC) may not be feasible at 100 mL. Switch to tangential flow filtration (TFF) with an appropriate molecular weight cut-off (MWCO) membrane to concentrate and exchange buffers while retaining vesicles/discs.
Data Presentation: Platform Comparison
Table 1: Cost & Performance Analysis of Stabilization Platforms
| Platform | Typical Immobilization Yield | Relative Cost per mg enzyme stabilized (Material) | Estimated Stability Half-life (t1/2) Improvement | Reusability (Cycles to 50% activity) | Key Scalability Challenge |
|---|---|---|---|---|---|
| Polymer Beads (e.g., epoxy-activated) | 60-80% | $ | 3-5x | 10-20 | Column packing & pressure drop in flow reactors |
| Mesoporous Silica (e.g., SBA-15) | 70-90% | $$ | 5-10x | 25-50 | Consistent nanopore synthesis at >100g batch |
| Lipid Nanodiscs (MSP-based) | 30-50% (encapsulation) | $$$$ | 2-4x (in solution) | Not reusable, single-use | High cost of membrane scaffold proteins (MSP) |
| Genetic Fusion (e.g., with elastin-like polypeptides) | N/A (soluble) | $$ (operational) | 4-8x (thermal) | N/A | Fermentation scale-up and downstream purification |
Experimental Protocols
Protocol 1: Assessing pH Stability of Immobilized Enzymes Objective: Compare the pH stability profiles of free vs. immobilized enzyme. Methodology:
- Incubation: Aliquot identical activity units of free and immobilized enzyme into separate buffers spanning pH 3-10 (50 mM citrate-phosphate-borate buffer series). Incubate at 25°C for 1 hour with gentle mixing.
- Recovery & Assay: Pellet immobilized enzyme by centrifugation (30s, 5000g). Wash both forms with optimal pH assay buffer. Measure residual activity immediately using a standard spectrophotometric assay.
- Analysis: Plot residual activity (%) vs. pH. The platform showing the broadest pH retention (e.g., >80% activity over 4 pH units) indicates superior stabilization against pH-induced denaturation.
Protocol 2: Accelerated Thermal Stability (Half-life Determination) Objective: Quantify the thermal stabilization factor provided by the platform. Methodology:
- Incubation: Suspend free and immobilized enzyme in a thermally stable buffer (e.g., 50 mM HEPES, pH 7.5) at a challenging temperature (e.g., 60°C).
- Sampling: Withdraw aliquots at defined time intervals (e.g., 0, 5, 15, 30, 60, 120 min). Immediately cool samples on ice.
- Activity Measurement: Assay all samples under optimal conditions. Plot Ln(Residual Activity) vs. time. The slope (k) = inactivation rate constant.
- Calculation: Calculate thermal half-life: t1/2 = Ln(2)/k. The Stabilization Factor = (t1/2 immobilized) / (t1/2 free).
Visualizations
Diagram 1: Enzyme Stabilization Platform Decision Workflow
Diagram 2: Key Denaturation Pathways & Stabilization Targets
The Scientist's Toolkit: Key Research Reagent Solutions
Table 2: Essential Materials for Enzyme Stabilization Studies
| Item | Function & Rationale |
|---|---|
| Epoxy-activated Agarose Beads | Common polymer support. Epoxy groups react with amine, thiol, or hydroxyl groups on enzymes for multipoint covalent attachment, enhancing rigidity. |
| Aminopropyl-triethoxysilane (APTES) | Silane coupling agent. Functionalizes silica or glass surfaces with primary amine groups for subsequent enzyme conjugation. |
| Membrane Scaffold Protein (MSP1E3D1) | A genetically engineered apolipoprotein variant that self-assembles with lipids to form homogeneous nanodiscs, providing a native-like bilayer environment for membrane enzyme stabilization. |
| Elastin-Like Polypeptide (ELP) Tag | A thermally responsive protein polymer. When genetically fused to a target enzyme, it can undergo reversible phase separation, allowing easy purification and conferring enhanced thermal stability. |
| Trehalose | A biocompatible osmolyte and cryoprotectant. Used as an additive or co-lyophilization agent to protect enzymes from dehydration and thermal stress by forming a stable hydrogen-bonding network. |
| Glutaraldehyde (25% solution) | A homobifunctional crosslinker. Used to activate amine-bearing supports or create crosslinks between enzyme molecules (crosslinked enzyme aggregates, CLEAs) for carrier-free immobilization. |
Technical Support Center: Troubleshooting Guides & FAQs
FAQ: General Enzyme Stability
Q1: Why does my industrial hydrolase (e.g., cellulase) rapidly lose activity at 50°C despite being marketed as thermostable?
A: Commercial thermostability claims are often based on optimal buffer conditions with substrate protection. Activity loss is likely due to:
- Aggregation: Partial unfolding exposes hydrophobic regions, leading to irreversible aggregation.
- Chemical Denaturation: Deamidation of asparagine/glutamine residues or oxidation of methionine/cysteine at elevated temperatures.
- Metal Ion Depletion: Many industrial hydrolases require Ca²⁺ or other ions for structural integrity. Check if your buffer or substrate contains chelating agents (e.g., EDTA, citrate).
- Troubleshooting Protocol:
- Perform a Differential Scanning Fluorimetry (DSF) assay to determine the actual melting temperature (Tm) in your specific reaction mixture.
- Add stabilizers (5-10% glycerol, 0.1-1 mg/mL BSA) or kosmotropic salts (e.g., 100-200 mM ammonium sulfate).
- Ensure the presence of required metal ions (e.g., 1-5 mM CaCl₂).
Q2: My PEGylated asparaginase preparation shows sub-therapeutic efficacy in the cell-based assay. What are the potential causes?
A: This indicates a potential loss of functional activity post-PEGylation or in the assay environment.
- Over-PEGylation: Excessive PEG chains can sterically block the active site. Analyze the degree of PEGylation (e.g., mass spectrometry, TNBS assay for free lysines).
- Incorrect PEG Conjugation Chemistry: If conjugation targets a critical catalytic residue, activity is lost. Use site-directed mutagenesis to replace sensitive residues with non-reactive ones (e.g., cysteine to serine) before site-specific PEGylation.
- Instability in Assay Media: Serum components or cellular proteases may degrade the enzyme. Include protease inhibitors in your assay and confirm stability via SDS-PAGE.
- Troubleshooting Protocol:
- Quantify enzymatic activity (asparagine hydrolysis rate) of the PEGylated product versus the native enzyme using a validated kinetic assay (see protocol below).
- Test activity in the exact cell culture medium over 72 hours to simulate assay conditions.
FAQ: Quantification & Characterization
Q3: How do I accurately measure the residual activity of a partially denatured enzyme sample?
A: Use a continuous, coupled assay for real-time monitoring.
- For Hydrolases (Proteases, Lipases): Use chromogenic/fluorogenic substrates (e.g., p-nitroanilide or MCA-derivatives). Monitor the increase in absorbance/fluorescence.
- For Asparaginase: Use a coupled assay with glutaminase and glutamate dehydrogenase, monitoring NADH consumption at 340 nm.
- Critical Control: Always run a standard curve with the native enzyme of known concentration alongside denatured samples. Account for inner filter effects in turbid, aggregated samples.
Q4: What are the key quantitative differences in stability parameters between industrial and therapeutic enzymes?
A: See the table below for a structured comparison.
Table 1: Comparative Stability Metrics: Industrial Hydrolases vs. Therapeutic Enzymes
| Parameter | Industrial Hydrolase (e.g., Subtilisin) | Therapeutic Enzyme (e.g., PEGylated E. coli Asparaginase) |
|---|---|---|
| Typical Formulation Goal | High specific activity, cost-effectiveness, shelf-life | Long circulation half-life, low immunogenicity, target efficacy |
| Key Stressors | High temp (50-70°C), organic solvents, pH extremes, shear force | Physiological temp (37°C), proteolysis, immune clearance, opsonization |
| Primary Instability Mechanism | Aggregation, chemical degradation at active site | Renal clearance, anti-drug antibodies, antigenic epitope recognition |
| Half-life (t₁/₂) | Months to years (in dry formulation) | ~5-7 days (PEGylated vs. 1-1.5 days for native) |
| Key Stabilization Strategy | Immobilization, engineering disulfide bonds, lyophilization with sugars | PEGylation, glycosylation, albumin fusion, protein engineering |
| Critical Quality Attribute (CQA) | Activity units/mg, wash performance | Activity in plasma, circulation time, immunogenicity rate |
Experimental Protocols
Protocol 1: Determining Melting Temperature (Tm) via Differential Scanning Fluorimetry (DSF) Purpose: To assess the physical stability and thermal unfolding of an enzyme. Reagents: SYPRO Orange dye (5,000X stock), enzyme in formulation buffer, white 96-well PCR plate. Method:
- Dilute SYPRO Orange to 50X in buffer.
- Mix 18 µL of enzyme sample (0.2-0.5 mg/mL) with 2 µL of 50X dye in a well.
- Run in a real-time PCR instrument: Ramp from 25°C to 95°C at 1°C/min, measuring fluorescence (ROX/FAM channel).
- Analyze data: Plot derivative (-dF/dT) vs. temperature. The peak minimum is the Tm.
Protocol 2: Kinetic Assay for L-Asparaginase Activity Purpose: To determine the specific activity of native and PEGylated asparaginase. Reagents: 100 mM L-asparagine in 50 mM Tris-HCl (pH 8.5), Nessler's reagent, Sarcosine Buffer (0.1M, pH 10.5). Method:
- Reaction: Incubate 0.1 mL enzyme sample with 0.5 mL L-asparagine solution at 37°C for 30 min.
- Stop & Develop: Add 0.1 mL of 1.5M Trichloroacetic Acid. Centrifuge. Take 0.1 mL supernatant, add 3.7 mL water, 0.1 mL Sarcosine buffer, and 0.1 mL Nessler's reagent.
- Read: Incubate 10 min at room temp. Measure absorbance at 480 nm.
- Calculate: Compare to an ammonium sulfate standard curve. One unit liberates 1 µmol of ammonia per minute at 37°C.
Visualizations
Title: Enzyme Instability Pathways Leading to Functional Loss
Title: PEGylation Mechanism to Extend Therapeutic Enzyme Half-life
The Scientist's Toolkit: Research Reagent Solutions
Table 2: Essential Reagents for Enzyme Stability Research
| Reagent / Material | Function in Stability Research | Example Use Case |
|---|---|---|
| SYPRO Orange Dye | Fluorescent probe that binds hydrophobic patches exposed during protein unfolding. | DSF assays to determine melting temperature (Tm). |
| Chromogenic Substrate (e.g., pNPA, pNA-derivatives) | Releases colored product upon enzymatic hydrolysis, enabling real-time activity tracking. | Measuring residual activity of stressed hydrolase samples. |
| Methoxy PEG-Succinimidyl Carbonate (mPEG-SC) | Amine-reactive PEGylating agent for lysine conjugation. | Creating PEGylated asparaginase to study half-life extension. |
| Size-Exclusion Chromatography (SEC) Column | Separates proteins based on hydrodynamic radius. | Detecting soluble aggregates in enzyme formulations post-stress. |
| Differential Scanning Calorimetry (DSC) Cell | Directly measures heat capacity changes during protein unfolding. | Determining intrinsic thermostability (ΔH, Tm) of enzyme variants. |
| Protease Inhibitor Cocktail | Inhibits a broad spectrum of serine, cysteine, and metalloproteases. | Maintaining integrity of therapeutic enzymes in serum-containing assays. |
Troubleshooting Guides and FAQs
Q1: Our therapeutic enzyme shows significant activity loss after 3 months of accelerated stability testing (40°C/75% RH). What are the key formulation parameters we should investigate first? A: The primary parameters to investigate are: (1) pH of the formulation buffer – even minor shifts can drastically alter protonation states critical for catalysis. (2) Presence of stabilizers – assess the concentration of polyols (e.g., sucrose, trehalose) or amino acids (e.g., glycine, arginine) which can provide preferential exclusion. (3) Residual moisture content – for lyophilized products, aim for <1% moisture. Use Karl Fischer titration to verify.
Q2: During diagnostic kit development, our enzyme conjugate shows aggregation upon thawing. How can we prevent this? A: This is a common physical instability issue. Implement the following protocol:
- Formulation Optimization: Add a non-reducing sugar (e.g., 5% trehalose) and a surfactant (e.g., 0.01% Polysorbate 20).
- Controlled Freeze/Thaw Protocol:
- Freeze rapidly in a dry ice/ethanol bath.
- Store at -80°C.
- Thaw rapidly in a 37°C water bath with gentle swirling until just liquid.
- Post-Thaw Analysis: Immediately filter through a 0.22 µm filter and analyze by dynamic light scattering (DLS) for aggregate size.
Q3: What are the ICH guidelines for stability testing of enzyme-based biotherapeutics, and how do they differ from small molecules? A: Enzymes fall under ICH Q5C (Quality of Biotechnological Products: Stability Testing). Key differences include:
- Forced Degradation: Must include conditions that specifically target protein structure (e.g., agitation, freeze-thaw, oxidation) in addition to standard hydrolytic stress.
- Potency Assay: Stability-indicating assays must measure specific biological activity (in units like µmol/min/mg), not just chemical purity.
- Real-Time/Real-Temperature: Long-term stability must be conducted at the proposed storage temperature (e.g., 2-8°C) for the entire proposed shelf life.
Q4: Our stability data shows subvisible particles are increasing over time. What analytical methods are required for documentation? A: Regulatory submissions require a combination of methods as per USP <787> and <1787>:
- Microflow Imaging (MFI) or Flow Microscopy: Provides particle count, size distribution (≥2 µm), and morphology.
- Light Obscuration (LO): USP <788> method for counts of ≥10 µm and ≥25 µm particles.
- SE-HPLC with MALS Detection: To differentiate between protein aggregates and silicone oil or other extrinsic particles.
Table 1: Accelerated Stability Study of Lyophilized Therapeutic Enzyme X
| Condition (40°C/75% RH) | Time Point | Potency (% Initial) | Moisture Content (%) | Subvisible Particles (>10 µm/mL) | SE-HPLC Main Peak (%) |
|---|---|---|---|---|---|
| Initial | 0 Months | 100.0 | 0.8 | 4,500 | 99.1 |
| Intermediate | 3 Months | 95.2 | 1.1 | 6,200 | 98.5 |
| Final | 6 Months | 89.5 | 1.5 | 12,800 | 97.0 |
Table 2: Effect of Stabilizers on Diagnostic Enzyme Conjugate Stability (4°C)
| Stabilizer Formulation | 12-Month Activity Retention (%) | Aggregation by DLS (% >100 nm) | Recommended Use Case |
|---|---|---|---|
| PBS Only | 62 | 15.2 | Control (not recommended) |
| 5% Sucrose | 78 | 8.5 | Liquid storage < 1 month |
| 1% Glycine + 0.01% PS 20 | 92 | 2.1 | Long-term liquid storage (2-8°C) |
| Lyophilized (5% Trehalose) | 98 | 0.5 | Long-term storage (>2 years) |
Detailed Experimental Protocols
Protocol 1: Forced Degradation Study for Regulatory Submission
Objective: To identify likely degradation pathways and validate stability-indicating assays. Materials: Enzyme drug substance, formulation buffer, stress agents. Method:
- Oxidative Stress: Incubate enzyme (1 mg/mL) with 0.1% hydrogen peroxide at 25°C for 1 hour. Quench with catalase.
- Thermal Stress: Incubate samples at 40°C, 50°C, and 60°C for 1 hour.
- pH Stress: Dialyze samples into buffers at pH 3.0, 5.0, 7.4, and 9.0. Hold at 25°C for 2 hours.
- Agitation Stress: Vortex a 1 mL sample at maximum speed for 30 minutes.
- Analysis: Assay all samples immediately for activity (specific assay), SE-HPLC for aggregates, and capillary electrophoresis for charge variants.
Protocol 2: Determining Thermal Transition (Tm) by DSF
Objective: To rapidly screen formulation conditions for thermal stability. Materials: Enzyme sample, SYPRO Orange dye, real-time PCR instrument, 96-well PCR plates. Method:
- Prepare 20 µL samples in varying formulation buffers (e.g., different pH, salts, excipients) at 0.2 mg/mL protein concentration.
- Add 1 µL of 500X SYPRO Orange dye (diluted 1:100 in buffer) to each sample.
- Run in a real-time PCR instrument with a temperature gradient from 25°C to 95°C, increasing at 1°C/min.
- Monitor fluorescence (excitation/emission ~470/570 nm). The Tm is the inflection point of the fluorescence vs. temperature curve.
- Documentation: Report the Tm for each formulation as a key comparability metric.
Diagrams
Title: Enzyme Instability Pathways Under Stress
Title: Regulatory Stability Study Workflow
The Scientist's Toolkit: Research Reagent Solutions
| Item | Function in Enzyme Stability Research |
|---|---|
| Differential Scanning Fluorimetry (DSF) Dyes (e.g., SYPRO Orange) | Binds to hydrophobic patches exposed upon unfolding, allowing high-throughput thermal stability (Tm) screening of formulations. |
| Precision Buffer Kits (e.g., 0.1 pH unit increments) | Essential for defining the optimal pH stability profile, as enzyme activity and stability are highly pH-dependent. |
| Stabilizing Excipients (e.g., Trehalose, Sucrose, Arginine HCl) | Provide preferential exclusion, reducing protein-protein interactions and increasing conformational stability in solution and solid state. |
| Surfactants (e.g., Polysorbate 20/80, Poloxamer 188) | Minimize surface-induced denaturation and aggregation at air-liquid and solid-liquid interfaces during processing. |
| Protease Inhibitor Cocktails | Prevent activity loss and clipping due to low-level proteolytic contamination during long-term stability studies. |
| ANIONIC/ Cation Exchange Resins | Used in formulation to remove ionic impurities and achieve high buffer consistency crucial for regulatory lot-to-lot comparability. |
| Certified Reference Standards | Well-characterized enzyme standard required for calibrating potency assays and demonstrating assay validity for stability studies. |
Conclusion
The successful mitigation of enzyme instability requires a holistic, multi-faceted approach that integrates fundamental understanding of protein chemistry with advanced engineering and formulation methodologies. As outlined, progress begins with a precise diagnosis of the degradation pathway, followed by the strategic selection and combination of stabilization techniques—from genetic fortification to intelligent formulation. The ultimate validation of any strategy lies in its demonstrable success under relevant storage and process conditions, assessed through rigorous, comparative metrics. Future directions point toward the increased use of machine learning for de novo stable enzyme design, the development of next-generation smart biomaterials for responsive immobilization, and the creation of universal stabilization platforms for emerging therapeutic modalities like CRISPR-associated enzymes. Mastering enzyme stability is not merely a technical challenge but a critical enabler for the next generation of biocatalysts and biotherapeutics, with profound implications for sustainable manufacturing and personalized medicine.