High-Throughput Screening of Enzyme Variants: From Machine Learning to Functional Validation
This comprehensive review explores the cutting-edge methodologies and applications in high-throughput screening of enzyme variants, a critical tool in modern drug discovery and protein engineering.
High-Throughput Screening of Enzyme Variants: From Machine Learning to Functional Validation
Abstract
This comprehensive review explores the cutting-edge methodologies and applications in high-throughput screening of enzyme variants, a critical tool in modern drug discovery and protein engineering. We examine the foundational principles of HTS as a tool for running millions of biological tests rapidly, primarily in drug discovery processes to identify biologically relevant compounds. The article delves into innovative approaches including machine-learning guided cell-free platforms for engineering enzymes, structural determinants of variant effect predictability, and computational pre-screening methods. For researchers and drug development professionals, we provide practical troubleshooting guidance for common experimental challenges and detailed frameworks for functional validation and assay development. Finally, we present comparative analyses of different screening methodologies and their applications in green chemistry and biomedical research, offering insights into future directions for the field.
Understanding High-Throughput Screening: Foundations and Evolving Paradigms
High-throughput screening (HTS) represents a fundamental methodology in modern scientific discovery, enabling the rapid execution of millions of chemical, genetic, or pharmacological tests [1]. This approach has become indispensable in drug discovery and enzyme engineering, transforming how researchers identify active compounds, antibodies, or genes that modulate specific biomolecular pathways [1]. In the context of enzyme variant research, HTS provides the technological foundation for directed evolution experiments, where identifying desired mutants from vast libraries represents the primary bottleneck [2]. The core principle of HTS lies in leveraging automation, miniaturization, and parallel processing to dramatically increase testing capacity while reducing reagent consumption and time requirements. Successful evolutionary enzyme engineering depends critically on having a robust HTS method, which significantly increases the probability of obtaining variants with desired properties while substantially reducing development time and cost [2].
Fundamental Principles and Scale of HTS
Core Principles
HTS operates on several interconnected principles that enable its remarkable throughput capabilities. Miniaturization is achieved through microtiter plates containing 96, 384, 1536, 3456, or even 6144 wells, dramatically reducing reaction volumes and reagent consumption [1]. Automation integrates robotic systems for plate handling, liquid transfer, and detection, enabling continuous operation with minimal human intervention [1]. Parallel processing allows simultaneous testing of thousands of compounds against biological targets, while sensitive detection methods capture subtle biological responses even in miniaturized formats [3].
The scale of HTS is categorized by daily screening capacity. Traditional HTS typically processes 10,000-100,000 compounds per day, while ultra-high-throughput screening (uHTS) exceeds 100,000 compounds daily [1]. Recent advances using drop-based microfluidics have demonstrated screening capabilities of 100 million reactions in 10 hours at one-millionth the cost of conventional techniques [1].
Quantitative Scale of HTS Operations
Table 1: HTS Scale and Corresponding Parameters
| Screening Scale | Throughput (Compounds/Day) | Well Formats | Volume Range | Typical Applications |
|---|---|---|---|---|
| Standard HTS | 10,000-100,000 | 96, 384, 1536 | 1-100 μL | Primary screening, enzyme engineering |
| uHTS | >100,000 | 1536, 3456, 6144 | 50 nL-5 μL | Large library screening, quantitative HTS |
| Microfluidic HTS | >1,000,000 | Droplet-based | Picoliter-nanoliter | Directed evolution, single-cell analysis |
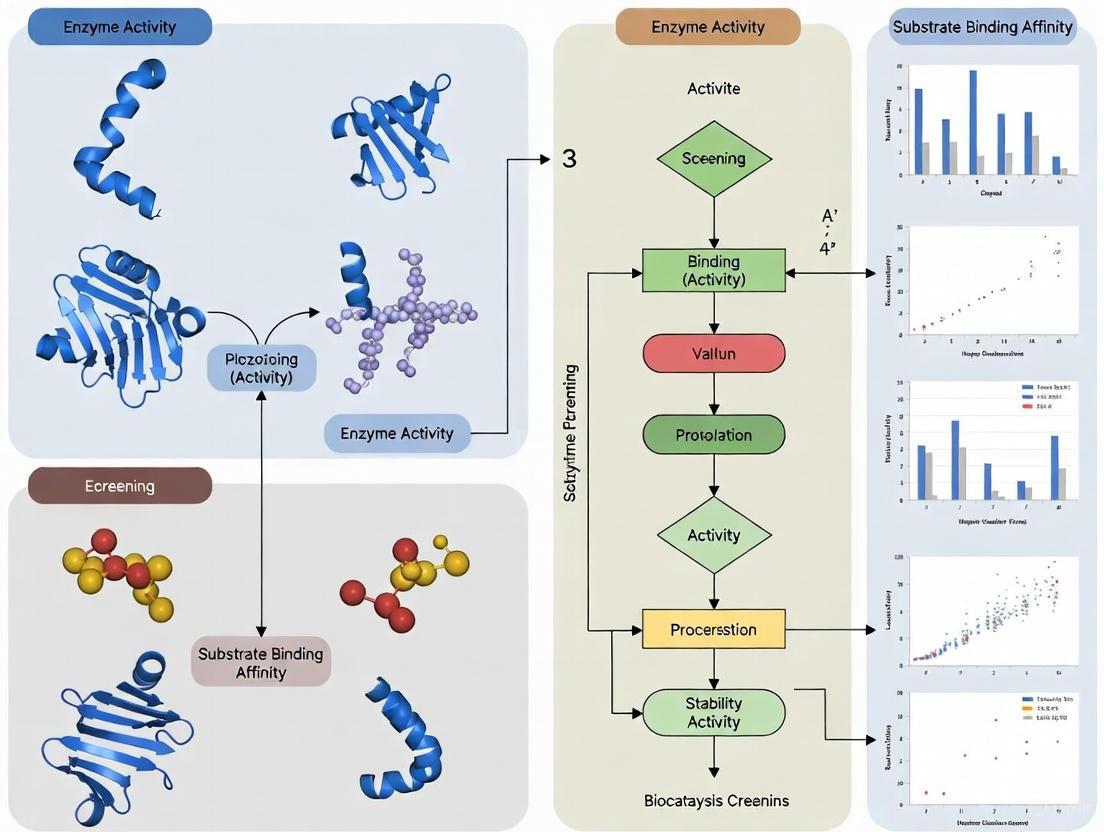
HTS Experimental Workflow for Enzyme Variant Screening
The following diagram illustrates the core HTS workflow for screening enzyme variants, integrating both computational and experimental components:
HTS Workflow for Enzyme Variant Screening
Library Generation and Computational Filtering
The process begins with creating diverse enzyme variant libraries. Recent advances integrate computational filtering to reduce experimental burden. For instance, structure-based filtering using AlphaFold-predicted models can narrow candidate sets from tens of thousands to manageable numbers [4]. In one case, structural similarity filtering reduced candidates from 15,405 to just 24 promising variants for experimental testing [4]. This computational pre-screening significantly enhances the probability of identifying functional enzymes.
Assay Preparation and Miniaturization
Assay plates are prepared by transferring nanoliter volumes from stock plates to empty microplates using automated liquid handling systems [1]. The biological entities (e.g., cells, enzymes) are then added to each well. For enzyme variant screening, this typically involves expressing target enzymes in host systems like E. coli and preparing cell extracts or purified proteins [5]. The miniaturized format allows testing thousands of conditions while conserving precious reagents.
Key HTS Methodologies for Enzyme Variant Research
Screening vs. Selection Approaches
HTS methods for enzyme engineering fall into two main categories: screening and selection. Screening involves evaluating individual variants for desired properties, while selection automatically eliminates nonfunctional variants by applying selective pressure [2]. Selection methods enable assessment of much larger libraries (exceeding 10^11 variants) but may miss subtle functional improvements [2].
Table 2: Comparison of HTS Methodologies for Enzyme Variants
| Methodology | Throughput | Key Features | Applications in Enzyme Engineering | Limitations |
|---|---|---|---|---|
| Microtiter Plates | 10^3-10^4 variants | Compatible with colorimetric/fluorometric assays; amenable to automation [2] | Enzyme activity assays, substrate specificity profiling [2] [3] | Limited by well number and volume requirements |
| Fluorescence-Activated Cell Sorting (FACS) | Up to 30,000 cells/sec [2] | High-speed sorting based on fluorescent signals; compatible with surface display [2] [6] | Product entrapment assays, GFP-reporter systems, bond-forming enzymes [2] | Requires intracellular or surface-displayed signals [6] |
| In Vitro Compartmentalization (IVTC) | >10^7 variants [2] | Water-in-oil emulsion droplets as picoliter reactors; circumvents cellular regulation [2] | Oxygen-sensitive enzymes, directed evolution without transformation [2] | Compatibility challenges between transcription-translation and screening conditions [2] |
| Droplet-based Microfluidics | >1,000 variants/sec [6] | Pico-to-nanoliter droplets as microreactors; measures intra- and extracellular enzymes [6] | Hydrolases, oxidoreductases, isomerases screening [6] | Requires specialized equipment and optimization |
Detection and Signal Measurement Strategies
Detection methods vary based on the enzymatic reaction and assay design. Colorimetric or fluorometric assays are most convenient when substrates or products have distinguishable optical properties [2]. Fluorescence resonance energy transfer (FRET) utilizes energy transfer between chromophores to study protein interactions and conformations [2]. Resonance energy transfer methods, including FRET, enable distance-dependent detection of enzymatic cleavage or conformational changes [2]. For example, FRET-based protease assays have achieved 5,000-fold enrichment of active clones in a single screening round [2].
Detailed Experimental Protocols
Protocol 1: Microtiter Plate-Based Screening for Enzyme Activity
This protocol adapts established methods for identifying active enzyme variants from directed evolution libraries [2] [3].
Materials:
- 384-well microtiter plates (clear bottom for absorbance/fluorescence readings)
- Automated liquid handling system
- Multichannel pipettes
- Plate reader capable of absorbance and fluorescence measurements
- Enzyme variants in cell lysates or purified form
- Enzyme-specific substrate solution
- Reaction buffer optimized for the target enzyme
- Positive control (wild-type enzyme)
- Negative control (heat-inactivated enzyme or empty vector lysate)
Procedure:
- Plate Preparation: Dispense 10-50 μL of each enzyme variant into designated wells using automated liquid handling. Include positive and negative controls in each plate.
- Reaction Initiation: Add substrate solution to each well to initiate reaction. Final reaction volumes typically range 20-100 μL.
- Incubation: Incubate plates at optimal enzyme temperature for a predetermined time (30 minutes to 2 hours).
- Signal Detection: Measure product formation using plate reader:
- For colorimetric assays: Read absorbance at appropriate wavelength
- For fluorometric assays: Read fluorescence with appropriate excitation/emission filters
- Data Collection: Export raw data for analysis, including well identifiers and signal intensities.
Quality Control:
- Calculate Z'-factor using positive and negative controls: Z' = 1 - [3×(σp + σn) / |μp - μn|]
- Accept assays with Z' > 0.5 for excellent robustness [3]
- Include replicate controls to assess intra-plate variability
Protocol 2: Computational Filtering of Enzyme Variants Prior to Experimental Screening
This protocol utilizes structural similarity filtering to reduce experimental burden, based on recently demonstrated approaches [5] [4].
Materials:
- Seed enzyme sequence in FASTA format
- Access to sequence databases (UniProt, SwissProt, TrEMBL)
- AlphaFold Protein Structure Database access
- Structural alignment software (TM-align)
- Sequence analysis tools (PSI-BLAST, CD-HIT)
Procedure:
- Sequence-Based Search:
- Perform PSI-BLAST search with seed sequence against protein databases
- Use e-value threshold of 10 and inclusion threshold of 0.001 for 4 iterations
- Cluster results with ≥99% identity using CD-HIT to generate non-redundant set
Sequence Length Filtering:
- Filter sequences based on length similarity to seed protein
- Remove sequences significantly longer or shorter than seed (e.g., ±30% length difference)
Structural Similarity Evaluation:
- Retrieve AlphaFold-predicted structures for candidate sequences
- For sequences without direct models, identify proxies with ≥95% sequence identity
- Perform pairwise structural alignment with seed using TM-align
- Calculate TM-score (0.5-1.0 indicates structural similarity) and seed coverage (≥70%)
Active Site Conservation Analysis:
- Map known active site residues from seed to candidate sequences
- Assess conservation of critical catalytic residues
- Select final candidates for experimental testing
Validation:
- This approach has demonstrated reduction from tens of thousands to dozens of candidates [4]
- Expected true positive rate: 50-150% improvement over random selection [5]
The Scientist's Toolkit: Essential Research Reagents and Materials
Table 3: Essential Research Reagents for HTS of Enzyme Variants
| Reagent/Material | Function | Examples/Specifications | Application Notes |
|---|---|---|---|
| Microtiter Plates | Miniaturized reaction vessels | 96, 384, 1536-well formats; clear bottom for reading | Higher density formats reduce reagent costs but require more sophisticated handling [1] |
| Fluorescent Probes | Detection of enzyme activity | Fluorogenic substrates, FRET pairs, environment-sensitive dyes | Select based on excitation/emission spectra compatible with available detectors [2] [3] |
| Cell Surface Display Systems | Phenotype-genotype linkage | Yeast, bacterial, or mammalian display systems | Enables FACS-based screening of enzyme libraries [2] |
| Emulsion Reagents | Compartmentalization | Water-in-oil surfactants, oil phases | Critical for in vitro compartmentalization approaches [2] [6] |
| Universal Detection Reagents | Broad applicability | Transcreener ADP² Assay, coupled enzyme systems | Enable screening multiple enzyme targets with same detection method [3] |
| Robotic Liquid Handlers | Automation of liquid transfer | Integrated systems with plate hotels | Essential for processing thousands of compounds daily [1] |
| High-Sensitivity Detectors | Signal measurement | Plate readers, FACS instruments, microfluidic sorters | Determine lower limits of detection and dynamic range [1] [6] |
Data Analysis and Hit Selection
Quality Control Metrics
Robust data analysis begins with quality assessment. The Z'-factor is widely used: Z' = 1 - [3×(σp + σn) / |μp - μn|], where σp and σn are standard deviations of positive and negative controls, and μp and μn are their means [3]. Values of 0.5-1.0 indicate excellent assay quality [3]. Strictly standardized mean difference (SSMD) provides an alternative approach that is particularly valuable for assessing data quality in HTS assays [1].
Hit Selection Strategies
Hit selection methods depend on replication design. For screens without replicates, robust methods like z-score or SSMD are appropriate [1]. These approaches assume each compound has similar variability to negative controls. For confirmatory screens with replicates, t-statistics or SSMD with sample estimation directly quantify effect sizes while accounting for variability [1].
The following diagram illustrates the decision process for hit selection in enzyme variant screening:
Hit Selection Decision Process
Emerging Trends and Future Perspectives
The field of HTS continues to evolve with several emerging trends. Artificial intelligence and machine learning are being integrated with experimental HTS to improve hit rates and predict compound efficacy [3]. Quantitative HTS (qHTS) paradigms generate full concentration-response curves for entire compound libraries, providing richer pharmacological data [7] [1]. Microfluidic technologies are pushing throughput boundaries while reducing volumes to picoliter scales and costs by million-fold factors [1] [6]. 3D cell cultures and organoids are creating more physiologically relevant screening environments for enzyme targeting applications [3].
For enzyme variant research specifically, computational approaches like neural network-based sequence generation coupled with experimental validation are showing promise. Recent studies have developed computational filters that improve experimental success rates by 50-150% when screening generated enzyme sequences [5]. The integration of AlphaFold-predicted structures for candidate prioritization further enhances the efficiency of identifying functional enzyme variants from sequence space [4].
As these technologies mature, HTS capabilities will continue to expand, enabling more sophisticated screening campaigns and accelerating the discovery and engineering of novel enzyme variants for therapeutic and industrial applications.
The Role of HTS in Modern Drug Discovery and Enzyme Engineering
High-Throughput Screening (HTS) has become the cornerstone of modern drug discovery and enzyme engineering, serving as the primary force driving the transformation of these fields [7]. This paradigm enables researchers to rapidly test thousands to hundreds of thousands of chemical compounds or enzyme variants to identify candidates with desired biological activities or catalytic properties. The emergence of Quantitative HTS (qHTS) represents a significant advancement, allowing multiple-concentration experiments to be performed simultaneously, thereby generating rich concentration-response data for thousands of compounds and providing lower false-positive and false-negative rates compared to traditional single-concentration HTS approaches [7]. In enzyme engineering, the development of compatible HTS methods has become the most critical factor for success in directed evolution experiments, as these methods considerably increase the probability of obtaining desired enzyme properties while significantly reducing development time and cost [2].
Core HTS Methodologies in Enzyme Engineering
Screening vs. Selection Approaches
High-throughput strategies in enzyme engineering primarily fall into two categories: screening methods and selection methods. Screening refers to the evaluation of individual protein variants for a desired property, while selection automatically eliminates non-functional variants through applied selective pressure [2]. Although screening provides a comprehensive analysis of each variant, its throughput is inherently limited by the need to assess individual clones. Selection methods, by contrast, enable the assessment of vastly larger libraries (exceeding 10^11 variants) by directly eliminating unwanted variants, allowing only positive candidates to proceed to subsequent rounds of directed evolution [2].
Established HTS Platforms and Technologies
Several established platforms form the technological foundation of modern HTS campaigns in enzyme engineering:
2.2.1 Microtiter Plate-Based Screening The microtiter plate remains a fundamental tool for HTS, miniaturizing traditional test tubes into multiple wells (96, 384, 1536, or higher density formats) [2]. While the 96-well plate is the most widely used format, higher density plates continue to push the boundaries of throughput. Traditional enzyme activity assays can be performed in microtiter plates using colorimetric or fluorometric detection methods, with throughput dramatically improved through robotic automation systems [2]. Recent advancements include micro-bioreactor systems like the Biolector, which enables online monitoring of light scatter and NADH fluorescence signals to indicate different levels of substrate hydrolysis or NADH-coupled enzyme activity [2].
2.2.2 Fluorescence-Activated Cell Sorting (FACS) FACS represents a powerful screening approach that sorts individual cells based on their fluorescent signals at remarkable speeds of up to 30,000 cells per second [2]. Key applications in enzyme engineering include surface display systems, in vitro compartmentalization, GFP-reporter assays, and product entrapment strategies. In product entrapment approaches, a fluorescent substrate that can traverse the cell membrane is converted to a product that becomes trapped inside the cell due to size, polarity, or chemical properties, enabling direct fluorescence-based sorting of active clones [2]. This method has identified glycosyltransferase variants with more than 400-fold enhanced activity for fluorescent selection substrates [2].
2.2.3 Cell Surface Display Technologies Cell surface display technologies fuse enzymes with anchoring motifs, enabling their expression on the outer surface of cells (including bacteria, yeast, and mammalian cells) where they can directly interact with substrates [2]. This positioning makes the displayed enzymes readily accessible for screening procedures. When combined with FACS, these systems have achieved remarkable efficiencies, with one reported method enabling a 6,000-fold enrichment of active clones after a single round of screening [2].
2.2.4 In Vitro Compartmentalization (IVTC) IVTC utilizes water-in-oil emulsion droplets or double emulsion droplets to create artificial compartments that isolate individual DNA molecules, forming independent reactors for cell-free protein synthesis and enzyme reactions [2]. This approach circumvents the regulatory networks of in vivo systems and eliminates transformation bottlenecks, thereby removing limitations imposed by host cell transformation efficiency. Droplet microfluidic devices compartmentalize reactants into picoliter volumes, offering shorter processing times, higher sensitivity, and greater throughput than standard assays [2]. IVTC has successfully identified β-galactosidase mutants with 300-fold higher kcat/KM values than wild-type enzymes [2].
Table 1: Comparison of Major HTS Methodologies in Enzyme Engineering
| Method | Throughput | Key Advantages | Limitations | Representative Applications |
|---|---|---|---|---|
| Microtiter Plates | Moderate (103-104 variants) | Compatibility with diverse assay types; well-established protocols | Limited by assay sensitivity and automation | Colorimetric/fluorometric enzyme assays; cell-based screening |
| FACS | High (up to 30,000 cells/sec) | Extreme speed; quantitative selection | Requires fluorescent signal generation | Product entrapment; surface display screening; GFP-reporter assays |
| Cell Surface Display | High (107-1011 variants) | Direct phenotype-genotype linkage; compatible with FACS | May not mimic native cellular environment | Bond-forming enzyme evolution; antibody engineering |
| In Vitro Compartmentalization | Very High (109 variants) | Bypasses cellular transformation; controlled reaction conditions | Optimization required for different enzymes | [FeFe] hydrogenase engineering; β-galactosidase evolution |
Integration of Machine Learning with HTS
The Machine Learning Revolution in Biocatalysis
Machine learning (ML) has emerged as a transformative technology in enzyme engineering, promising to revolutionize protein engineering for biocatalytic applications and significantly accelerate development timelines previously needed to optimize enzymes [8] [9]. ML tools help scientists navigate the complexity of functional protein sequence space by predicting sequence-function relationships, enabling more intelligent exploration of vast combinatorial possibilities. These approaches are particularly valuable for addressing the challenge of epistatic interactions, where combinations of mutations show non-additive effects that are difficult to predict through sequential screening alone [9].
ML-Guided Cell-Free Expression Platforms
Recent breakthroughs have integrated ML with cell-free gene expression systems to create powerful platforms for enzyme engineering. One such platform combines cell-free DNA assembly, cell-free gene expression, and functional assays to rapidly map fitness landscapes across protein sequence space [9]. This approach enables the evaluation of substrate preference for thousands of enzyme variants across numerous unique reactions, generating the extensive datasets needed to train predictive ML models. In a notable application, this platform engineered amide synthetases by evaluating 1,217 enzyme variants in 10,953 unique reactions, using the data to build augmented ridge regression ML models that predicted variants capable of synthesizing nine small-molecule pharmaceuticals with 1.6- to 42-fold improved activity relative to the parent enzyme [9].
Automated Robotic Platforms for Data Generation
To support data-intensive ML approaches, researchers have developed low-cost, robot-assisted pipelines for high-throughput protein purification and characterization. These systems address the critical need for cost-effective production of purified enzymes for accurate biophysical and activity assessments, which is essential for generating high-quality training data for ML models [10]. One such platform using the Opentrons OT-2 liquid-handling robot enables the parallel transformation, inoculation, and purification of 96 enzymes in a well-plate format, processing hundreds of enzymes weekly with minimal waste and reduced operational costs [10]. This accessibility democratizes automated protein production, facilitating the large-scale data generation required for robust ML model training.
Experimental Protocols and Workflows
Machine Learning-Guided Enzyme Engineering Protocol
The following workflow outlines an integrated ML-guided approach for enzyme engineering, adapted from recent literature [9]:
4.1.1 Substrate Scope Evaluation
- Begin by comprehensively evaluating the substrate promiscuity of the wild-type enzyme against an extensive array of potential substrates, including primary, secondary, alkyl, aromatic, complex pharmacophores, and challenging substrates with multiple functional groups [9].
- Identify both accessible and inaccessible products to guide engineering priorities. For example, in amide bond-forming enzymes, note that aliphatic acids are often poorly tolerated while aryl, benzoic, and cinnamic acids are more readily accepted [9].
4.1.2 Hot Spot Screening (HSS)
- Select residues for mutagenesis based on structural information (e.g., within 10Å of active site or substrate tunnels).
- Perform site-saturation mutagenesis on selected positions (64 residues × 19 amino acids = 1,216 total single mutants) [9].
- Express variants using cell-free protein synthesis systems to avoid transformation and cloning steps.
- Screen variants under industrially relevant conditions (e.g., high substrate concentration, low enzyme loading).
4.1.3 Machine Learning Model Training
- Use sequence-function data from HSS to train supervised ridge regression ML models augmented with evolutionary zero-shot fitness predictors [9].
- Ensure models can run on standard computer CPUs for accessibility.
- Focus models on predicting higher-order mutants with increased activity for specific chemical transformations.
4.1.4 Experimental Validation and Iteration
- Test ML-predicted enzyme variants for activity enhancement relative to parent enzyme.
- Incorporate validation results into subsequent training cycles for continuous model improvement.
- Apply divergent evolution strategies to convert generalist enzymes into multiple distinct specialists for different reactions [9].
Robot-Assisted High-Throughput Protein Purification Protocol
For laboratories implementing high-throughput enzyme screening, the following protocol enables parallel processing of 96 enzyme variants [10]:
4.2.1 Gene Synthesis and Cloning
- Employ plasmid constructs containing affinity tags and protease cleavage sites (e.g., pCDB179 with His-tag for Ni-affinity purification and SUMO site for proteolytic cleavage) [10].
- Perform codon optimization and commercial gene synthesis for target proteins.
- Use protease cleavage as the primary elution method to avoid high concentrations of imidazole or other elution agents that might interfere with downstream analyses.
4.2.2 Transformation and Expression
- Use chemically competent E. coli cells (e.g., Zymo Mix & Go!) transformed without heat shock [10].
- Grow transformation mix directly as starter cultures, bypassing plating and colony picking to save time and cost.
- Employ autoinduction media in 24-deep-well plates with 2mL cultures for improved aeration and higher yields.
- Incubate for approximately 40 hours at 30°C for optimal culture saturation.
4.2.3 Purification and Analysis
- Use liquid-handling robots (e.g., Opentrons OT-2) for magnetic bead-based purification.
- Implement Ni-charged magnetic beads for affinity capture.
- Perform on-bead protease cleavage using SUMO protease to release target protein without affinity tag remnants.
- Assess protein purity, yield (up to 400μg per purification), and activity for comprehensive characterization.
Table 2: Essential Research Reagent Solutions for HTS in Enzyme Engineering
| Reagent/Resource | Function | Implementation Example | Key Considerations |
|---|---|---|---|
| Liquid-Handling Robots | Automation of repetitive pipetting steps | Opentrons OT-2 for 96-well parallel processing | Low-cost (~$20,000-30,000 USD); open-source Python protocols [10] |
| Specialized Vectors | High-yield expression and purification | pCDB179 with His-SUMO tag | Enables tag-free purification via protease cleavage [10] |
| Cell-Free Expression Systems | Rapid protein synthesis without transformation | CFE for site-saturated libraries | Bypasses cellular transformation; 1-day variant production [9] |
| Magnetic Bead Purification | High-throughput affinity purification | Ni-charged beads for His-tagged proteins | Compatible with plate-based formats; enables parallel processing [10] |
| Fluorescent Reporters | Activity detection and sorting | GFP, CFP, YFP for FRET-based assays | Enables FACS screening when coupled with enzymatic activity [2] |
Data Analysis and Interpretation in qHTS
The Hill Equation in Quantitative HTS
The Hill equation (HEQN) remains the most widely used model for analyzing qHTS concentration-response data, offering a well-established framework for describing sigmoidal response curves with biologically interpretable parameters [7]. The logistic form of the HEQN is represented as:
[ Ri = E0 + \frac{(E{\infty} - E0)}{1 + \exp{-h[\log Ci - \log AC{50}]}} ]
Where (Ri) is the measured response at concentration (Ci), (E0) is the baseline response, (E{\infty}) is the maximal response, (AC{50}) is the concentration for half-maximal response, and (h) is the shape parameter [7]. The (AC{50}) and (E{max}) ((E{\infty} - E0)) parameters are frequently used to prioritize chemicals for further development, with (AC{50}) representing compound potency and (E_{max}) representing efficacy.
Challenges in Parameter Estimation
Despite its widespread use, HEQN parameter estimation presents significant statistical challenges in qHTS applications. Parameter estimates can be highly variable when the tested concentration range fails to include at least one of the two HEQN asymptotes, when responses are heteroscedastic, or when concentration spacing is suboptimal [7]. Simulation studies demonstrate that AC50 estimates show poor repeatability (spanning several orders of magnitude) when the lower asymptote is not established, particularly for curves with lower Emax values [7]. These limitations can lead to both false negatives (potent compounds with "flat" profiles declared inactive) and false positives (null compounds spuriously declared active due to random response variation).
Optimization Strategies for Reliable Results
To enhance the reliability of qHTS data analysis, several strategies have been developed:
- Increased Sample Size: Larger sample sizes through experimental replicates noticeably increase the precision of AC50 and Emax estimates [7].
- Optimal Study Designs: Development of optimized concentration ranges and spacing to improve nonlinear parameter estimation.
- Alternative Approaches: Utilization of methods with reliable performance characteristics across diverse response profiles, particularly for non-sigmoidal or non-monotonic relationships that cannot be adequately described by the HEQN [7].
High-Throughput Screening has evolved from a simple tool for testing compounds to a sophisticated, integrated platform that combines robotics, miniaturization, and computational intelligence. The convergence of HTS with machine learning represents a paradigm shift in enzyme engineering and drug discovery, enabling researchers to navigate vast sequence spaces with unprecedented efficiency. As these technologies become more accessible through low-cost automation and user-friendly ML implementations, their impact across biotechnology and pharmaceutical development will continue to expand. Future advancements will likely focus on increasing integration between experimental and computational approaches, enhancing predictive capabilities, and further reducing the time and cost required to engineer novel biocatalysts and discover therapeutic compounds.
In the field of enzyme engineering, the ability to predict the functional consequences of amino acid substitutions is paramount for accelerating the design of improved biocatalysts. While machine learning (ML) models have become powerful tools for computationally pre-screening enzyme variants, their performance in prospective applications remains inconsistent. A key challenge is that prediction accuracy can vary dramatically from one variant to another [11] [12]. Understanding the structural factors that contribute to this variability is crucial for developing more robust models and efficient engineering strategies. Recent research has systematically investigated how specific structural characteristics—including buriedness, proximity to the active site, number of contact residues, and presence of secondary structure elements—influence the predictability of variant effects [11]. This Application Note delineates the quantitative impact of these structural determinants and provides detailed protocols for integrating this knowledge into high-throughput screening workflows for enzyme engineering, framed within a broader thesis on optimizing variant effect prediction.
Quantitative Impact of Structural Determinants on Predictability
Recent research analyzing a combinatorial dataset of 3,706 enzyme variants revealed that all four tested structural characteristics significantly influence the accuracy of variant effect prediction (VEP) models. The study, which trained four different supervised ML models on structurally partitioned data, found that predictability strongly depended on buriedness, number of contact residues, proximity to the active site, and presence of secondary structure elements [11]. These dependencies were consistent across all tested models, indicating fundamental limitations in current algorithms' capacity to capture these structure-function relationships [11] [12].
Table 1: Structural Determinants of Variant Effect Predictability
| Structural Characteristic | Impact on Predictability | Experimental Evidence |
|---|---|---|
| Buriedness | Significant impact on model accuracy; residues with low solvent accessibility show different predictability patterns [11] [13]. | Analysis of 12 deep mutational scanning datasets; side chain accessibility ≤5% defined as buried [13]. |
| Active Site Proximity | Strong correlation with prediction error; mutations near catalytic sites less predictable [11]. | Partitions of variants based on distance to active site in novel 3,706-variant dataset [11] [12]. |
| Contact Residues | Number of residue-residue contacts influences model performance [11]. | Structural partitioning by contact number in high-order combinatorial dataset [11]. |
| Secondary Structure | Presence of specific secondary structure elements affects predictability [11]. | Training of VEP models on subsets grouped by secondary structure class [11]. |
The consistency of these findings across multiple enzyme datasets suggests they represent fundamental challenges in computational protein engineering rather than algorithm-specific limitations. This underscores the necessity of incorporating structural insights into both model development and experimental design.
Protocols for Structural Determinant Analysis in Enzyme Variants
Protocol 1: Classifying Buried and Active-Site Residues from Deep Mutational Scanning Data
Purpose: To identify buried and active-site residues using deep mutational scanning data, particularly when high-resolution structural information is limited.
Background: Deep mutational scanning reveals the impact of mutations on protein function through saturation mutagenesis and phenotypic screening [13]. distinguishing between buried residues and exposed active-site residues solely from mutational sensitivity patterns remains challenging without structural data.
Table 2: Key Reagents and Tools for Residue Classification
| Reagent/Tool | Function/Application |
|---|---|
| Deep Mutational Scanning Dataset | Provides functional scores for single-site mutations (e.g., 12 curated datasets [13]). |
| PROF or NetSurfP | Neural network-based prediction of sequence-based surface accessibility [13]. |
| NACCESS Program | Calculation of structure-based solvent accessibility from PDB files (% accessibility) [13]. |
| DEPTH Server | Computation of residue depth from protein structures [13]. |
| Rescaled Mutational Sensitivity Scores | Normalized scores (0 to -1) where -1 indicates high sensitivity and 0 indicates wild-type-like function [13]. |
Procedure:
Data Curation and Rescaling:
- Curate mutational effect scores from deep mutational scanning experiments. Ensure sufficient coverage of single-site mutations across the protein region of interest.
- Rescale the raw scores to a normalized range of 0 to -1 using the formula:
M_rescaled = (b - a) * [M - min(M)] / [max(M) - min(M)] + awhereMis the mutational effect score, andaandbare -1 and 0, respectively. This sets the most sensitive positions to approximately -1 and wild-type-like mutations to approximately 0 [13].
Accessibility Prediction:
- Calculate structure-based accessibility from available PDB structures using the NACCESS program. Define a residue as buried if its side chain accessibility is ≤5% and exposed if >5% [13].
- For proteins without resolved structures, predict sequence-based surface accessibility using computational tools like PROF or NetSurfP [13].
Residue Classification:
- Average the rescaled mutational sensitivity scores across all mutations for each position. Include only positions with mutational data for a minimum of 10 mutants.
- Classify residues using the following criteria [13]:
- Active-site residues: High mutational sensitivity (average score ≈ -1) AND predicted to be exposed.
- Buried residues: High mutational sensitivity AND predicted to be buried.
- Exposed non-active-site residues: Low mutational sensitivity (average score ≈ 0) AND predicted to be exposed.
Validation:
- Compare predictions with known catalytic sites identified through sequence conservation or structural homology.
- For proteins with available structures, validate classifications against experimental data from site-directed mutagenesis.
Protocol 2: Machine Learning-Guided Engineering with Structural Filtering
Purpose: To engineer enzyme variants with enhanced activity by integrating stability predictions and structural information into library design, thereby reducing screening burden and focusing on productive mutational paths.
Background: Traditional directed evolution screens large libraries where most mutations are neutral or deleterious. Filtering out destabilizing mutations based on structural and energy calculations enables more efficient exploration of sequence space [14] [9].
Procedure:
Target Identification:
- Based on substrate scope evaluation, select target reactions for engineering. For example, in engineering the amide synthetase McbA, target pharmaceutical compounds like moclobemide, metoclopramide, and cinchocaine [9].
- Identify residues for mutagenesis using structural analysis. Focus on residues within a defined radius (e.g., 6 Å) of the bound ligand or substrate and those lining access tunnels to the active site [14] [9].
Computational Filtering:
- Use protein modeling software (e.g., Rosetta) to calculate the change in free energy (ΔΔG) upon mutation for all possible single amino acid substitutions at targeted positions.
- Apply a stability threshold (e.g., ΔΔG ≤ -0.5 Rosetta Energy Units) to filter out mutations predicted to significantly destabilize the protein fold. This can exclude approximately 50% of possible mutations that are unlikely to be beneficial [14].
Library Construction and Screening:
- Construct the filtered library using high-throughput gene synthesis methods, such as overlap extension PCR with customized oligonucleotide pools [14] or cell-free DNA assembly [9].
- Express and screen variants using appropriate high-throughput assays. For transketolase engineering, this could involve pH-sensitive assays with colorimetric readouts or direct product detection via hydroxamate formation [15]. For amide synthetases, screen for product formation under industrially relevant conditions [9].
Machine Learning Integration:
- Use the collected sequence-function data to train supervised ML models (e.g., augmented ridge regression).
- Apply the trained models to predict higher-order combinatorial mutants with improved activity [9].
- Iterate the process through multiple rounds of design-build-test-learn (DBTL) cycles to continuously refine enzyme function.
The following diagram illustrates the integrated ML-guided engineering workflow that incorporates structural filtering:
The Scientist's Toolkit
Table 3: Essential Research Reagents and Computational Tools
| Category | Item | Application/Function |
|---|---|---|
| Experimental Assays | pH-sensitive assay (Phenol red/HPTS) | Indirect, high-throughput readout of catalytic activity via CO₂ release [15]. |
| Hydroxamate assay (Iron(III) chelation) | Direct, colorimetric product detection; suitable for liquid or solid-phase screening [15]. | |
| Computational Tools | Rosetta Protein Modeling Suite | Calculates ΔΔG for mutations to filter destabilizing variants from libraries [14]. |
| PROF/NetSurfP | Predicts sequence-based solvent accessibility for residue classification [13]. | |
| NACCESS/DEPTH server | Computes structure-based solvent accessibility and residue depth from PDB files [13]. | |
| Library Construction | Cell-free gene expression (CFE) | Enables rapid synthesis and testing of protein variants without cellular cloning [9]. |
| Overlap extension PCR | Assembles complex gene libraries from customized oligo pools for full-gene synthesis [14]. |
The structural determinants of buriedness, active site proximity, contact residues, and secondary structure elements are consistently significant factors influencing the predictability of enzyme variant effects. Acknowledging and systematically accounting for these determinants, as detailed in the provided protocols, enables more effective enzyme engineering. Strategies that integrate structural filtering to remove destabilizing mutations and employ ML-guided DBTL cycles can dramatically accelerate the evolution of enzymes, as demonstrated by the development of highly efficient Kemp eliminases in only five rounds [14] and specialized amide synthetases with up to 42-fold improved activity [9]. Future improvements in VEP models will likely stem from incorporating these structural characteristics as inductive biases and leveraging multi-modal protein data, ultimately leading to more predictive computational tools and efficient biocatalyst design.
The field of enzyme engineering is undergoing a revolutionary transformation, moving from traditional labor-intensive screening methods toward integrated systems that combine automation, high-throughput experimentation, and artificial intelligence. Traditional approaches to enzyme variant screening, such as directed evolution, have long been hampered by their reliance on extensive manual experimentation, limited throughput, and the challenge of navigating vast sequence spaces [16]. These methods typically required testing hundreds of variants over months or even years, creating a significant bottleneck in protein engineering pipelines [17] [16]. The emergence of high-throughput screening technologies and machine learning (ML) has fundamentally altered this landscape, enabling researchers to evaluate thousands of variants with unprecedented speed and precision. This paradigm shift is particularly evident in pharmaceutical development and green chemistry, where efficient enzyme engineering can significantly accelerate drug discovery and sustainable manufacturing processes [17] [18]. This Application Note details the key technologies driving this evolution and provides practical protocols for their implementation in modern enzyme variant analysis.
Quantitative Comparison of Screening Methodologies
The evolution from traditional to modern screening approaches has yielded dramatic improvements in key performance metrics. The following table summarizes these advancements across critical parameters.
Table 1: Performance Comparison of Enzyme Variant Screening Methodologies
| Screening Methodology | Throughput (Variants/Time) | Detection Sensitivity | Resource Consumption | Automation Compatibility |
|---|---|---|---|---|
| Traditional Plate-Based Assays | Hundreds per day | Moderate | High reagent costs, significant plastic waste | Low, primarily manual steps |
| Microfermentation Systems [19] | Thousands per day | High | Reduced reagent volumes (mL scale) | High, integrated robotics |
| DiBT-MS Technology [17] [20] | ~1000x traditional methods | High | Minimal solvent use, reusable slides | Medium, automated sample handling |
| AI-Powered Autonomous Platforms [21] | Hundreds to thousands per cycle | High | Optimized via ML-guided design | Full end-to-end automation |
The implementation of these advanced systems requires corresponding evolution in experimental design and data analysis approaches, as outlined in the following comparison.
Table 2: Experimental Design Requirements Across Screening Platforms
| Experimental Parameter | Traditional Methods | Integrated AI-Biofoundry Platforms |
|---|---|---|
| Variant Library Design | Random mutagenesis, limited diversity | Protein LLMs (e.g., ESM-2), epistasis models [21] |
| Fitness Evaluation | Single-parameter, endpoint measurements | Multi-parametric, real-time monitoring |
| Data Utilization | Linear analysis, limited learning | Iterative DBTL cycles with ML model refinement [21] [16] |
| Human Intervention | Extensive manual operation | Minimal intervention after initial setup |
Advanced Screening Technologies in Practice
High-Throughput Microfermentation Systems
Modern microfermentation platforms represent a significant advancement over traditional fermentation methods. Systems such as those developed by Beckman Coulter Life Sciences utilize miniaturized bioreactors (volume: few mL) operating in parallel, enabling simultaneous execution of hundreds to thousands of experiments [19]. Key technological features include:
- Integrated sensor arrays for real-time monitoring of critical parameters (temperature, pH, dissolved oxygen)
- Automated liquid handling and robotic sampling capabilities
- Data analytics platforms with visualization tools for rapid condition optimization
These systems dramatically reduce reagent consumption and labor requirements while providing rich datasets for evaluating enzyme expression and function under varied physiological conditions [19].
BioTransformation Direct Analysis Mass Spectrometry (DiBT-MS)
The recently developed DiBT-MS technology addresses fundamental limitations in traditional enzyme activity screening. By innovating upon existing Desorption Electrospray Ionization Mass Spectrometry (DESI-MS), this approach enables direct analysis of enzyme activity without sample pretreatment [17] [20]. Key advantages include:
- Radical time compression: Assays completed in ~2 hours versus several days with conventional methods
- Dramatically reduced consumable usage through optimized slide reuse technology
- Direct observation of enzyme reaction kinetics in real-time
This technology has demonstrated particular value in pharmaceutical development, where it accelerates screening of enzyme variants for drug synthesis pathways while aligning with green chemistry principles through reduced solvent waste and plastic consumption [17].
Integrated AI-Driven Enzyme Engineering Platforms
The Autonomous Engineering Workflow
Cutting-edge enzyme engineering now combines biofoundry automation with artificial intelligence in self-directed systems. The general workflow implemented on platforms like the Illinois Biological Foundry (iBioFAB) integrates several advanced technologies [21]:
- Protein Large Language Models (e.g., ESM-2): Predict variant fitness from sequence context
- Epistasis modeling: Identify residue-residue interactions affecting function
- High-fidelity DNA assembly: Enable construction of variant libraries without intermediate sequencing
- Machine learning-guided optimization: Bayesian optimization and other ML algorithms predict promising variants for subsequent cycles
This integrated approach was successfully demonstrated in engineering Arabidopsis thaliana halide methyltransferase (AtHMT), achieving a 16-fold improvement in ethyltransferase activity, and Yersinia mollaretii phytase (YmPhytase), yielding a 26-fold enhancement in neutral pH activity, both within four weeks [21].
Machine Learning for Functional Characterization
Beyond engineering, ML models are revolutionizing enzyme characterization. The AlphaCD platform exemplifies this approach, using sequence and structural features to predict multiple functional parameters for cytidine deaminases with high accuracy [22]:
- Catalytic efficiency (predictive accuracy: 0.92)
- Off-target activity (predictive accuracy: 0.84)
- Target site window (predictive accuracy: 0.73)
- Catalytic motif preferences (predictive accuracy: 0.78)
Such models enable researchers to virtually screen thousands of enzyme variants, prioritizing the most promising candidates for experimental validation [22].
Experimental Protocols
Protocol: DiBT-MS for Enzyme Activity Screening
Purpose: Direct measurement of enzyme activity for variant screening without sample pretreatment.
Materials:
- DiBT-MS instrument with DESI ionization source
- Glass slides with hydrophobic patterning
- Enzyme variants in expression lysate
- Substrate solutions dissolved in appropriate buffers
- Calibration standards for quantification
Procedure:
- Sample Spotting: Array 0.5-1 μL of each enzyme variant lysate onto predefined positions on the reusable glass slide.
- Substrate Application: Apply 0.2-0.5 μL substrate solution directly onto each enzyme spot, initiating reaction.
- Incubation: Allow reaction to proceed for 5-30 minutes under controlled humidity (room temperature).
- Direct Analysis: Perform DESI-MS analysis using optimized solvent flow rates (1-5 μL/min) and gas pressures.
- Data Acquisition: Monitor reaction products in real-time using selected ion monitoring (SIM) or full scan modes.
- Quantification: Compare peak areas of products to calibration curves for enzyme activity calculation.
Notes: Slide reuse is possible after cleaning with solvent wash and verification of no carryover. This protocol reduces traditional multi-day processes to approximately 2 hours [17] [20].
Protocol: Autonomous DBTL Cycle for Enzyme Engineering
Purpose: Iterative enzyme optimization through integrated design, construction, testing, and learning cycles.
Materials:
- Biofoundry platform with liquid handling, thermal cyclers, and microfermentation capabilities
- Protein LLM access (e.g., ESM-2) and ML model implementation
- High-fidelity DNA assembly reagents
- Robotic colony picking system
- Automated assay platforms (e.g., plate readers, MS systems)
Procedure:
- Design Phase:
- Input wild-type protein sequence into ESM-2 and epistasis models [21]
- Generate initial library of 150-200 variants focusing on diverse mutations
- Select top candidates based on predicted fitness scores
Build Phase:
- Execute automated PCR-based mutagenesis using high-fidelity assembly [21]
- Perform robotic transformation into expression host
- Pick multiple colonies per variant using automated colony picking
Test Phase:
- Inoculate deep-well plates for expression using liquid handling
- Induce protein expression under standardized conditions
- Perform automated functional assays (e.g., catalytic activity, stability)
- Collect high-quality dataset for ML training
Learn Phase:
- Train ML models (e.g., Bayesian optimization) on variant sequence-activity data
- Identify sequence-function relationships and mutation interactions
- Design next variant library based on model predictions
- Initiate subsequent DBTL cycle with refined library
Notes: Each complete cycle typically requires 1-2 weeks, with progressive improvement in enzyme properties over 3-5 cycles [21].
The Scientist's Toolkit: Essential Research Reagents and Platforms
Implementation of advanced enzyme screening requires specific reagents, instruments, and computational tools. The following table details key components of a modern enzyme engineering pipeline.
Table 3: Essential Research Reagents and Platforms for Modern Enzyme Variant Analysis
| Category | Specific Tool/Platform | Function/Application | Key Features |
|---|---|---|---|
| Biofoundry Automation | iBioFAB Platform [21] | End-to-end automation of enzyme engineering | Modular workflow execution, robotic integration |
| Screening Instruments | DiBT-MS System [17] | High-throughput enzyme activity screening | Direct analysis, minimal sample preparation |
| Microfermentation System [19] | Parallel cultivation and screening | Miniaturized bioreactors, real-time monitoring | |
| Computational Tools | ESM-2 (Protein LLM) [21] | Variant fitness prediction | Transformer architecture trained on global protein sequences |
| Epistasis Models [21] | Identification of residue interactions | EVmutation-based analysis of homologous sequences | |
| Molecular Biology | High-Fidelity DNA Assembly [21] | Error-reduced variant construction | ~95% accuracy without intermediate sequencing |
| Machine Learning | Bayesian Optimization Models [21] | Guided library design | Predicts promising variants from limited data |
Workflow Visualization
Diagram 1: Enzyme screening evolution from traditional to AI-powered methods
Diagram 2: Autonomous enzyme engineering workflow using AI and biofoundries
Key Challenges in Conventional Enzyme Engineering Approaches and HTS Solutions
Enzyme engineering is a cornerstone of modern biocatalysis, with applications spanning pharmaceutical synthesis, biofuel production, and green chemistry. However, conventional approaches to enzyme engineering face significant limitations that hinder the rapid development of optimized biocatalysts. These challenges primarily stem from methodological constraints in creating and analyzing enzyme variant libraries. Traditional methods often rely on small functional datasets and low-throughput screening strategies, leading to incomplete exploration of sequence-function relationships and potentially missing optimal enzyme variants [23]. Furthermore, selection methods frequently focus on evolving "winning" enzymes for a single specific transformation, which limits the collection of comprehensive sequence-function data that could inform future engineering efforts for similar reactions [23]. These constraints become particularly problematic when engineering enzymes for complex industrial applications where multiple properties such as activity, stability, and substrate specificity must be optimized simultaneously.
The emergence of high-throughput screening (HTS) technologies represents a paradigm shift in enzyme engineering, enabling researchers to overcome these traditional limitations. By allowing for the rapid assessment of thousands of enzyme variants under diverse conditions, HTS platforms provide the comprehensive datasets necessary for informed enzyme optimization [23] [15] [24]. This application note examines the key challenges in conventional enzyme engineering and details the HTS solutions that are transforming the field, with particular emphasis on practical protocols and implementation strategies for researchers and drug development professionals.
Key Challenges in Conventional Enzyme Engineering
Limited Exploration of Sequence-Function Relationships
Conventional enzyme engineering approaches typically generate limited functional datasets that fail to capture the complex interactions between different amino acid residues within a protein structure. This incomplete mapping of sequence-function relationships significantly reduces the probability of identifying optimal enzyme variants. The multidimensional nature of protein fitness landscapes means that beneficial mutations often interact in non-additive ways (epistasis), creating rugged landscapes where optimal combinations of mutations can be easily overlooked with sparse sampling [25]. This challenge is compounded when engineering enzymes for multiple substrates or reaction conditions simultaneously, as the sequence requirements for each function may differ substantially.
Machine learning (ML) approaches have demonstrated that the predictive power of models for enzyme engineering is directly correlated with the size and quality of the training data [23]. Conventional methods that produce small datasets therefore not only limit immediate discovery but also hamper the development of computational tools that could accelerate future engineering campaigns. The Northwestern Engineering team highlighted this fundamental limitation, noting that small datasets lead to "missed interactions among different amino acid residues within a protein" [23].
Throughput Limitations in Screening and Selection
The low-throughput nature of conventional screening methods creates a significant bottleneck in the enzyme engineering pipeline. Typical screening strategies can only assess a limited number of variants due to technical constraints, resource requirements, and time limitations [23]. This restricted throughput is particularly problematic when employing random mutagenesis approaches, where the probability of beneficial mutations is low and large libraries must be screened to identify improvements [26].
Traditional methods often focus on evolving enzymes for a single transformation, which further limits the utility of the collected data for broader engineering applications [23]. This single-function focus fails to capture the complex relationships between enzyme sequence and multiple functional parameters, including activity under different conditions, substrate specificity, and stability. The throughput challenge extends beyond initial screening to include the upstream processes of variant generation and the downstream processes of validation and characterization, creating a system-wide bottleneck in conventional enzyme engineering workflows.
Technical and Resource Constraints
Conventional enzyme engineering faces significant technical hurdles related to assay sensitivity, detection limitations, and resource intensiveness. These constraints are particularly pronounced when engineering enzymes that produce challenging molecules such as hydrocarbons, which can be "insoluble, gaseous, and chemically inert," making their detection and quantification difficult [26]. Similarly, engineering enzymes for reactions without direct spectroscopic handles requires complex assay development with multiple coupling steps, increasing the potential for interference and false results.
The resource requirements of conventional methods also limit their accessibility and scalability. Large-scale expression and purification of enzyme variants using traditional liter-scale approaches followed by chromatographic purification is time-consuming, expensive, and impractical for processing thousands of variants [10]. This creates a significant barrier for research groups and organizations without access to substantial funding or specialized equipment, slowing the overall pace of innovation in enzyme engineering.
Table 1: Key Challenges in Conventional Enzyme Engineering and Their Implications
| Challenge | Specific Limitations | Impact on Enzyme Engineering |
|---|---|---|
| Limited Sequence-Function Data | Small datasets, missed residue interactions, single transformation focus | Incomplete fitness landscape mapping, suboptimal variant selection |
| Throughput Restrictions | Low-throughput screening, limited variant assessment, resource-intensive validation | Reduced probability of identifying beneficial mutations, extended development timelines |
| Technical Constraints | Insensitive detection methods, challenging molecule detection, complex assay requirements | Difficulty engineering enzymes for specific reactions, increased false positive/negative rates |
| Resource Limitations | High costs, specialized equipment requirements, extensive personnel time | Reduced accessibility, limited scalability, slower innovation pace |
High-Throughput Screening Solutions
Advanced HTS Assay Development
The development of robust, sensitive, and reproducible HTS assays is fundamental to overcoming the limitations of conventional enzyme engineering. Modern HTS approaches employ diverse detection strategies tailored to specific reaction types and engineering goals. Two particularly innovative approaches recently documented include pH-based screening and colorimetric product detection assays.
For engineering transketolases toward non-natural substrate acceptance, researchers have developed a pH-sensitive screening method that monitors CO₂ release from keto acid donor substrates. This approach uses inexpensive pH indicators (phenol red for absorption measurements or HPTS for fluorescence) to detect changes in reaction media as an indirect readout of substrate consumption [15]. Although this method provides only an indirect signal of catalytic conversion and can be sensitive to experimental variability, its simplicity and broad applicability make it valuable for initial library screening. Complementing this approach, a hydroxamate assay enables direct colorimetric monitoring of product formation through iron(III) chelation. The resulting dark-red complex indicates successful synthesis of N-aryl hydroxamic acid products, offering improved specificity and reduced background interference compared to indirect methods [15].
For isomerase engineering, researchers have adapted classical chemical reactions into HTS formats. A recently established protocol for screening L-rhamnose isomerase variants employs Seliwanoff's reaction to detect ketoses through dehydration in hydrochloric acid followed by reaction with resorcinol to produce colored compounds [24]. This approach enables rapid, indirect measurement of isomerase activity by monitoring changes in ketose concentration during the reaction. The statistical metrics reported for this assay (Z'-factor of 0.449, signal window of 5.288, and assay variability ratio of 0.551) meet acceptance criteria for high-quality HTS assays, demonstrating the robustness achievable with properly optimized protocols [24].
Automated and Miniaturized Platforms
Automation and miniaturization represent critical advancements in HTS for enzyme engineering, dramatically increasing throughput while reducing costs and resource requirements. Recent developments have demonstrated the feasibility of establishing low-cost, robot-assisted pipelines for high-throughput enzyme discovery and engineering. These systems leverage liquid-handling robots to parallelize the most labor-intensive steps of enzyme production and characterization, enabling a single researcher to process hundreds of enzymes weekly [10].
A key innovation in this space is the development of miniaturized protein expression and purification protocols adapted to well-plate formats. Researchers have successfully translated conventional liter-scale expression and chromatography to 24-deep-well plates with 2 mL cultures, achieving protein yields up to 400 µg with sufficient purity for comprehensive functional and stability analyses [10]. This miniaturization reduces material costs and experimental waste while maintaining the quality required for meaningful biochemical characterization. The integration of automated transformation, inoculation, and purification steps creates a seamless pipeline that minimizes human error and variability while maximizing throughput.
For in vivo enzyme engineering, automated continuous evolution platforms represent another transformative approach. These systems integrate in vivo hypermutators with growth-coupled selection to enable continuous enzyme optimization without manual intervention [25]. By coupling desired enzymatic activities to microbial fitness, these platforms allow beneficial variants to automatically enrich in the population, creating a powerful Darwinian selection system for enzyme improvement.
Table 2: Comparison of HTS Platforms for Enzyme Engineering
| Platform Type | Throughput | Key Features | Applications | Implementation Considerations |
|---|---|---|---|---|
| Robot-assisted purification | 96+ proteins in parallel | Low-cost liquid handling, miniaturized expression, automated purification | Recombinant enzyme production, variant characterization | Requires initial equipment investment, adaptable protocols |
| Cell-free screening | 10,000+ reactions | Customizable reaction environment, direct assay compatibility, no cell barriers | Rapid mapping of sequence-function relationships, condition screening | Limited protein yields, may not reflect cellular environment |
| In vivo continuous evolution | Continuous | Growth-coupled selection, automated hypermutation, minimal intervention | Enzyme optimization when activity can be linked to fitness | Requires careful selection strain design, may exhibit background growth |
| Microfluidic droplet systems | >10^6 variants/day | Ultra-high throughput, compartmentalization, single-cell analysis | Massive library screening, directed evolution campaigns | Specialized equipment, complex setup, assay compatibility challenges |
Machine Learning-Guided HTS
The integration of machine learning with HTS represents a paradigm shift in enzyme engineering, creating powerful closed-loop systems that accelerate the design-build-test-learn cycle. ML-guided approaches use experimental data to predict beneficial mutations and optimize library design, reducing the experimental burden required to identify improved enzyme variants [23] [25]. This synergistic combination allows researchers to navigate complex fitness landscapes more efficiently by focusing screening efforts on regions with higher probabilities of success.
A notable implementation of this approach demonstrated the engineering of amide synthetase enzymes using ML-guided cell-free expression. This platform enabled the assessment of 1,217 enzyme mutants in 10,953 unique reactions, generating comprehensive data to train ML models that successfully predicted synthetase variants capable of producing nine small molecule pharmaceuticals [23]. The resulting models could explore sequence-fitness landscapes across multiple regions of chemical space simultaneously, enabling parallel engineering of specialized biocatalysts [23].
ML approaches also support HTS by enabling the design of auxotroph selection strains and predicting which gene deletions will create effective growth-coupled selection systems [25]. This application is particularly valuable for in vivo directed evolution, where coupling enzyme activity to cellular fitness provides a powerful selection mechanism that can replace or complement traditional screening approaches.
Detailed HTS Protocols
Protocol: High-Throughput Screening of Isomerase Variants Using Seliwanoff's Reaction
This protocol provides a detailed methodology for establishing a robust HTS system for isomerase engineering, specifically applied to L-rhamnose isomerase variants but adaptable to other isomerases with appropriate modifications [24].
Materials and Reagents
- Plasmid DNA encoding isomerase variants in appropriate expression vector
- Competent E. coli cells (BL21(DE3) or similar expression strains)
- LB medium with appropriate antibiotics
- Bugbuster Master Mix or similar lysis reagent
- Substrate master mix: 100 mM D-allulose, 50 mM Tris-HCl (pH 7.0), 10 mM MnCl₂
- Seliwanoff's reagent: 0.1% resorcinol in 6N hydrochloric acid
- 96-well PCR plates and deep-well plates
- Plate reader capable of absorbance measurements (520-550 nm)
- Liquid handling robot (optional but recommended)
Procedure
Library Transformation and Expression
- Transform plasmid library into competent E. coli cells using high-efficiency transformation protocol
- Plate transformed cells on selective LB agar and incubate overnight at 37°C
- For high-throughput expression, inoculate single colonies into 1 mL LB medium with antibiotic in 96-deep-well plates
- Induce protein expression with 5 mM lactose and incubate at 30°C with shaking (200 rpm) for 18 hours
Cell Lysis and Enzyme Preparation
- Harvest cells by centrifugation at 2,000 × g for 10 minutes
- Discard supernatant and resuspend cell pellets in 200 μL Bugbuster Master Mix
- Incubate at 25°C with shaking (300 rpm) for 20 minutes for complete lysis
- Centrifuge at 4,000 × g for 20 minutes to collect supernatant containing soluble enzyme
Enzyme Reaction
- Transfer 40 μL of lysate supernatant to 96-well PCR plate
- Add 160 μL of substrate master mix to initiate reactions
- Incubate in thermal cycler at 75°C for 4 hours
- Terminate reactions by heating to 95°C for 5 minutes followed by cooling to 4°C
Seliwanoff's Detection
- Centrifuge terminated reactions at 13,000 × g for 3 minutes to pellet denatured protein
- Transfer 240 μL of supernatant to new plate containing 480 μL Seliwanoff's reagent
- Incubate at 60°C for 30 minutes in water bath
- Cool at room temperature for 1 hour to stabilize color development
- Measure absorbance at 540 nm in plate reader
Data Analysis
- Calculate residual ketose concentration from standard curve
- Determine enzyme activity based on substrate depletion
- Normalize activities to positive and negative controls
- Select top-performing variants for validation and sequencing
Quality Control and Validation
- Include positive control (wild-type enzyme) and negative control (empty vector) in each plate
- Validate assay performance using statistical metrics (Z'-factor > 0.4, signal window > 2)
- Confirm hits using alternative analytical methods (e.g., HPLC) when possible
- Perform sequence analysis to identify beneficial mutations
Protocol: Robot-Assisted Protein Purification for Enzyme Characterization
This protocol describes a automated, miniaturized protein purification workflow for high-throughput enzyme production, enabling functional characterization of hundreds of variants [10].
Materials and Reagents
- Plasmid constructs with affinity tags (e.g., His-tag, SUMO tag)
- Competent E. coli cells with appropriate genetic background
- Zymo Mix & Go! E. coli Transformation Kit or similar
- Autoinduction media with antibiotics
- Lysis buffer: 50 mM Tris-HCl, pH 7.5, 300 mM NaCl, 10 mM imidazole
- Ni-charged magnetic beads for affinity purification
- Wash buffer: 50 mM Tris-HCl, pH 7.5, 300 mM NaCl, 25 mM imidazole
- Elution buffer: 50 mM Tris-HCl, pH 7.5, 300 mM NaCl, 250 mM imidazole OR protease for tag cleavage
- 24-deep-well plates with gas-permeable seals
- Liquid handling robot (Opentrons OT-2 or similar)
- Magnetic bead separation module
Procedure
High-Throughput Transformation
- Aliquot 50 μL competent cells per well in 96-well PCR plate kept on cooling block
- Add 1 μL plasmid DNA (50-100 ng) to each well using liquid handler
- Incubate on ice for 30 minutes
- Add 150 μL SOC media and incubate at 37°C for 1 hour
- Transfer transformation mix to 24-deep-well plates containing 2 mL autoinduction media with antibiotic
- Incubate at 30°C with shaking (200 rpm) for 40 hours
Cell Harvest and Lysis
- Harvest cells by centrifugation at 4,000 × g for 20 minutes
- Discard supernatant and resuspend pellets in 400 μL lysis buffer
- Lyse cells by repeated pipetting or enzymatic lysis
- Centrifuge at 4,000 × g for 30 minutes to remove cell debris
- Transfer supernatant to new plate for purification
Automated Affinity Purification
- Aliquot 50 μL Ni-charged magnetic beads to each well
- Add clarified lysate and incubate with mixing for 45 minutes
- Capture beads using magnetic separation and discard supernatant
- Wash beads twice with 500 μL wash buffer
- For elution, either:
- Add 100 μL elution buffer and incubate 15 minutes, OR
- Add protease for tag cleavage and incubate according to enzyme specifications
- Collect eluate containing purified protein
Quality Assessment and Normalization
- Determine protein concentration using Bradford or similar assay
- Analyze purity by SDS-PAGE with representative samples
- Normalize protein concentrations for downstream assays
- Aliquot and store at -80°C if not used immediately
Implementation Notes
- This protocol enables processing of 96 enzymes in parallel with minimal manual intervention
- Typical yields range from 50-400 μg purified protein per sample
- Purity is sufficient for most enzymatic and biophysical assays
- The platform is highly scalable and can process hundreds of variants weekly
The Scientist's Toolkit: Essential Research Reagents and Materials
Table 3: Essential Research Reagents for HTS in Enzyme Engineering
| Category | Specific Reagents/Materials | Function and Application | Key Considerations |
|---|---|---|---|
| Library Construction | Error-prone PCR kits, DNA shuffling reagents, Restriction enzymes (EcoRI, DpnI), Taq DNA polymerase | Generation of diverse mutant libraries for directed evolution | Mutation rate control, library diversity, representation bias |
| Expression Systems | Competent E. coli cells (BL21(DE3), DH5α), Expression vectors with affinity tags, Autoinduction media, Antibiotics | Recombinant production of enzyme variants | Expression level, solubility, folding efficiency |
| Cell Lysis & Purification | Bugbuster Master Mix, Ni-charged magnetic beads, Lysis buffers, Imidazole solutions, Proteases for tag cleavage | Extraction and purification of enzyme variants from expression hosts | Yield, purity, activity retention, compatibility with downstream assays |
| HTS Assay Reagents | pH indicators (phenol red, HPTS), Chromogenic substrates, Seliwanoff's reagent (resorcinol + HCl), Iron(III) chloride | Detection of enzymatic activity in high-throughput format | Sensitivity, dynamic range, interference, stability |
| Automation & Detection | 96-well plates (PCR, deep-well), Liquid handling robots, Plate readers, Microfluidic droplet generators | Automation of workflows and signal detection | Throughput, cost, reproducibility, data quality |
| Analytical Standards | Substrate and product standards, Reference enzymes, Calibration standards for instrumentation | Quality control and quantification | Purity, stability, appropriate concentration ranges |
Integrated Workflow for HTS in Enzyme Engineering
The most effective implementation of HTS in enzyme engineering involves the integration of multiple advanced approaches into a cohesive workflow. This integration maximizes the strengths of individual methods while mitigating their limitations. A proposed integrated workflow combines computational design, automated experimentation, and machine learning to create a powerful engine for enzyme optimization [25].
This integrated workflow begins with clearly defined engineering goals, which guide the computational design of mutant libraries. These libraries are then experimentally constructed and characterized using automated platforms, generating high-quality data that refines the computational models for subsequent design cycles. The continuous feedback between computation and experimentation creates a virtuous cycle of improvement that dramatically accelerates the enzyme engineering process compared to conventional approaches [23] [25].
The limitations of conventional enzyme engineering approaches—including restricted exploration of sequence space, low-throughput screening, and resource constraints—are being systematically addressed through advanced HTS solutions. The integration of sophisticated assay designs, automated platforms, and machine learning guidance has created a new paradigm in enzyme engineering that enables comprehensive exploration of fitness landscapes and rapid identification of optimized biocatalysts. The protocols and methodologies detailed in this application note provide researchers with practical frameworks for implementing these advanced HTS approaches in their own enzyme engineering campaigns, potentially accelerating the development of novel biocatalysts for pharmaceutical, industrial, and sustainable chemistry applications. As these technologies continue to evolve and become more accessible, they promise to further democratize high-throughput enzyme engineering, enabling more researchers to contribute to the advancement of biocatalysis and the development of innovative bio-based solutions to complex challenges.
Advanced Methodologies: ML-Guided Platforms and Screening Applications
Machine-Learning Guided Cell-Free Expression Systems for Parallel Biocatalyst Development
The engineering of specialized biocatalysts is a cornerstone of sustainable biomanufacturing, with applications spanning pharmaceutical synthesis, bioenergy, and materials science. Traditional enzyme engineering methods, particularly directed evolution, are often constrained by low-throughput screening, an inability to map epistatic interactions, and a focus on optimizing for single transformations, thereby missing valuable sequence-function relationships for related reactions [9] [23]. To address these limitations, a novel framework integrating machine learning (ML) with cell-free expression (CFE) systems has been developed. This approach enables the rapid generation of large fitness landscape datasets and the parallel optimization of enzymes for multiple distinct chemical reactions [9]. This Application Note details the implementation, quantitative outcomes, and specific protocols for this high-throughput platform, providing researchers with a blueprint for accelerating biocatalyst development.
The ML-guided CFE platform establishes a streamlined Design-Build-Test-Learn (DBTL) cycle. Its core innovation lies in using cell-free systems to bypass the bottlenecks of cellular transformation and culture, allowing for the rapid synthesis and testing of thousands of protein variants in a single day [9]. The workflow is designed for parallel processing, enabling simultaneous engineering campaigns for multiple target reactions.
The following diagram illustrates the integrated, cyclical workflow of the platform, from initial design to final model learning.
Quantitative Performance Data
The platform's efficacy was demonstrated by engineering the amide synthetase McbA to synthesize nine small-molecule pharmaceuticals. The table below summarizes the performance improvements achieved for a select subset of these target compounds.
Table 1: Performance of ML-Engineered McbA Variants for Pharmaceutical Synthesis
| Target Pharmaceutical | Wild-Type Conversion (%) | Engineered Variant Improvement (Fold) | Key Challenge Addressed |
|---|---|---|---|
| Moclobemide | 12 | 1.6 - 42 | High promiscuity, optimizing already decent activity [9] |
| Metoclopramide | 3 | 1.6 - 42 | Acid component with a free amine competitor [9] |
| Cinchocaine | 2 | 1.6 - 42 | Unique acid component, shared amine fragment [9] |
| S-Sulpiride | Trace (MS detection) | 1.6 - 42 | Stereoselectivity (S-enantiomer favored) [9] |
The engineering process involved the functional evaluation of 1,217 enzyme variants across 10,953 unique reactions to build a robust dataset for machine learning [23]. This large-scale mapping of the fitness landscape enabled the identification of variants with significantly enhanced activity, even for substrates that the wild-type enzyme could only utilize minimally or not at all.
Detailed Experimental Protocols
Protocol 1: Cell-Free Site-Saturation Mutagenesis and Protein Expression
This protocol enables the rapid construction and expression of sequence-defined protein variant libraries without the need for cellular transformation [9].
Materials:
- Template Plasmid: Contains the parent gene (e.g., McbA).
- Mutagenic Primers: Designed with nucleotide mismatches to introduce desired mutations and homologous overlaps for Gibson assembly.
- DpnI Restriction Enzyme: Digests methylated parent plasmid.
- Gibson Assembly Master Mix: For seamless intramolecular assembly of the mutated plasmid.
- PCR Reagents: For amplification of linear DNA expression templates (LETs).
- Cell-Free Gene Expression System: Commercially available or prepared E. coli extract-based system [9].
Procedure:
- Mutagenic PCR: Set up a PCR reaction using the template plasmid and mutagenic primers to amplify the entire plasmid while incorporating the desired mutation.
- DpnI Digestion: Add DpnI directly to the PCR product to digest the methylated template DNA. Incubate at 37°C for 1-2 hours.
- Gibson Assembly: Perform an intramolecular Gibson assembly to circularize the mutated PCR product. Use a cycling protocol of 50°C for 15-60 minutes.
- LET Amplification: Use a second PCR with outward-facing primers to amplify the assembled product as a linear DNA expression template (LET). Purify the LETs.
- Cell-Free Expression: Combine LETs with the CFE system according to the manufacturer's instructions. Incubate at 30°C for 4-6 hours to synthesize mutant proteins.
- Quality Control: Verify mutation incorporation and protein expression via sequencing and SDS-PAGE/Western blot, respectively.
Protocol 2: High-Throughput Functional Screening of Amide Synthetase Activity
This protocol details a colorimetric or MS-based assay to measure the activity of thousands of McbA variants in a 96-well plate format [9].
Materials:
- Assay Buffer: Typically HEPES or Tris buffer, pH 7.0-8.0, with Mg²⁺ or Mn²⁺ as cofactors.
- Substrates: Carboxylic acid (25 mM) and amine (25 mM) stocks dissolved in DMSO or buffer.
- Adenosine Triphosphate (ATP): Energy source for the enzymatic reaction.
- Detection Reagent: pH indicators, coupled enzyme systems, or direct analysis by Mass Spectrometry (MS).
Procedure:
- Reaction Setup: In a 96-well plate, combine:
- 2 µL of cell-free expressed protein variant.
- 50 µL of Assay Buffer.
- 1 µL of Acid substrate (25 mM stock).
- 1 µL of Amine substrate (25 mM stock).
- 1 µL of ATP (10-100 mM stock).
- Incubation: Incubate the plate at 30°C with shaking for 2-16 hours.
- Reaction Quenching: Add 10 µL of 1 M HCl or other suitable quenching agent to stop the reaction.
- Product Quantification:
- Option A (MS): Transfer an aliquot to a MS-compatible plate and analyze via LC-MS/MS. Quantify product formation based on standard curves.
- Option B (Colorimetric): Use a coupled enzyme system to detect AMP/ADP release or a pH shift. Measure absorbance/fluorescence in a plate reader.
- Data Processing: Normalize conversion rates to the wild-type enzyme control. The resulting dataset of sequence-function relationships is used for ML model training.
Protocol 3: Machine Learning Model Training for Variant Prediction
This protocol describes the construction of a ridge regression model to predict the fitness of unsampled enzyme variants [9].
Materials:
- Dataset: A matrix of variant sequences (one-hot encoded or feature-based) and their corresponding functional activity measurements from Protocol 2.
- Computing Environment: Python with scikit-learn, pandas, and numpy libraries.
Procedure:
- Feature Engineering: Encode each protein variant using one-hot encoding for each mutated residue position.
- Data Splitting: Randomly split the dataset into a training set (e.g., 80%) and a hold-out test set (e.g., 20%).
- Model Training: Train an augmented ridge regression model on the training set. The model can be augmented with a zero-shot fitness predictor based on evolutionary data to improve generalization.
- Hyperparameter Tuning: Use cross-validation on the training set to optimize the regularization strength (alpha parameter) of the ridge regression to prevent overfitting.
- Model Evaluation: Predict the activity of variants in the test set and calculate performance metrics (e.g., R² score, mean squared error).
- Variant Prediction: Use the trained model to predict the fitness of all possible higher-order mutants within the defined sequence space. Select the top predicted variants for the next DBTL cycle.
The Scientist's Toolkit: Research Reagent Solutions
Table 2: Essential Reagents for ML-Guided Cell-Free Enzyme Engineering
| Reagent / Solution | Function in the Workflow | Key Considerations |
|---|---|---|
| Cell-Free Gene Expression (CFE) System | Provides the transcriptional and translational machinery for cell-free protein synthesis, enabling high-throughput variant expression [9]. | Optimize for yield and solubility of the target enzyme class. Commercial systems offer reliability. |
| Linear DNA Expression Templates (LETs) | PCR-amplified DNA templates directly used in CFE; bypasses cloning and plasmid purification [9]. | Ensure high-fidelity amplification and purification for robust expression. |
| Mutagenic Primers | Designed to introduce specific mutations via PCR and contain homologous overhangs for Gibson assembly [9]. | Design with appropriate melting temperature and homology arms; high purity (HPLC-grade) is recommended. |
| Gibson Assembly Master Mix | Enzyme mix that seamlessly assembles multiple DNA fragments with homologous ends; used for plasmid circularization post-mutagenesis [9]. | Preferred for its efficiency and ability to handle complex assemblies in a single step. |
| Augmented Ridge Regression Model | A supervised ML algorithm that predicts variant fitness from sequence data, regularized to avoid overfitting and augmented with evolutionary knowledge [9]. | Effective with limited data and helps navigate epistatic interactions for more accurate predictions. |
Comparative Analysis with Alternative Platforms
While the described CFE-ML platform is highly effective, other advanced enzyme engineering platforms exist.
Table 3: Comparison of Advanced Enzyme Engineering Platforms
| Platform Feature | ML-Guided CFE System [9] | Automated In Vivo Engineering [25] | Droplet-Based HTS [6] |
|---|---|---|---|
| Throughput | High (1,000s of variants) | High to Very High | Very High (10⁶-10⁹ variants) |
| Key Advantage | Customizable reaction conditions, rapid DBTL cycles | Growth-coupled selection for automated evolution | Massive library screening capacity |
| Primary Limitation | May not reflect in vivo folding/activity | Limited to reactions that can be coupled to fitness | Requires specialized microfluidics equipment |
| Automation Integration | High (amenable to liquid handlers) | High (full biofoundry integration) | Medium (specialized setup required) |
The integration of machine learning with cell-free expression systems represents a transformative advancement for high-throughput biocatalyst development. The detailed protocols and data presented herein provide a validated roadmap for researchers to implement this platform. By enabling the parallel exploration of vast sequence-function landscapes, this approach significantly accelerates the creation of specialized enzymes for applications in green chemistry, pharmaceutical synthesis, and beyond, pushing the frontiers of synthetic biology and sustainable biomanufacturing.
Computational Pre-screening with Variant Effect Prediction (VEP) Models
In the field of enzyme engineering, the pursuit of novel biocatalysts with enhanced properties—such as improved catalytic activity, substrate specificity, or thermostability—increasingly relies on machine learning models for computational pre-screening. Variant Effect Prediction (VEP) models computationally assess the functional impact of amino acid substitutions, enabling researchers to prioritize the most promising enzyme variants for experimental characterization. This approach is crucial for navigating the vast combinatorial space of possible mutations efficiently. Although these machine learning approaches have proven effective, their performance on prospective screening data is not uniform; prediction accuracy can vary significantly from one protein variant to the next [11]. The integration of VEP models into high-throughput screening workflows represents a paradigm shift, allowing for the evaluation of billions of enzyme variants in silico before committing costly laboratory resources [27].
Key Structural Determinants Influencing VEP Predictability
Understanding the factors that influence the accuracy of VEP models is fundamental to their effective application. Research indicates that predictability is not uniform and is strongly influenced by the structural context of the mutated residues.
A systematic investigation, which trained four different supervised VEP models on structurally partitioned data, found that predictability strongly depended on all four structural characteristics tested [11]:
- Buriedness: Residues located in the protein's interior.
- Number of contact residues: The local interaction network of a position.
- Proximity to the active site: Residues near the enzyme's catalytic center.
- Presence of secondary structure elements: Residues in alpha-helices or beta-sheets.
These dependencies were consistently observed across several single mutation enzyme variant datasets, though the specific direction of the effect could vary. Crucially, these performance patterns were similar across all four tested models, indicating that these specific structure and function determinants are insufficiently accounted for by current machine learning algorithms [11]. This suggests a common blind spot and highlights an area for future model improvement through new inductive biases and the integration of multiple data modalities.
Table: Structural Characteristics and Their Impact on VEP Model Performance
| Structural Characteristic | Impact on Predictability | Implication for Enzyme Engineering |
|---|---|---|
| Buriedness | Significant impact on model error [11] | Mutations in buried residues may be less accurately predicted, requiring caution. |
| Number of Contact Residues | Strong influence on prediction accuracy [11] | Positions with extensive residue interaction networks present a greater modeling challenge. |
| Proximity to Active Site | Predictability varies with distance to active site [11] | Critical for designing mutations aimed at modulating enzyme activity or substrate scope. |
| Secondary Structure Elements | Presence influences model error [11] | The local structural environment must be considered when interpreting VEP model outputs. |
Application Notes and Protocols
This section provides detailed methodologies for implementing computational pre-screening in enzyme engineering projects, from data preparation to model-assisted variant evaluation.
Protocol 1: General VEP Annotation for Variant Sets
This protocol describes the use of the Ensembl Variant Effect Predictor (VEP), a comprehensive tool for annotating variants with their consequences on genes and transcripts [28]. While often used for genomic variants, the principles of functional annotation are analogous for enzyme variant analysis.
1. Input File Preparation:
- Create a comma-separated value (CSV) input file containing at least two columns:
IDandVCF. - The
IDcolumn should contain a unique identifier for each sample or variant set. - The
VCFcolumn must specify the full file path to the corresponding Variant Call Format (VCF) file. - Ensure all VCFs are mapped to the same reference genome assembly (e.g., GRCh37 or GRCh38) [28].
2. Script Execution and Parameters:
- Execute the VEP script, specifying required and optional parameters [28].
3. Required Parameters:
-i </path/to/input/file>-c <project_code>-g <GRCh37 or GRCh38>-v <VEP version>[28]
4. Output Interpretation:
- VEP generates an output file containing comprehensive annotations for each input variant, including predicted consequences, amino acid changes, and scores from integrated algorithms like SIFT [28].
Protocol 2: Super High-Throughput Screening with a Graph Convolutional Network
This protocol details a specific approach for super high-throughput screening of enzyme variant libraries using a Graph Convolutional Neural Network (GCN), as demonstrated for an ω-transaminase from Vibrio fluvialis (Vf-TA) [27].
1. Training Data Set Generation:
- Create Variant Library: Generate a library of enzyme variants by randomly mutating a predetermined set of
Nhothotspot residues. For initial training, a library of 10,000 variants is often sufficient [27]. - Data Labeling: Calculate the binding energy (e.g., Rosetta Interface Energy) for each variant in complex with the ligand of interest. This value serves as the label (
y_i) for training. The binding energy should be averaged over multiple replicas (e.g., 10) to ensure reliability [27]. - Data Whitening: Normalize the binding energy labels to have a zero mean and a standard deviation of one using the formula:
y = (x - mean) / stdev[27].
2. Graph Representation of Protein Variants:
- Node Definition: Represent the enzyme as a graph where nodes correspond to amino acid residues near the binding site (e.g., 23 residues for Vf-TA). Each node is assigned features (
X) derived from biophysical and biochemical properties of amino acids, such as those found in the AAindex database [27]. - Edge Definition: Connect all nodes to each other. The edge attributes (
E) can be defined as the inverse of the pairwise distance between the protein residues' Cα atoms (e_ij = 1 / ||e_i - e_j||_2). For a fixed protein backbone, the edge tensor remains constant across mutants, drastically reducing computational cost [27].
3. Model Training and Evaluation:
- Architecture: Employ a spectral GCN architecture consisting of a stack of message-passing and graph pooling layers to learn abstract representations of the input protein graph [27].
- Training: Split the data set into training (80%), validation (10%), and test (10%) subsets. Train the model to predict the labeled binding energy from the graph representation of the variant.
- Super High-Throughput Screening: Once trained, the GCN can predict the binding energy of new enzyme variants from their sequence information alone in under 1 ms, enabling the screening of billions of candidates on a single GPU [27].
Workflow Diagram: Super High-Throughput Screening of Enzyme Variants
Table: Research Reagent Solutions for Computational Pre-screening
| Research Reagent / Tool | Function in Workflow | Application Context |
|---|---|---|
| Ensembl Variant Effect Predictor (VEP) | Functional annotation of variants, predicting consequences on gene products [28]. | General variant effect analysis, integrating scores like SIFT for impact prediction. |
| Graph Convolutional Network (GCN) | Predicts binding energy of enzyme variants from sequence-derived graph representations [27]. | Super high-throughput screening of combinatorial enzyme variant libraries. |
| AAindex Database | Provides a collection of biophysical and biochemical amino acid properties for node featurization in protein graphs [27]. | Creating meaningful feature vectors for residue nodes in GCN-based models. |
| Rosetta Software Suite | Calculates binding energy (Interface Energy) for protein-ligand complexes used as training labels [27]. | Generating quantitative fitness labels (e.g., binding energy) for enzyme variants. |
Performance and Validation
The performance of VEP models is critical for their reliable application in enzyme engineering pipelines. The accuracy of these models is not static but is influenced by the structural context of mutations, as detailed in Section 2. Furthermore, the throughput of different computational approaches varies significantly.
Table: Comparative Performance of Computational Screening Methods
| Screening Method | Reported Throughput | Key Metric | Typical Use Case |
|---|---|---|---|
| Wet-lab Experimental Screening | >10^6 variants per hour [27] | Direct measurement of activity | Validation of top candidates from in silico screens. |
| Traditional Molecular Modeling (Rosetta) | ~10^4 variants (for training) [27] | Binding Energy (Rosetta Interface Energy) | Generating accurate labeled data for model training. |
| Graph Convolutional Network (GCN) | ~10^8 variants in <24 hours (1 ms/variant) [27] | Predicted Binding Energy | Ultra-large-scale exploration of combinatorial variant libraries. |
The GCN model demonstrated high accuracy in predicting the binding energy of unseen variants, a performance that was further enhanced by injecting feature embeddings from a language model pre-trained on millions of protein sequences [27]. This underscores the value of leveraging large, external data sources to boost model predictive power. Finally, the design of stratified data sets that partition variants by structural class (e.g., buried, active site) can systematically highlight areas for improvement in machine learning-guided protein engineering [11].
Designing Combinatorial Variant Libraries Based on Structural Characteristics
The engineering of enzymes for enhanced or novel catalytic functions is a cornerstone of modern biocatalysis and therapeutic development. A significant challenge in this field is that profound changes in protein activity often require multiple, simultaneous mutations within the densely packed and functionally critical active site [29]. However, the effects of these mutations are not always additive; epistasis can cause the impact of combined mutations to differ significantly from the individual mutations, limiting predictability [29]. To address this, the design of combinatorial variant libraries based on structural characteristics has emerged as a powerful strategy. This approach uses computational and structural insights to create smart libraries rich in functional, multipoint mutants, thereby increasing the probability of identifying beneficial variants through high-throughput screening. This application note details the practical application of these methods, specifically the htFuncLib approach, within the broader context of high-throughput screening for enzyme engineering and drug development research [29].
Key Principles and Data-Driven Library Design
The foundational principle of structure-based combinatorial library design is the focused mutagenesis of residues within the enzyme's active site. Unlike methods that rely on extensive experimental data, these approaches can be applied using primarily sequence and structural information.
The htFuncLib Methodology
The htFuncLib (high-throughput FuncLib) method is a computational approach for designing libraries of active-site multipoint mutants [29]. It generates compatible sets of mutations that are predicted to work well together, dramatically increasing the fraction of active variants in the designed library compared to traditional, random mutagenesis methods. This method has been successfully applied to generate thousands of active enzymes and fluorescent proteins with diverse properties [29].
The process involves:
- Identifying Key Residues: Selecting amino acid residues within the active site that are crucial for substrate binding, transition-state stabilization, or catalysis.
- Predicting Compatible Mutations: Using evolutionary information and Rosetta calculations to identify amino acid substitutions at these positions that are predicted to be structurally and functionally compatible with one another [29].
- Generating a Ranked List of Variants: Outputting a list of multipoint mutant sequences, ranked by their predicted stability and function, which serves as the blueprint for library synthesis.
Data-Driven Modeling for Enzyme Engineering
Data-driven strategies, including machine learning (ML) and deep learning (DL), are increasingly used to understand sequence-structure-function relationships and predict function-enhancing mutants [30]. These models use numerical features derived from enzyme sequences or structures, such as:
- Sequence-based features: One-hot encoding, physicochemical property indices (e.g., hydrophobicity, steric parameters), or language model embeddings [30].
- Structure-based features: Geometric descriptors like distances and angles between functional residues, which can incorporate protein dynamics and substrate interactions [30].
Supervised learning models (e.g., Random Forests, XGBoost) can then be trained on experimental data to screen in silico for variants with desired properties, guiding a more focused and effective experimental library design [30].
Experimental Protocol: A Practical Workflow
The following protocol describes the end-to-end process for designing, constructing, and screening a combinatorial variant library.
The diagram below illustrates the key stages of the combinatorial library design and screening pipeline.
Step-by-Step Protocol
Stage 1: Computational Library Design
Step 1.1: Input Structure Preparation
- Obtain a high-resolution three-dimensional structure of the wild-type enzyme (e.g., from the Protein Data Bank, PDB). If an experimental structure is unavailable, a high-quality homology model can be used.
Step 1.2: Active Site Residue Selection
- Using molecular visualization software (e.g., PyMOL, UCSF Chimera), identify residues within a 5-10 Å radius of the bound substrate or cofactor.
- Consult literature and catalytic site databases (e.g., Catalytic Site Atlas) to confirm the roles of selected residues.
Step 1.3: Run htFuncLib Analysis
- Access the FuncLib web server (https://FuncLib.weizmann.ac.il/) [29].
- Input your enzyme structure and specify the active site residues for diversification.
- The server will output a ranked list of multipoint mutant sequences. The top 100-1000 ranked variants are typically selected for experimental testing.
Stage 2: Library Construction
Step 2.1: Gene Library Synthesis
- The selected variant sequences are converted into a pool of synthetic DNA fragments. This is typically outsourced to commercial providers specializing in complex oligo pool synthesis.
- Recommended Provider: Companies like Twist Bioscience are experienced in generating saturating mutagenesis libraries [31].
Step 2.2: Cloning and Expression
- Clone the synthesized DNA fragment pool into an appropriate expression vector using high-efficiency cloning methods, such as Golden Gate Assembly or NEBuilder HiFi DNA Assembly [32].
- Transform the library into a suitable expression host (e.g., E. coli). Ensure a high transformation efficiency to maintain library diversity, with a coverage of >1000x per variant [31].
- Plate transformed cells and harvest the resulting colonies for plasmid extraction to create the library stock.
Stage 3: High-Throughput Screening
Step 3.1: Expression and Cell Lysis
- Express the variant library in a 96-well or 384-well deep-well plate format.
- Lyse cells using chemical lysis (e.g., lysozyme, detergents) or physical methods (e.g., sonication, bead beating). For automated workflows, streptavidin magnetic beads can be used for efficient sample preparation [32].
Step 3.2: Activity Screening via LC/MS
- This protocol is adapted from high-throughput screening for SAM analog synthesis [33].
- Reaction Setup: In a microtiter plate, combine:
- Cell lysate containing the enzyme variant (e.g., methyltransferase)
- Substrate (e.g., S-adenosyl-L-homocysteine, SAH)
- Alkyl donor (e.g., iodomethane, iodoethane)
- Incubation: Allow reactions to proceed at the optimal temperature for the enzyme (e.g., 30-37°C) for a defined period (e.g., 1-2 hours).
- Quenching and Analysis: Quench reactions with a solvent like acetonitrile. Use an automated liquid handler to transfer samples to a 96-well plate for analysis.
- LC/MS Analysis: Analyze samples using a high-throughput LC/MS system. Monitor for the consumption of SAH and the formation of the desired S-adenosyl-L-methionine (SAM) or SAM analog product. The mass spectrometer should be configured for rapid scanning to accommodate the high sample throughput [33].
Step 3.3: Data Analysis and Hit Selection
- Process raw LC/MS data using automated software to quantify substrate conversion and product formation for each variant.
- Normalize activity data to a positive control (wild-type enzyme) and negative control (empty vector/no enzyme).
- Select "hit" variants that exhibit significantly higher activity (e.g., orders-of-magnitude improvement) compared to the wild-type enzyme for further validation [33].
The Scientist's Toolkit: Essential Research Reagents
The table below lists key reagents and materials required for the successful execution of the described protocols.
Table 1: Essential Research Reagents and Materials for Combinatorial Library Screening
| Item | Function/Application | Example/Supplier |
|---|---|---|
| htFuncLib Web Server | Computational design of multipoint mutant libraries. | Fleishman-Lab, Weizmann Institute [29] |
| Synthetic DNA Fragments | Physical generation of the designed variant library. | Twist Bioscience [31] |
| NEBuilder HiFi DNA Assembly | High-efficiency cloning of complex DNA fragment pools. | New England Biolabs (NEB) [32] |
| Streptavidin Magnetic Beads | Automated purification and sample preparation for high-throughput mass spectrometry. | New England Biolabs (NEB) [32] |
| High-Throughput LC/MS System | Rapid, quantitative analysis of enzyme activity for thousands of variants. | Systems from Agilent, Waters, or Sciex are commonly used. [33] |
Data Presentation and Analysis
The quantitative outcomes from a high-throughput screen should be organized for clear interpretation and decision-making.
Table 2: Example Data from a High-Throughput Screen of a Combinatorial Methyltransferase Library for SAM Analog Synthesis
| Variant ID | Mutations | Relative Activity vs. WT (%) | SAM Analog Produced | Notes |
|---|---|---|---|---|
| WT | - | 100 | SAM | Baseline activity. |
| Var-045 | L15G, F180S | 95 | SAM | Minimal change in activity. |
| Var-128 | M137H, D195K | 15,500 | Ethyl-SAM | Orders-of-magnitude improvement in analog synthesis [33]. |
| Var-256 | L15A, M137V, F180T | 32,000 | Propyl-SAM | Highly active triple mutant, demonstrating additivity of beneficial mutations. |
| Var-398 | M137P, D195G | <1 | - | Disrupted activity, likely due to destabilizing mutations. |
Visualization of Screening Outcomes
The final step in the pipeline involves analyzing screening data to identify high-performing hits and understand mutation interactions, as shown in the diagram below.
Amide bonds represent one of the most fundamental chemical linkages in pharmaceuticals, found in approximately 16% of all marketed drugs and clinical candidates [34]. Traditional chemical synthesis of amide bonds often relies on stoichiometric coupling reagents, which generates significant waste and conflicts with green chemistry principles [34] [35]. Biocatalytic approaches using amide synthetases offer a sustainable alternative, performing reactions under mild conditions with high selectivity and reduced environmental impact [9] [34].
However, enzyme engineering faces substantial challenges in rapidly generating and interpreting sequence-function relationships. Conventional methods struggle with mapping epistatic interactions and navigating vast protein sequence spaces efficiently [9] [2]. This case study details an integrated machine-learning and cell-free platform for engineering amide synthetases, providing a framework for high-throughput screening and development of specialized biocatalysts for pharmaceutical applications.
Experimental Design & Workflow
Integrated ML-CFPS Platform Architecture
The platform combines cell-free protein synthesis (CFES) with machine learning to create an iterative Design-Build-Test-Learn (DBTL) cycle, enabling parallel optimization of enzymes for multiple pharmaceutical targets [9] [23].
Diagram 1: Machine-learning guided cell-free protein synthesis workflow.
Key Reagents and Research Solutions
Table 1: Essential Research Reagents and Materials
| Reagent/Material | Function/Application | Key Features |
|---|---|---|
| McbA (Marinactinospora thermotolerans) | Starting enzyme for engineering | ATP-dependent amide synthetase with native promiscuity [9] |
| Cell-Free Protein Synthesis (CFES) System | In vitro protein expression | Bypasses cellular transformation; enables high-throughput variant testing [9] [23] |
| Linear Expression Templates (LETs) | DNA templates for CFES | PCR-amplified; enables rapid library construction without cloning [9] |
| Machine Learning Framework | Predictive model building | Augmented ridge regression; integrates sequence-function data [9] |
| Pharmaceutical Substrates | Enzyme performance assessment | 9 target compounds including moclobemide, metoclopramide, cinchocaine [9] |
Methods and Protocols
Cell-Free Library Construction and Screening
Site-Saturation Mutagenesis Protocol
This five-step protocol enables construction of sequence-defined protein variant libraries within 24 hours [9]:
Primer Design and PCR: Design DNA primers containing nucleotide mismatches to introduce desired mutations via PCR amplification of parent plasmid.
Parental Plasmid Digestion: Treat PCR product with DpnI restriction enzyme to digest methylated parent plasmid template.
Gibson Assembly: Perform intramolecular Gibson assembly to form circular mutated plasmid from linear DNA fragments.
Linear Expression Template (LET) Generation: Amplify linear DNA expression templates using a second PCR reaction with primers flanking the gene of interest.
Cell-Free Protein Expression: Express mutated proteins using cell-free gene expression system, typically incubating for 2-6 hours at 30-37°C.
Critical Notes: This approach avoids biases from degenerate primers and enables accumulation of mutations through rapid iterations. Library size is limited only by the number of individual reactions, with demonstrated capacity of 1,217 variants in parallel [9].
Hot Spot Screening Implementation
Residue Selection: Select 64 residues completely enclosing the active site and putative substrate tunnels (within 10 Å of docked native substrates) using McbA crystal structure (PDB: 6SQ8) [9].
Library Scale: For each target molecule, perform site-saturation mutagenesis on all selected positions (64 residues × 19 amino acids = 1,216 single mutants).
Screening Conditions: Use relatively high substrate concentrations (25 mM) and low enzyme loading (~1 μM) to mimic industrially relevant conditions [9].
Machine Learning-Guided Engineering
Data Generation for Model Training
The initial experimental phase generated sequence-function data for 1,217 enzyme variants across 10,953 unique reactions to map fitness landscapes [9] [23]. This dataset enabled training of supervised ridge regression ML models augmented with an evolutionary zero-shot fitness predictor.
Model Implementation and Validation
- Algorithm: Augmented ridge regression models
- Training Data: Sequence-function relationships from single-order mutations
- Prediction Target: Higher-order mutants with increased activity
- Validation: Experimental testing of ML-predicted variants for 9 pharmaceutical compounds
- Computational Requirements: Runs on central processing unit of typical computer [9]
Results and Data Analysis
Substrate Scope Analysis
Initial characterization of wild-type McbA revealed substantial substrate promiscuity, synthesizing 11 pharmaceutical compounds with conversions ranging from trace amounts detectable only by mass spectrometry to approximately 12% [9]. Key findings included:
- Substrate Tolerance: Aryl, benzoic, and cinnamic acids readily accepted; aliphatic acids poorly tolerated
- Amine Preference: Primary and secondary aliphatic amines coupled efficiently; aryl amines presented challenges
- Selectivity Observations: Strong stereoselectivity (e.g., preference for S-sulpiride over R-sulpiride) and strict chemo-/regioselectivity
Engineering Outcomes for Pharmaceutical Targets
Table 2: Performance of Engineered Amide Synthetase Variants
| Pharmaceutical Target | Wild-Type Activity | Engineered Variant Improvement | Key Application Notes |
|---|---|---|---|
| Moclobemide | 12% conversion | 1.6- to 42-fold improved activity | Monoamine oxidase inhibitor; high promiscuity substrate [9] |
| Metoclopramide | 3% conversion | Significant activity improvement | Acid component contains free amine that could compete [9] |
| Cinchocaine | 2% conversion | Substantially enhanced activity | Unique acid component; shares amine with metoclopramide [9] |
| Multiple Additional Pharmaceuticals | Trace to minimal | 1.6- to 42-fold enhanced activity | Six compounds engineered simultaneously [9] [23] |
Computational Validation Metrics
Recent advances in computational evaluation provide complementary frameworks for assessing generated enzyme variants. The Composite Metrics for Protein Sequence Selection (COMPSS) framework integrates multiple metrics to improve experimental success rates by 50-150% [5]:
Diagram 2: Computational evaluation framework for generated enzyme variants.
Discussion and Implementation Notes
Platform Advantages for Pharmaceutical Development
The ML-guided cell-free platform addresses several critical limitations in conventional enzyme engineering [9] [23]:
- Parallel Optimization: Enables simultaneous engineering for multiple distinct reactions, moving beyond single-transformation optimization
- Epistatic Mapping: Captures beneficial pairwise and higher-order synergies that might be missed in iterative site-saturation approaches
- Data Efficiency: Rapidly generates large sequence-function datasets essential for effective machine learning
- Versatility: Successfully converted a generalist amide synthetase into multiple specialist enzymes
Integration with Complementary Screening Technologies
For laboratories with different resource constraints, several complementary high-throughput screening methods can be integrated:
- Growth Selection Assays: Ultra-high throughput (up to 10^7 variants per plate) methods coupling enzyme activity to essential metabolite production [36]
- Fluorescence-Activated Cell Sorting (FACS): Enables screening at rates up to 30,000 cells per second when combined with surface display or product entrapment [2]
- In Vitro Compartmentalization (IVTC): Uses water-in-oil emulsions to create independent reactors, avoiding transformation efficiency limitations [2]
Protocol Adaptation Guidelines
For implementation in different research settings, consider these adaptations:
- Library Scale Reduction: Focus on 20-30 active site residues for initial campaigns to reduce screening burden
- Alternative ML Models: Implement random forest or gradient boosting models if ridge regression underperforms for specific enzyme families
- Hybrid Screening: Combine initial high-throughput growth selection [36] with secondary CFES validation for resource-efficient tiered screening
This case study demonstrates that machine-learning guided cell-free expression platforms significantly accelerate amide synthetase engineering for pharmaceutical applications. By integrating high-throughput experimental data generation with computational prediction, the approach enables efficient navigation of protein sequence space to develop specialized biocatalysts. The methodology provides a generalizable framework for enzyme engineering that can be extended to other biocatalyst classes, supporting the growing emphasis on sustainable synthetic strategies in pharmaceutical development.
Biochemical assay development is a foundational pillar of modern preclinical research, enabling scientists to screen compound libraries, elucidate enzyme mechanisms, and evaluate potential drug candidates. The process involves designing, optimizing, and validating methods to measure specific biochemical activities, such as enzyme kinetics, binding affinities, or functional cellular outcomes [37]. A well-constructed assay translates biological phenomena into quantifiable, reliable data, forming the critical link between fundamental enzymology and translational discovery. In the context of high-throughput screening (HTS) for enzyme engineering, a robust assay is indispensable for efficiently discriminating between thousands of variant enzymes to identify those with enhanced properties [24] [38].
The transition from a conceptual assay to one fit for industrial-scale screening presents significant challenges. Traditional development can be a protracted process, consuming months of effort and considerable resources [37]. However, strategic approaches that leverage universal assay platforms and rigorous optimization can dramatically accelerate this timeline, saving both time and cost while ensuring the generation of high-quality, reproducible data essential for informed decision-making in research and development pipelines [37].
Foundational Assay Development Strategies
The development of a high-throughput assay follows a structured, multi-stage pathway, balancing scientific precision with practical requirements for robustness and scalability.
The Systematic Development Workflow
A methodical approach to assay development ensures reproducibility and scalability, which are essential for high-throughput applications [37]. The key stages are summarized in the workflow below.
Detection Methodologies: Choosing the Right Tool
Selecting an appropriate detection method is a critical decision point in assay development. The choice depends on the reaction being measured, required sensitivity, dynamic range, and available instrumentation [37]. Assays can be broadly categorized as follows.
- Binding Assays: These quantify molecular interactions (e.g., protein-ligand) and are typically used to measure affinity (
Kd) or dissociation rates. Common techniques include Fluorescence Polarization (FP), which detects changes in a fluorescent ligand's rotational speed upon binding a larger molecule, and Surface Plasmon Resonance (SPR), which measures real-time binding events without labels [37]. - Enzymatic Activity Assays: These form the core of enzyme variant screening by directly measuring the conversion of substrate to product.
- Coupled/Indirect Assays: Utilize a secondary enzyme system to convert the primary product into a detectable signal (e.g., coupling ADP production to a luminescent reaction). While they can offer signal amplification, each additional step introduces potential interference [37].
- Direct Detection Assays: These "mix-and-read" homogeneous assays detect the enzymatic product directly without separation or coupling steps. Technologies like the Transcreener ADP² Assay (measuring ADP) or the AptaFluor SAH Assay (measuring S-adenosylhomocysteine) are universal platforms that offer broad applicability across enzyme classes, simplified workflows, and high compatibility with automation [37].
- Specialty Formats: For specific needs, techniques like kinetic assays (for real-time rate measurement) or label-free detection (e.g., calorimetry) provide orthogonal validation [37].
Application Note: HTS Protocol for Isomerase Variant Screening
This application note details the establishment of a robust HTS protocol for directed evolution of L-rhamnose isomerase (L-RI), designed to identify variants with enhanced activity for the production of the rare sugar D-allose [24].
Experimental Workflow and Protocol
The following diagram and detailed protocol outline the key steps from gene to analysis.
Detailed Step-by-Step Protocol
- Step 1: High-Throughput Protein Expression
- Inoculate 1 mL of LB medium (with 50 mg/l ampicillin and 5 mM lactose) in a 96-well deep-well plate with a single colony of E. coli BL21(DE3) harboring the L-RI variant plasmid.
- Culture with agitation (200 rpm) at 30°C for 18 hours for protein expression.
- Step 2: Cell Harvest and Lysis
- Harvest cells by centrifuging the plate at 2,000 × g for 10 minutes. Discard the supernatant.
- Completely resuspend cell pellets in 200 µL of Bugbuster Master Mix.
- Incubate the plate in a shaking incubator (25°C, 300 rpm) for 20 minutes to lyse cells.
- Centrifuge the plate at 4,000 × g for 20 minutes to pellet cell debris.
- Step 3: Enzymatic Reaction
- Carefully transfer 40 µL of the clarified lysate (supernatant) to a fresh 96-well PCR plate.
- Add 160 µL of substrate master mix to each well to initiate the reaction. The final master mix contains 100 mM D-allulose, 50 mM Tris-HCl (pH 7.0), and 10 mM MnCl₂.
- Perform the reaction in a thermal cycler with the following program: incubation at 75°C for 4 hours, heat denaturation at 95°C for 5 minutes to terminate the reaction, and a final cooling step at 4°C for 15 minutes [24].
- Step 4: Seliwanoff's Colorimetric Detection
- Centrifuge the PCR plate at 13,000 × g for 3 minutes to remove denatured enzymes.
- Transfer 240 µL of the resulting supernatant to a new 96-well assay plate.
- Add 480 µL of Seliwanoff's reagent (a mixture of resorcinol and 6N HCl) to each well and mix thoroughly.
- Incubate the plate in a water bath or heated block at 60°C for 30 minutes to develop color.
- Cool the plate at room temperature (25°C) for 1 hour to stabilize the color [24].
- Step 5: Data Acquisition and Analysis
- Measure the absorbance of the resulting cherry-red product at an appropriate wavelength (typically ~520 nm).
- Calculate enzyme activity based on the depletion of the ketose substrate D-allulose, which is proportional to the color intensity.
Key Reagent Solutions
Table 1: Essential Research Reagents for the Isomerase HTS Protocol
| Reagent / Material | Function / Role in the Assay |
|---|---|
| L-RI Variant Library | Provides the genetic diversity for screening; cloned into an expression vector (e.g., pBT7) [24]. |
| Bugbuster Master Mix | A ready-to-use reagent for rapid, efficient cell lysis and protein extraction in a 96-well format [24]. |
| D-Allulose Substrate | The ketose sugar isomerized by L-RI to D-allose; its consumption is measured to determine activity [24]. |
| Seliwanoff's Reagent | Colorimetric detection solution (Resorcinol + HCl); reacts with ketoses to form a cherry-red chromophore [24]. |
| MnCl₂ Cofactor | Essential divalent cation cofactor for optimal L-RI enzymatic activity [24]. |
Validation and Quality Control
A critical step in HTS assay development is validating its performance using statistical metrics to ensure it can reliably distinguish between positive and negative hits [37] [24].
Table 2: Key Statistical Metrics for HTS Assay Validation
| Metric | Definition & Calculation | Acceptance Criterion | Result for Isomerase HTS [24] | ||
|---|---|---|---|---|---|
| Z'-Factor | A statistical parameter reflecting the assay's robustness and suitability for HTS. `Z' = 1 - [ (3σpos + 3σneg) / | μpos - μneg | ]` | Z' > 0.5 indicates an excellent assay [37]. | 0.449 (Meets quality criteria) |
| Signal Window (SW) | The dynamic range between positive and negative controls. | A larger window (>2-3) is desirable for clear signal distinction. | 5.288 | ||
| Assay Variability Ratio (AVR) | Measures the precision and variability of the assay signal. | Lower values indicate less variability and greater reproducibility. | 0.551 |
The protocol's validation against high-performance liquid chromatography (HPLC) confirmed its excellent accuracy in quantifying D-allulose depletion, making it a reliable and efficient method for screening isomerase variant libraries [24].
Advanced HTS Platform: Integrated Protein Expression and Screening
Emerging technologies are streamlining HTS by integrating protein production and functional assays. One such innovation is the Vesicle Nucleating peptide (VNp) technology, which enables high-yield export of recombinant proteins from E. coli in a multi-well plate format [38].
Workflow for Integrated Expression and Screening
The VNp platform simplifies the screening pipeline, as illustrated below.
This platform offers significant advantages: it bypasses traditional, time-consuming steps of cell disruption and protein purification, as the exported protein in vesicles is of sufficient purity for direct use in enzymatic assays [38]. Typical yields from a 100 µL culture in a 96-well plate range from 40 to 600 µg of exported protein, which is highly reproducible between wells—a critical factor for meaningful variant comparison in protein engineering screens [38]. This integrated approach is applicable for yield optimization, mutant library screening, and ligand-binding studies.
Data Presentation and Analysis in HTS
Effective data structuring and presentation are fundamental to interpreting the vast datasets generated by HTS campaigns.
Principles of Data Structuring for Analysis
Data for analysis should be structured in a tabular format, where each row represents a single data record—in this context, an individual enzyme variant [39]. Each column (field) should contain a specific attribute or measurement for that variant (e.g., specific activity, IC₅₀, expression level). A unique identifier (UID) for each row is a best practice [39]. Understanding the granularity (what a single row represents) is crucial for correct analysis and the use of Level of Detail (LOD) expressions [39].
Presenting Quantitative HTS Results
Clear presentation of quantitative results is key. The following table summarizes ideal characteristics for a robust HTS assay, providing a benchmark for researchers to evaluate their own systems.
Table 3: Target Assay Performance Characteristics for Robust HTS
| Performance Characteristic | Description | Ideal Target Value |
|---|---|---|
| Z'-Factor | Measure of assay robustness and signal dynamic range. | > 0.5 [37] |
| Signal-to-Background Ratio (S/B) | Ratio of the signal in the positive control to the negative control. | As high as possible, typically > 2-3x |
| Coefficient of Variation (CV) | Measure of assay precision (relative standard deviation). | < 10-15% |
| Dynamic Range | Difference between the upper and lower signal plateaus. | Sufficient to accurately fit a dose-response curve |
When formatting such tables for readability, several guidelines should be followed: use clear and descriptive titles and column headers, align numerical data to the right for easy comparison, and consider using alternating row shading (zebra striping) to improve readability across long rows of data [40].
Troubleshooting Experimental Challenges and Optimizing Screening Efficiency
Addressing Incomplete Digestion and Unexpected Cleavage Patterns in Screening Assays
In high-throughput screening (HTS) of enzyme variants, the reliability of restriction digestion is paramount for successful cloning and analysis of engineered libraries. Incomplete digestion and unexpected cleavage patterns represent significant bottlenecks that can compromise screening accuracy, leading to false positives/negatives and reduced screening efficiency. These issues are particularly problematic in directed evolution campaigns where researchers must process thousands of variants. This application note provides detailed protocols and troubleshooting guidance to address these common challenges, framed within the context of HTS for enzyme engineering. The methodologies outlined support the broader thesis that robust biochemical protocols are foundational to successful high-throughput protein engineering outcomes.
Troubleshooting Digestions in Screening Workflows
Understanding Digestion Issues
In screening assays, two primary digestion anomalies require systematic addressing:
Incomplete or No Digestion: The failure of restriction enzymes to completely cleave all recognition sites in substrate DNA, resulting in a mixture of fully digested, partially digested, and undigested DNA fragments that appear as additional bands during electrophoresis analysis [41]. This directly impacts cloning efficiency by reducing ligation success and increasing background noise.
Unexpected Cleavage Patterns: DNA fragments that deviate from anticipated sizes post-digestion, manifesting as additional bands, missing bands, or smeared patterns on gels [41]. In HTS, this can lead to misidentification of promising variants and wasted resources on false leads.
Structured Troubleshooting Guide
The tables below synthesize quantitative data and recommendations for addressing these issues in screening environments.
Table 1: Troubleshooting Incomplete or No Digestion
| Possible Cause | Recommendations for HTS Workflows | Impact on Screening |
|---|---|---|
| Inactive Enzyme | - Verify storage at -20°C without temperature fluctuations [42].- Avoid >3 freeze-thaw cycles; use working aliquots [42].- Test enzyme activity with 1 µg control DNA (e.g., lambda DNA) [42]. | Compromised variant library construction; increased screening costs. |
| Suboptimal Reaction Conditions | - Use 3-5 units of enzyme per µg DNA; increase to 5-10 U/µg for supercoiled plasmids [42] [41].- Ensure reaction volume does not exceed 1/10 of total volume to keep [glycerol] <5% [41].- Add enzyme last and mix thoroughly to prevent settling [41]. | Reduced digestion efficiency across screening plates; inconsistent results. |
| Methylation Effects | - Propagate plasmids in E. coli dam-/dcm- strains (e.g., GM2163) for methylation-sensitive enzymes [42].- Check enzyme sensitivity to CpG methylation for eukaryotic DNA [42]. | Failure to digest target sites; loss of specific variants from libraries. |
| Substrate DNA Structure | - For PCR fragments: ensure sufficient flanking bases (4-8) at 5' end [41].- For double digests in MCS: perform sequential digestion if sites are <10bp apart [42].- For supercoiled DNA: use certified enzymes and increased units [41]. | Inefficient liberation of inserts; reduced ligation efficiency. |
| Contaminants | - Purify DNA via spin columns to remove SDS, EDTA, salts, proteins [41].- For PCR products: limit reaction volume to ≤1/3 of total digestion volume [41].- Use molecular biology-grade water [41]. | Enzyme inhibition; plate-wide failure in HTS formats. |
Table 2: Addressing Unexpected Cleavage Patterns
| Possible Cause | Recommendations for HTS Workflows | Impact on Screening |
|---|---|---|
| Star Activity | - Use ≤10 U enzyme/µg DNA; avoid prolonged incubation [41].- Use recommended buffer; avoid low salt, suboptimal pH, or cations other than Mg²⁺ [42].- Consider engineered enzymes with reduced star activity [41]. | Additional, incorrect bands; misidentification of variant band sizes. |
| Contamination | - Use fresh enzyme/buffer tubes to avoid cross-contamination [42].- Prepare new DNA samples to exclude foreign substrate DNA [41]. | Spurious results; loss of screening plate reproducibility. |
| Gel Shift Effect | - Heat denature (65°C for 10 min) with loading buffer containing 0.2% SDS before electrophoresis [42] [41]. | Altered DNA migration; incorrect fragment size interpretation. |
| Unexpected Recognition Sites | - Sequence verification of DNA templates and ligated constructs [41].- Check for degenerate recognition sites (e.g., XmiI: GTMKAC) [42]. | Additional cleavage sites; unexpected banding patterns. |
Experimental Protocols for HTS
Standardized Restriction Digestion Protocol for Screening
This protocol is optimized for 96-well plate formatting to ensure reproducibility across HTS campaigns.
Materials & Reagents
- Restriction enzymes with appropriate 10X reaction buffer
- Purified DNA (20-100 ng/µL final concentration in reaction)
- Nuclease-free water
- 96-well PCR plates
- Plate sealer
- Thermal cycler
Procedure
- Reaction Setup: In a 96-well plate, assemble reactions on ice:
- 1.0 µL DNA (100-500 ng total)
- 2.0 µL 10X reaction buffer
- 1.0 µL restriction enzyme (10 U/µL)
- 16.0 µL nuclease-free water
- Total volume: 20.0 µL
Mixing: Seal plate and centrifuge briefly at 1000 × g. Flick-mix or pipette-mix gently to ensure enzyme distribution without introducing bubbles.
Incubation: Transfer plate to thermal cycler. Incubate at recommended temperature (typically 37°C) for 1 hour. For double digests requiring different temperatures, perform sequential digestions starting with the lower temperature enzyme.
Enzyme Inactivation: Heat-inactivate at 65°C for 20 minutes (if enzyme is heat-sensitive).
Analysis: Use 5-10 µL for agarose gel electrophoresis or proceed directly to ligation/transformation.
Validation: Include positive control (DNA with known restriction pattern) and negative control (no enzyme) on each plate [42].
Protocol Adaptation for Methylation-Sensitive Digestion
For enzymes inhibited by DAM/DCM methylation:
Strain Selection: Propagate all plasmid DNA in E. coli GM2163 or other dam-/dcm- strains [42].
Verification: Confirm methylation status by digestion with methylation-sensitive enzymes (e.g., BclI) alongside methylation-insensitive isoschizomers.
Alternative Enzymes: Identify and use neoschizomers unaffected by methylation when available [41].
HTS Validation Protocol for Isomerase Screening
Adapted from established HTS protocols for isomerase activity [43], this method can be modified for restriction enzyme validation:
Principle: Colorimetric detection based on Seliwanoff's reaction to quantify substrate depletion.
Procedure:
- Reaction Setup: In 96-well format, combine:
- 50 µL enzyme variant lysate
- 50 µL substrate solution (D-allulose for isomerase screening)
Incubation: 37°C for 30 minutes with shaking.
Detection: Add 100 µL Seliwanoff's reagent, incubate at 80°C for 10 minutes, measure absorbance.
Validation: Compare to HPLC measurements for accuracy confirmation [43].
Quality Metrics: Z'-factor >0.4, Signal Window >2.0, Assay Variability Ratio <0.6 [43].
Visual Workflows for Diagnostic and Experimental Processes
Diagnostic Workflow for Digestion Issues
This diagram outlines the systematic troubleshooting process for addressing digestion problems in screening assays.
Diagram 1: Diagnostic workflow for digestion issues in screening assays.
High-Throughput Screening Workflow
This diagram illustrates the integrated HTS protocol incorporating optimized digestion steps.
Diagram 2: High-throughput screening workflow with optimized digestion steps.
The Scientist's Toolkit: Research Reagent Solutions
Table 3: Essential Reagents for Digestion Troubleshooting in HTS
| Item | Function in Screening | Application Notes |
|---|---|---|
| Methylation-Free E. coli Strains (e.g., GM2163) | Propagate plasmid DNA without DAM/DCM methylation that inhibits certain restriction enzymes [42]. | Essential for libraries screened with methylation-sensitive enzymes; maintain selective pressure. |
| Control DNA Substrates (e.g., Lambda DNA) | Verify restriction enzyme activity and establish baseline performance across screening plates [42]. | Include on every screening plate as quality control; track inter-plate variability. |
| Single-Buffer Enzyme Systems | Enable simultaneous digestion with multiple enzymes in HTS formats without buffer compatibility issues [41]. | Reduces pipetting steps in 96-well format; improves reproducibility. |
| Spin Column Purification Kits | Remove contaminants (SDS, EDTA, salts) from DNA preparations that can inhibit enzyme activity [41]. | Critical for PCR products directly used in digestion; implement in automated liquid handling systems. |
| High-Fidelity DNA Polymerases | Amplify DNA fragments with minimal mutation rates for reliable restriction site preservation [41]. | Essential for library construction where introduced mutations should be deliberate, not polymerase errors. |
| Nuclease-Free Water | Serve as reaction diluent without enzymatic contaminants that degrade DNA or interfere with digestion [41]. | Quality varies by supplier; validate for HTS through negative control reactions. |
| Thermostable Restriction Enzymes | Function at elevated temperatures, offering specificity and reduced star activity in specialized applications. | Valuable for sequential digests requiring different temperature optima. |
Robust restriction digestion is fundamental to successful high-throughput screening of enzyme variants. The protocols and troubleshooting guides presented here address the most common challenges—incomplete digestion and unexpected cleavage patterns—with specific recommendations tailored to screening environments. By implementing standardized digestion protocols, systematic diagnostic workflows, and appropriate reagent solutions, researchers can significantly improve the reliability and efficiency of their HTS campaigns. The integration of these methods supports the broader thesis that meticulous attention to foundational molecular biology techniques is essential for successful enzyme engineering and drug development outcomes.
In high-throughput screening (HTS) of enzyme variants, optimizing reaction conditions is critical for generating reproducible and biologically relevant data. Parameters such as enzyme concentration, incubation time, and buffer composition directly influence enzyme activity, stability, and compatibility with automated platforms. This document outlines standardized protocols and data-driven strategies for optimizing these parameters, with a focus on applications in drug development and enzyme engineering.
Key Parameters for Optimization
Enzyme Concentration
- Objective: Determine the minimal enzyme concentration yielding maximal activity without substrate depletion or signal saturation.
- Protocol:
- Prepare a dilution series of the enzyme (e.g., 0.1–100 µg/mL) in assay buffer.
- Incubate with substrate under fixed temperature and pH.
- Measure initial reaction rates (e.g., via absorbance or fluorescence).
- Plot activity vs. concentration to identify the linear range and saturation point.
Table 1: Enzyme Concentration Optimization
| Enzyme (µg/mL) | Activity (U/mL) | Signal-to-Noise Ratio |
|---|---|---|
| 0.1 | 5.2 | 1.5 |
| 1.0 | 28.7 | 8.2 |
| 10.0 | 95.4 | 24.3 |
| 50.0 | 98.1 | 25.0 |
| 100.0 | 97.9 | 24.8 |
Incubation Time
- Objective: Establish the time required for reaction completion while avoiding enzyme inactivation or product inhibition.
- Protocol:
- Initiate reactions with optimized enzyme concentration.
- Measure product formation at intervals (e.g., 1, 5, 10, 30, 60 min).
- Terminate reactions using EDTA (e.g., 10 mM final concentration) or heat inactivation (65°C for 15 min) [44].
Table 2: Incubation Time Kinetics
| Time (min) | Product Formed (µM) | Reaction Rate (µM/min) |
|---|---|---|
| 1 | 5.1 | 5.1 |
| 5 | 28.9 | 5.8 |
| 10 | 49.7 | 5.0 |
| 30 | 135.2 | 4.5 |
| 60 | 240.1 | 4.0 |
Buffer Composition
- Objective: Identify buffer components that stabilize enzyme structure and function. Key factors include pH, ionic strength, and additives (e.g., Mg²⁺ for DNA polymerases) [45].
- Protocol:
- Test buffers across a pH range (e.g., 4–9) using 10 mM systems (e.g., phosphate, Tris-HCl).
- Include additives like MgCl₂ (1–8 mM) or NaCl (0–300 mM).
- Assess activity and stability via thermal shift assays or activity assays.
Table 3: Buffer Composition Screening
| Buffer | pH | Additives | Relative Activity (%) |
|---|---|---|---|
| Phosphate | 6.0 | None | 45.2 |
| Tris-HCl | 7.5 | 5 mM MgCl₂ | 100.0 |
| HEPES | 8.0 | 150 mM NaCl | 88.5 |
| Glycine-NaOH | 9.0 | 1 mM DTT | 62.3 |
High-Throughput Workflow Integration
Automated Protein Production
- Platform: Low-cost liquid-handling robots (e.g., Opentrons OT-2) enable parallel purification of 96 enzymes/week [10].
- Steps:
- Transformation: Use chemically competent E. coli and autoinduction media.
- Expression: Culture in 24-deep-well plates (2 mL/well) at 30°C.
- Purification: Employ affinity tags (e.g., His-tag) and magnetic bead-based purification.
- Buffer Exchange: Use protease cleavage (e.g., SUMO tag) to avoid imidazole interference [10].
Design of Experiments (DoE)
- Replace one-factor-at-a-time approaches with fractional factorial designs to optimize multiple parameters simultaneously [46].
- Example: For a protease assay, screen pH, temperature, and substrate concentration in 24 experiments instead of 96.
Case Study: Protease Inhibitor Screening
- Context: Purified protease inhibitors (PIs) from legumes (soybean, cowpea, chickpea) were screened for cytotoxicity and antimicrobial activity [47].
- Optimization Steps:
- Extraction: Used 0.02 M HCl (soybean/cowpea) or 0.3 M NaCl (chickpea).
- Purification: DEAE-Sepharose chromatography and Sephadex G-50 gel filtration.
- Activity Assay: Measured IC₅₀ against cancer cells (e.g., HepG2).
- Result: Soybean PIs showed highest potency (IC₅₀ = 0.282 µg/mL) [47].
The Scientist's Toolkit
Table 4: Essential Reagents and Equipment
| Item | Function | Example |
|---|---|---|
| Liquid-handling robot | Automated pipetting for high-throughput assays | Opentrons OT-2 [10] |
| Affinity tags | Facilitate protein purification | His-tag, SUMO tag [10] |
| Buffer components | Maintain pH and ionic strength | Tris-HCl, MgCl₂ [45] |
| Fluorescent reporters | Enable activity readouts in cellular assays | GFP, mCherry [48] |
| Microfluidic chips | Miniaturize cell-based assays for drug screening | PDMS-based chips [49] |
Workflow Diagrams
Diagram 1: High-Throughput Enzyme Screening Pipeline
Title: Automated Enzyme Screening Workflow
Diagram 2: Reaction Condition Optimization Strategy
Title: Condition Optimization Strategy
Systematic optimization of enzyme concentration, incubation time, and buffer composition is essential for robust HTS outcomes. Integrating automated platforms with DoE methodologies accelerates the identification of optimal conditions, enabling scalable characterization of enzyme variants for drug development and industrial applications.
Within the context of high-throughput screening for enzyme engineering, understanding and managing the interplay between epigenetic modifications and enzyme function is paramount. DNA methylation, a key epigenetic marker, can significantly influence cellular function and gene expression, thereby indirectly affecting the production and activity of enzyme variants [50]. Furthermore, the efficacy of engineered enzymes is ultimately constrained by their ability to access and act upon their target substrates [51]. This application note details practical methodologies and analytical frameworks for profiling DNA methylation and for conducting multiplexed substrate accessibility screens. We provide integrated protocols and data analysis pipelines designed to help researchers account for these structural limitations, thereby de-risking the development of robust enzyme variants for therapeutic and biocatalytic applications.
DNA Methylation Profiling in High-Throughput Screening
DNA methylation involves the addition of a methyl group to cytosine within CpG dinucleotides, a process catalyzed by DNA methyltransferases (DNMTs) and reversed by ten-eleven translocation (TET) enzymes [50]. In enzyme screening, variations in the methylation states of host cells can be a hidden source of variance, influencing gene expression and potentially altering the expression, folding, or function of engineered enzyme variants.
Automated Reduced Representation Bisulfite Sequencing (RRBS) Protocol
Reduced Representation Bisulfite Sequencing (RRBS) provides a cost-effective, high-throughput method for mapping DNA methylation across CpG-rich genomic regions, including most gene promoters [52]. The following automated protocol is optimized for efficiency and minimal batch effects.
Before You Begin:
- Institutional Permissions: Secure necessary approvals from your local institutional animal care and use committee.
- Preparation: Ensure the Biomek i7 or similar automated processing instrument is available. Prepare all reagents, including the GenFind V3 Kit and Ovation RRBS Methyl-Seq System.
Part I: DNA Extraction from Frozen Tissue (Day 1)
- Tissue Homogenization: Homogenize frozen rat tissues (e.g., liver, skeletal muscle) in a lysis buffer supplemented with Proteinase K.
- Automated DNA Extraction: Perform DNA extraction on a Biomek FXP instrument using the GenFind V3 Kit according to the manufacturer's instructions. This involves binding DNA to magnetic beads, washing, and elution.
- DNA Quality Control (QC) and Dilution: Quantify DNA using a Qubit dsDNA HS Assay Kit. Normalize DNA to a concentration of 11.8 ng/μL in 8.5 μL (100 ng total) for the RRBS library preparation.
Part II: Automated RRBS Library Preparation (Day 2) The library preparation is performed on a Biomek i7 instrument using the Ovation RRBS Methyl-Seq System.
- Restriction Digestion: Digest the DNA with the methylation-insensitive restriction enzyme MspI.
- End-Repair and A-Tailing: Repair the ends of the DNA fragments and add an adenine nucleotide overhang.
- Adapter Ligation: Ligate methylated adapters to the fragments.
- Size Selection: Perform size selection using AMPure XP beads to enrich for fragments in the desired size range.
- Bisulfite Conversion: Convert unmethylated cytosines to uracils using bisulfite treatment, while methylated cytosines remain protected.
- PCR Amplification: Amplify the library using PCR with indexing primers to allow for sample multiplexing.
- Library QC and Sequencing: Assess library quality and fragment size using a High Sensitivity NGS Fragment Analysis Kit. Pool libraries and sequence on an Illumina platform (e.g., NovaSeq 6000) [52].
Data Analysis Pipeline for RRBS
Post-sequencing, data must be processed to yield interpretable methylation calls.
- Alignment: Map bisulfite-converted sequencing reads to a reference genome using a dedicated aligner like
BismarkorBISCUIT[52]. - Methylation Calling: Determine the methylation status of each cytosine by comparing the sequence data to the reference. Calculate the percentage of reads showing methylation for each CpG site.
- Differentially Methylated Region (DMR) Analysis: Identify genomic regions with statistically significant differences in methylation levels between sample groups (e.g., different enzyme expression hosts) using tools like
methylKitorDSS.
The table below summarizes key reagents for this protocol.
Table 1: Research Reagent Solutions for Automated RRBS
| Reagent/Kit | Function | Source |
|---|---|---|
| GenFind V3 Kit | Automated genomic DNA isolation from tissue samples | Beckman Coulter |
| Ovation RRBS Methyl-Seq System | Provides all reagents for automated RRBS library preparation, including bisulfite conversion | Tecan |
| AMPure XP Beads | Solid-phase reversible immobilization (SPRI) for DNA size selection and cleanup | Beckman Coulter |
| Qubit dsDNA HS Assay Kit | Accurate quantification of low-concentration DNA samples | Thermo Fisher Scientific |
| High Sensitivity NGS Fragment Analysis Kit | Quality control of final RRBS libraries to assess size distribution and integrity | Agilent Technologies |
Substrate-Multiplexed Screening for Enzyme Accessibility
Substrate accessibility is a critical functional determinant for engineered enzymes. A substrate-multiplexed platform enables the rapid profiling of enzyme promiscuity and specificity against vast libraries of potential substrates, dramatically accelerating the characterization of enzyme variants [51].
Multiplexed Mass Spectrometry-Based Screening Protocol
This protocol uses cell lysates and substrate multiplexing to achieve high-throughput functional characterization.
Step 1: Enzyme Library Construction
- Clone a library of target enzyme variants (e.g., family 1 glycosyltransferases) into an appropriate expression vector (e.g., pET28a for E. coli expression) [51].
Step 2: Expression and Lysate Preparation
- Express enzymes in E. coli and prepare clarified cell lysates to serve as the enzyme source. Validation with purified enzymes is recommended to confirm lysate activity is comparable.
Step 3: Substrate Library Design and Pooling
- Select a diverse library of natural product substrates (e.g., 453 compounds). Pool substrates into multiplexed sets (e.g., 40 substrates per reaction) based on unique molecular weights to enable deconvolution by mass spectrometry [51].
Step 4: Multiplexed Enzymatic Reactions
- Incubate each enzyme-containing lysate with a pool of 40 substrates and the relevant sugar donor (e.g., UDP-glucose) in a single reaction.
- Include a negative control (e.g., lysate from E. coli expressing GFP).
Step 5: LC-MS/MS Analysis and Automated Product Identification
- Analyze crude reaction mixtures using Liquid Chromatography with Tandem Mass Spectrometry (LC-MS/MS).
- Use a computational pipeline to identify glycosylation products based on:
- Exact Mass Shift: A mass increase of +162.0533 Da for a single hexose glycosylation.
- MS/MS Spectral Similarity: The product's fragmentation pattern should be similar to its aglycone substrate. A cosine score threshold (e.g., 0.85) is applied to minimize false positives [51].
Table 2: Research Reagent Solutions for Substrate-Multiplexed Screening
| Reagent/Kit | Function | Source |
|---|---|---|
| MEGx Natural Product Library | Diverse library of potential enzyme acceptor substrates | Analyticon Discovery |
| UDP-glucose | Universal sugar donor for glycosyltransferase reactions | Commercial Suppliers |
| pET28a Expression Vector | Protein expression in E. coli | Novagen/MilliporeSigma |
| LC-MS/MS System | High-resolution mass spectrometry for detecting and identifying reaction products | Various (e.g., Thermo Fisher, Agilent) |
Integrating Machine Learning for Predictive Analysis
Machine learning (ML) transforms high-dimensional data from methylation and substrate screens into predictive models for enzyme engineering.
Data-Driven Enzyme Engineering
ML models can predict enzyme function from sequence or structural features, guiding the identification of beneficial variants.
- Feature Engineering: Numerical representations of enzymes include one-hot encoding of sequences, physicochemical feature vectors (e.g., AA-index, zScales), and language model embeddings (e.g., ProtVec) [30].
- Model Selection: Common models include:
DNA Methylation Analysis with Foundational Models
Emerging foundational models, such as MethylGPT and CpGPT, are pre-trained on vast methylome datasets. They enable tasks like imputation of missing methylation values and robust cross-cohort prediction of age and disease-related outcomes, enhancing the analysis of screening data [50].
Table 3: Quantitative Data from Featured Studies
| Assay Type | Key Quantitative Metric | Result / Typical Range | Significance |
|---|---|---|---|
| Automated RRBS [52] | Genomic Coverage | Targets CpG-rich regions (promoters, CpG islands) | Cost-effective, focused coverage of regulatory regions |
| Substrate Multiplexing [51] | Screening Throughput | 85 enzymes vs. 453 substrates (~38,500 reactions) | Enables genome-scale, protein-family-wide perspective on function |
| Product Identification Threshold | Cosine Score ≥ 0.85 | Stringent criterion minimizes false discovery rate in MS data | |
| scDEEP-mC (scWGBS) [53] | CpG Coverage per Cell | ~30% of CpGs at 20 million reads | High coverage enables single-cell and allele-resolved analysis |
Managing the structural limitations imposed by host cell epigenetics and enzyme-substrate accessibility is crucial for successful high-throughput enzyme engineering. The integrated application notes and protocols provided here—ranging from automated DNA methylation profiling and multiplexed substrate screening to machine learning-driven analysis—offer a comprehensive framework for researchers. By adopting these methodologies, scientists can gain deeper insights into the functional consequences of enzyme variants, de-risk the development process, and accelerate the discovery of novel biocatalysts for therapeutic and industrial applications.
Preventing and Identifying Star Activity in Enzymatic Reactions
In high-throughput screening (HTS) for enzyme engineering, the reliability of enzymatic reactions is paramount. Star activity, the phenomenon where an enzyme exhibits altered or relaxed specificity under non-standard conditions, represents a significant source of experimental noise and false positives/negatives in screening campaigns [54]. This non-canonical activity can be triggered by various factors commonly encountered in HTS environments, including prolonged reaction times, elevated enzyme concentrations, shifts in buffer pH and ionic strength, and the presence of organic solvents or specific cofactors [54].
Within the context of HTS for enzyme variant research, star activity poses a dual challenge. Firstly, it can lead to the misidentification of enzyme variants that appear improved due to promiscuous activity rather than enhanced targeted function. Secondly, it can cause researchers to overlook genuinely beneficial variants whose performance is masked by background noise from star activity in other wells [38]. As HTS campaigns increasingly utilize multi-well plate formats where thousands of enzyme variants are tested in parallel under miniaturized conditions, maintaining stringent reaction specificity becomes technically challenging yet critically important for generating high-quality, reproducible data [38] [54]. This application note provides detailed protocols and analytical frameworks for preventing, identifying, and quantifying star activity to ensure the fidelity of HTS data.
Detection and Analytical Methods
Quantitative Analysis of Reaction Fidelity
Systematic monitoring of reaction products is essential for identifying star activity. The following table summarizes the primary analytical techniques suitable for integration into HTS workflows to detect off-target products.
Table 1: Analytical Methods for Detecting Star Activity in HTS
| Method | Key Measurable Parameters | Throughput Compatibility | Detection Capability for Non-Canonical Products |
|---|---|---|---|
| HPLC with Internal Standard [55] | - Retention time shifts- Emergence of new peaks- Quantification of product ratios (Canonical:Non-canonical) | Medium (96-well plate format) | High (Direct separation and quantification of multiple products) |
| UV-Spectroscopy/Bulk Absorbance [55] | - Altered absorption spectra- Deviations from expected kinetic curves- Abnormal reaction endpoints | High (384-well and 1536-well plates) | Medium (Detects spectral anomalies but may not identify specific products) |
| Mass Spectrometry-Based Assays [56] | - Mass/charge (m/z) of unexpected products- Quantitative conversion rates for multiple products | Medium to High (with automation) | Very High (Unaffected by retention time, identifies products by mass) |
| Fluorescence-Based Assays [56] [54] | - Fluorescence intensity at non-target wavelengths- FRET signal deviation- Altered reaction kinetics | Very High (Ideal for 1536-well plates) | Low to Medium (Unless specifically designed to detect off-target products) |
High-Throughput Capability of Detection Methods
The choice of detection method must balance analytical power with throughput requirements. Fluorescence-based assays offer the highest throughput and are ideal for primary screening of large variant libraries, despite providing indirect evidence of star activity through kinetic anomalies [56] [54]. HPLC with an internal standard, while lower in throughput, provides definitive product separation and quantification, making it invaluable for confirmatory screening and hit validation [55]. For the most comprehensive analysis, mass spectrometry-based assays can unambiguously identify non-canonical products without requiring chromatographic separation, offering a powerful solution for characterizing star activity in priority variants [56].
Prevention Strategies and Experimental Design
Optimization of Reaction Conditions
Preventing star activity begins with rigorous optimization of reaction conditions before initiating full-scale HTS campaigns. The following experimental design framework systematically addresses the primary factors known to induce star activity.
Table 2: Condition Optimization to Minimize Star Activity Risk
| Factor | Optimal Range for Specificity | HTS Compatibility | Validation Experiments |
|---|---|---|---|
| Enzyme Concentration | Minimal concentration achieving detectable signal for canonical activity [54] | High (Easily titrated in plate format) | Dose-response curve establishing linear activity range |
| Reaction Time | Within linear phase of reaction progress curve [54] | Medium (Requires multiple time points) | Time-course analysis to identify deviation onset |
| Buffer pH and Composition | Enzyme-specific optimal pH; avoidance of drastic ionic strength shifts [54] | High (Multi-condition plates) | Parallel activity assays across pH and salt gradients |
| Cofactor Concentration (e.g., Mg²⁺, Mn²⁺) | Physiological ratios; avoidance of excess divalent cations [54] | High (Easily titrated) | Activity and specificity profiling across concentration range |
| Organic Solvent Content | <10% v/v for most aqueous systems [54] | High (Solvent tolerance screens) | Specificity comparison in aqueous vs. co-solvent systems |
High-Throughput Workflow Design
Implementing a tiered screening approach maximizes efficiency while controlling for star activity. Initial primary screens should utilize highly sensitive homogeneous assay formats (e.g., fluorescence or luminescence) to identify active variants [54]. Subsequently, hit variants should undergo confirmatory screening using orthogonal methods that directly detect reaction products, such as HPLC or mass spectrometry, to verify that the observed activity results from the intended reaction rather than star activity [55]. This multi-tiered approach ensures that resource-intensive characterization is focused on variants with genuine improvements in target function.
Detailed Experimental Protocols
Protocol 1: Primary HTS with Specificity Controls
This protocol adapts a vesicle nucleating peptide (VNp) technology for expressing and assaying recombinant enzymes directly in microplate wells, minimizing handling and variability [38].
Materials:
- VNp-Fusion Enzyme Variants: Expressed in E. coli and exported in vesicles [38]
- Multi-Well Plates: 96-well, 384-well, or 1536-well format
- Substrate Solution: Prepared in optimal specificity buffer
- Detection Reagents: Fluorescent or luminescent probes compatible with canonical product
- Positive Control: Wild-type enzyme with known specificity
- Negative Control: No-enzyme control, inactive mutant control
- Specificity Control: Alternate substrate susceptible to star activity
Procedure:
- Vesicle Isolation: Centrifuge culture media at 4,000 × g for 10 minutes to isolate vesicles containing VNp-fusion enzymes. Transfer supernatant to fresh assay plates [38].
- Reaction Setup: In designated wells, combine:
- 50 µL vesicle suspension (containing exported enzyme)
- 10 µL substrate solution (varying concentrations for kinetic analysis)
- 10 µL cofactor solution (at optimized concentration)
- 30 µL specificity buffer
- Control Wells:
- Column 1: Positive control (wild-type enzyme + primary substrate)
- Column 2: Negative control (vesicles without enzyme + primary substrate)
- Column 3: Specificity control (enzyme + alternate substrate)
- Reaction Incubation: Incubate plates at assay temperature with continuous orbital shaking. Monitor reaction progress in real-time using plate readers.
- Data Collection: Record signal development every 30-60 seconds to establish kinetic profiles. Calculate initial velocities from linear phase of progress curves.
Protocol 2: Orthogonal Validation via HPLC
This protocol provides a quantitative method for detecting star activity by separating and quantifying both canonical and non-canonical reaction products [55].
Materials:
- HPLC System: Agilent 1200 or equivalent with C8 or C18 column [55]
- Mobile Phase: Water (0.1% formic acid) and acetonitrile (HPLC grade)
- Internal Standard: Caffeine (2.11 mM in acetonitrile) [55]
- Calibration Standards: Authentic samples of canonical product and potential non-canonical products
- Reaction Quenching Solution: Acetonitrile with 22% HCl [55]
Procedure:
- Sample Preparation:
- Combine 180 µL reaction sample with 180 µL acetonitrile
- Centrifuge at 8,000 rpm for 4 minutes using 0.2 µm nylon membrane filters [55]
- Add 6 µL of 22% HCl and 60 µL of 15 mM caffeine internal standard solution
- HPLC Analysis:
- Data Analysis:
- Identify peaks by comparison to retention times of authentic standards
- Calculate concentrations using internal standard calibration curves
- Compute specificity ratio: (Canonical Product Area)/(Total Product Area)
Data Analysis and Interpretation
Quantification of Star Activity
Calculate the Star Activity Index (SAI) for each enzyme variant using the formula:
An SAI approaching 0 indicates high specificity, while an SAI >0.1 suggests significant star activity that may compromise HTS data quality. Variants with SAI >0.15 should be flagged for further investigation or excluded from hit lists.
Machine Learning Integration
For large-scale variant screening, incorporate machine learning approaches to predict star activity propensity from sequence and structural features. Train models on empirical SAI data to identify sequence motifs and structural characteristics associated with promiscuity [9]. These predictive models can prioritize variants with desired specificity profiles for downstream characterization, accelerating the engineering cycle.
The Scientist's Toolkit
Table 3: Essential Research Reagent Solutions
| Reagent/Tool | Function in Star Activity Management | Example Application |
|---|---|---|
| VNp Peptide Technology [38] | Enables high-yield export of functional enzymes in vesicles for direct in-plate assay | Minimizes purification-induced stress that can trigger star activity |
| Internal Standard (Caffeine) [55] | Normalizes analytical variability in product quantification | HPLC-based specificity validation |
| P2Rank Software [57] | Predicts ligand-binding pockets to identify potential off-target sites | In silico assessment of promiscuity risk during variant design |
| CAPIM Pipeline [57] | Integrates catalytic site prediction with EC number annotation | Identifies residual activities in engineered variants |
| Transcreener FRET Assays [54] | Universal detection of nucleotide-dependent enzyme products | High-throughput specificity screening for nucleotide-utilizing enzymes |
| Cell-Free Expression Systems [9] | Rapid synthesis and testing of enzyme variants without cellular constraints | Fast screening of condition effects on enzyme specificity |
Workflow Visualization
HTS Star Activity Management - This workflow diagrams a tiered screening approach to identify and manage star activity during high-throughput enzyme variant screening.
Effective management of star activity is not merely a quality control measure but a fundamental requirement for successful high-throughput enzyme engineering. By implementing the prevention strategies, detection protocols, and analytical frameworks outlined in this application note, researchers can significantly enhance the fidelity of their screening data. The integrated approach of combining rapid primary screens with orthogonal validation methods creates a robust system for distinguishing genuine improvements in enzyme function from artifacts of promiscuous activity. As HTS continues to evolve toward increasingly miniaturized and parallelized formats, these foundational principles for controlling star activity will remain essential for accelerating the development of novel biocatalysts.
Strategies for Handling Contaminated Templates and Inhibitor Interference
In high-throughput screening (HTS) for enzyme variant research, the integrity of experimental results is paramount. Contaminated templates and inhibitor interference represent significant challenges that can compromise data quality, leading to false positives, false negatives, and misleading structure-activity relationships. These issues are particularly critical in the context of directed evolution campaigns and biocatalyst development, where accurate phenotype assessment drives the selection of improved enzymes for industrial and therapeutic applications. The financial and temporal costs associated with flawed screening outcomes necessitate robust protocols for identifying and mitigating these interference factors. This application note details practical strategies to safeguard screening campaigns, ensuring the reliable identification of genuine hits amid the complex background of large-scale enzymatic assays.
Detection and Diagnostic Strategies
Quantitative HTS for Characterizing Interference
The first line of defense is the implementation of screening methodologies that inherently characterize compound behavior. Quantitative HTS (qHTS) profiles library members across a range of concentrations, generating concentration-response curves for every compound [58]. This approach is fundamentally more informative than traditional single-concentration screening.
- Protocol: qHTS for Inhibition Profiling
- Plate Preparation: Prepare assay plates with test compounds serially diluted (e.g., seven 5-fold dilutions) across a concentration range of at least four orders of magnitude. Utilize 1,536-well plates to maximize throughput [58].
- Assay Execution: Combine enzyme variants, substrate, and compounds under standardized reaction conditions. For oxidoreductases, a coupled assay detecting ATP production via luciferase-generated luminescence is effective [58].
- Data Analysis: Fit concentration-response data and classify curves [58].
- Class 1: Complete curve, high efficacy (>80%), and good fit (r² ≥ 0.9). Represents unambiguous activators or inhibitors.
- Class 2: Incomplete curve with only one asymptote. Suggests potential interference or complex pharmacology.
- Class 3: Activity only at the highest concentration. High risk of non-specific inhibition or artifact.
- Class 4: Inactive. No significant response.
This profiling allows researchers to distinguish specific inhibitors from non-specific interferents based on the shape and quality of the concentration-response relationship, directly addressing inhibitor interference by identifying compounds with undesirable activity profiles [58].
Orthogonal Assays for Confirmation
To confirm the activity of hits identified in primary screens, orthogonal assays that utilize a different detection mechanism are essential.
- Protocol: Orthogonal Assay Using Enzyme Cascades
- Primary Screen: Conduct initial activity screening using a direct or coupled colorimetric method (e.g., detection of NADH accumulation at 340 nm) [59].
- Secondary Validation: For hits from the primary screen, reformat and re-test using a coupled assay with a fluorescent readout.
- Example Configuration: Couple the target enzyme's activity to a secondary enzyme like horseradish peroxidase (HRP), which converts a fluorogenic substrate (e.g., Amplex UltraRed) into a fluorescent product [59].
- Hit Confirmation: Only variants that show consistent activity across both the colorimetric and fluorescent assay formats are considered validated. Discrepancies suggest assay-specific interference.
Table 1: Summary of Key Quantitative HTS Parameters
| Parameter | Description | Utility in Identifying Interference |
|---|---|---|
| Curve Class | Classification of concentration-response curves (Class 1-4) | Identifies partial, weak, or supra-maximal effects suggestive of interference [58] |
| AC₅₀/IC₅₀ | Potency of activator/inhibitor | Large shifts between assay formats indicate potential interference |
| Efficacy | Maximum response magnitude | Low efficacy may suggest non-specific inhibition or poor solubility |
| Z' Factor | Statistical measure of assay quality (Z' > 0.5 is desirable) | Low Z' can indicate contamination or high variability [58] |
Mitigation and Preemptive Protocols
High-Throughput Protein Purification
A primary source of contamination and interference is crude cell lysate, which contains cellular debris, nucleic acids, and endogenous metabolites. Purifying enzyme variants before screening mitigates this.
- Protocol: Low-Cost, Robot-Assisted Protein Purification
- Construct Design: Clone enzyme variants into an expression vector with an N-terminal fusion tag (e.g., His-tag and SUMO tag) for affinity purification and protease-based elution [10].
- Small-Scale Expression: Express proteins in E. coli cultured in 24-deep-well plates containing 2 mL of autoinduction media to standardize culture density without manual monitoring [10].
- Automated Purification: Using a liquid-handling robot (e.g., Opentrons OT-2):
- Cell Lysis: Transfer culture to a 96-well plate and lyse cells chemically or enzymatically.
- Affinity Capture: Add Ni-charged magnetic beads to bind His-tagged proteins.
- Washing: Perform wash steps to remove contaminants.
- Tag Cleavage: Incubate beads with SUMO protease to release the pure, untagged enzyme. This avoids high-concentration imidazole in eluates, which can interfere with downstream assays [10].
- Quality Control: Analyze a subset of purified proteins via SDS-PAGE to confirm purity and yield.
This protocol enables the parallel purification of hundreds of enzyme variants weekly, providing clean protein samples that drastically reduce background interference [10].
Computational Pre-Screening
Molecular simulation can serve as a virtual screen to prioritize variants and identify potential inhibitor interactions in silico before physical testing.
- Protocol: Virtual Screening for Bioactive Peptides/Enzyme Variants
- Structure Preparation: Obtain or generate 3D structures of enzyme variants and target receptors/inhibitors.
- Molecular Docking: Perform high-throughput virtual docking to predict binding affinities and interaction modes between enzyme variants and potential inhibitors or substrates [60].
- Filtering: Use docking scores to triage virtual libraries, selecting only the most promising candidates for experimental screening. This reduces the experimental burden and focuses resources on variants less likely to suffer from interference [60].
Diagram 1: Integrated strategy for mitigating interference in HTS.
Advanced Compartmentalization Techniques
Microfluidic technologies physically isolate reactions, preventing cross-contamination and enabling single-cell analysis.
- Protocol: Droplet-Based Microfluidic Screening
- Droplet Generation: Use a microfluidic device to encapsulate single cells (each expressing a unique enzyme variant), a substrate, and a fluorescence reporter system into water-in-oil droplets (picolitre-nanoliter volume) [59] [61].
- Incubation: Incubate the emulsion library to allow enzymatic reactions to proceed within the isolated droplets.
- Detection and Sorting: Analyze droplets in a flow cytometer or microfluidic sorter. Sort droplets based on a fluorescent signal indicating desired activity [59] [61].
- Hit Recovery: Break sorted droplets to recover the cells or DNA of active variants for further analysis.
This method eliminates cross-well contamination and reduces background interference by confining the reaction to an ultra-small volume [61].
The Scientist's Toolkit: Research Reagent Solutions
Table 2: Essential Reagents and Materials for Mitigating Interference
| Reagent/Material | Function | Justification |
|---|---|---|
| His-SUMO Tag Vector | Affinity purification and tag-free elution | Enables high-throughput purification; SUMO protease cleavage avoids imidazole, a common assay interferent [10] |
| Magnetic Ni-Charged Beads | Immobilized metal affinity chromatography | Facilitates automated purification in 96-well format with minimal handling [10] |
| SUMO Protease | Specific cleavage of SUMO fusion tag | Provides a clean method for eluting purified enzyme, maintaining protein stability and function [10] |
| Coupled Enzyme Systems | Signal amplification for detection | Converts undetectable products into measurable outputs; use of multiple systems for orthogonal validation [59] |
| Fluorogenic Substrates | Sensitive, low-interference detection | Higher sensitivity than colorimetric assays; reduces compound interference from colored or UV-absorbing molecules [59] |
| Microfluidic Droplet Generators | Reaction compartmentalization | Isolates single enzyme variants and reactions, preventing cross-contamination [61] |
| qHTS Compound Libraries | Concentration-response profiling | Pre-plated libraries with titration series enable immediate assessment of compound behavior and artifact identification [58] |
Diagram 2: Decision pathway for diagnosing and correcting common interference issues.
Functional Validation Frameworks and Comparative Methodology Assessment
In high-throughput screening (HTS) of enzyme variants, establishing robust validation parameters is fundamental to transforming raw data into reliable biological insights. The core challenge lies in distinguishing true enzymatic activity from background noise, systematic biases, and random experimental error inherent in large-scale screening platforms. Precision medicine and efficient biocatalyst development both rely on the accurate functional assessment of genetic variants and engineered enzymes, a process requiring meticulous statistical design [62]. The emergence of quantitative HTS (qHTS), which performs multiple-concentration experiments, further amplifies the need for rigorous validation parameters to ensure the reliability of resulting concentration-response profiles [7]. This document outlines detailed protocols and application notes for instituting these critical parameters—encompassing experimental replicates, controls, and statistical thresholds—within the broader context of a research thesis on enzyme variant screening.
Statistical Foundation: Key Concepts and Parameters
The Basis of Statistical Decision-Making
In HTS, statistical thresholds are used to control error rates and optimize the power to detect true hits. A key modern framework involves false discovery rate (FDR) control, which manages the expected proportion of false positives among all declared hits. A two-stage procedural design can determine the optimal number of replicates at different screening stages while simultaneously controlling the FDR, significantly improving detection power within a constrained budget [63].
The Z' factor is a critical metric for assessing assay quality and suitability for HTS. It evaluates the separation between the positive and negative control distributions, accounting for both the dynamic range and the data variation associated with the controls [64].
Understanding Variability with the Distribution of Standard Deviations (DSD)
The Distribution of Standard Deviations (DSD) provides a powerful framework for understanding variability in large HTS data sets where many compounds are replicated a small number of times. The DSD's shape depends only on the number of replicates (N) and can identify sub-populations of compounds exhibiting high variability that may be difficult to screen. This approach helps model HTS data as two distributions: a large group of nearly normally distributed "inactive" compounds and a residual distribution of "active" compounds [64].
Table 1: Key Statistical Parameters for HTS Validation
| Parameter | Formula/Description | Application | Optimal Range/Value | ||
|---|---|---|---|---|---|
| False Discovery Rate (FDR) | Expected proportion of false positives among declared hits | Controlling Type I errors in large-scale screens; used in optimal two-stage design [63] | Typically < 5% or < 10% depending on screening goals | ||
| Z' Factor | ( Z' = 1 - \frac{3(\sigmap + \sigman)}{ | \mup - \mun | } ) where ( \sigma ) = standard deviation, ( \mu ) = mean, p = positive control, n = negative control [64] | Assessing assay quality and separation power | > 0.5 indicates an excellent assay |
| Distribution of Standard Deviations (DSD) | ( {s}{dist}({s}{p})=2\frac{{(\frac{N}{2{\sigma }^{2}})}^{\frac{N-1}{2}}}{{\rm{\Gamma }}(\frac{1}{2}(N-1))}\,{e}^{-\frac{N{s}{p}^{2}}{2{\sigma }^{2}}}{s}{p}^{N-2} ) [64] | Understanding expected variability and identifying high-variance compounds | Shape depends on number of replicates (N); used to identify outliers |
Experimental Design for Robust HTS
Replicate Strategy and Optimal Design
The number of experimental replicates is a cornerstone of robust HTS, directly impacting the precision of parameter estimation and hit identification. In quantitative HTS, parameter estimates from nonlinear models like the Hill equation can show poor repeatability without sufficient replication, sometimes spanning several orders of magnitude [7]. Studies demonstrate that increasing replicate number from 1 to 5 significantly narrows the confidence intervals for key parameters like AC₅₀ and Eₘₐₓ, enhancing the reliability of potency and efficacy estimates [7].
A strategic approach involves two-stage optimal design, which efficiently allocates resources. An initial primary screen tests all compounds or enzyme variants with a minimal number of replicates (often n=1 or 2). A subsequent confirmatory stage then retests only the most promising hits from the first stage with a larger number of replicates. This procedure optimally determines the number of replicates at each stage to control the FDR while respecting the total budget [63].
Plate Design and Bias Control
Effective plate design is critical for managing spatial biases and systematic errors. Robust data preprocessing methods are required to reduce unwanted variation by removing row, column, and plate biases. Techniques such as the trimmed-mean polish method have demonstrated superior performance in conjunction with formal statistical models to benchmark putative hits relative to what is expected by chance [65]. The inclusion of control wells distributed throughout the plates is essential for this normalization.
Practical Protocols for HTS Validation
Protocol 1: Implementing a Two-Stage FDR-Controlled Screen
This protocol is designed to maximize hit detection power while controlling false positives under a fixed budget [63].
Primary Screening Stage:
- Throughput: Screen the entire enzyme variant library.
- Replicates: Use a minimal number of replicates (e.g., n=1 or n=2).
- Hit Selection: Apply an initial statistical threshold (e.g., a moderated Z-score or a percentage of control activity) to select a subset of candidate hits for confirmation.
Confirmatory Screening Stage:
- Throughput: Re-test only the candidate hits identified in Stage 1.
- Replicates: Use a higher number of replicates (e.g., n=3 to n=5), as determined by optimal design calculations that control the FDR (e.g., at 5%) subject to the total budget.
- Data Analysis: Re-evaluate activity using the confirmatory data. Apply a final statistical model (e.g., an RVM t-test) to declare confirmed hits [65].
Protocol 2: Quantitative HTS (qHTS) and Curve Fitting Analysis
This protocol is for screens generating concentration-response data for enzyme variants [7].
Experimental Setup:
- Test each enzyme variant across a range of substrate or reactant concentrations (e.g., 8-15 points in a serial dilution).
- Include a minimum of n=3 technical replicates at each concentration to estimate variability.
- Ensure the concentration range is sufficient to define both the lower and upper asymptotes of the response curve where possible.
Data Preprocessing:
- Apply plate normalization using control wells (e.g., positive/negative controls) to remove row, column, and plate biases [65].
- Average the replicate values at each concentration.
Nonlinear Regression:
- Fit the normalized data to the Hill equation (Logistic form): ( Ri = E0 + \frac{(E{\infty} - E0)}{1 + \exp{-h[\log Ci - \log AC{50}]}} ) where ( Ri ) is the response at concentration ( Ci ), ( E0 ) is the baseline response, ( E{\infty} ) is the maximal response, ( h ) is the Hill slope, and ( AC_{50} ) is the concentration for half-maximal response [7].
- Use the estimated parameters (AC₅₀ and Eₘₐₓ) to rank variants by potency and efficacy.
Quality Control:
- Assess the reliability of the curve fits. Be aware that fits are less reliable if the concentration range fails to capture at least one of the asymptotes.
- Flag and visually inspect plots for variants showing poor model fit, non-monotonic behavior, or high variability.
The following workflow diagram illustrates the key stages of a robust HTS campaign for enzyme variants, integrating both single-point and multi-concentration approaches:
Figure 1: Two-stage HTS workflow with qHTS confirmation. This integrated approach efficiently identifies and validates active enzyme variants.
The Scientist's Toolkit: Essential Research Reagents and Materials
Table 2: Key Research Reagent Solutions for Enzyme Variant HTS
| Reagent/Material | Function and Application in HTS |
|---|---|
| Positive Control | An enzyme variant with known high activity. Used for normalizing plate data, calculating Z' factor, and defining the upper asymptote (Eₘₐₓ) in concentration-response curves [7] [64]. |
| Negative Control | A blank (no enzyme) or a catalytically dead mutant. Defines the baseline response (E₀), used for normalization and Z' factor calculation [7] [64]. |
| Reference Inhibitor/Activator | A known modulator of the enzyme class. Serves as an additional control for assay functionality and can be used to validate the screening assay's sensitivity. |
| Concentration-Response Series | A dilution series of the substrate or key reactant. Essential for qHTS to generate sigmoidal curves for estimating AC₅₀ and Eₘₐₓ parameters, providing a quantitative assessment of variant activity [7]. |
| Fluorogenic/Chromogenic Substrate | A substrate that produces a detectable signal upon enzymatic conversion. Enables high-sensitivity, real-time monitoring of enzyme activity in high-density plate formats (e.g., 1536-well plates) [7]. |
Data Analysis and Hit Confirmation Workflow
Data Preprocessing and Normalization
Raw data must be preprocessed to remove systematic bias before any hit identification. Apply a robust normalization algorithm, such as the trimmed-mean polish, to subtract row, column, and plate-level effects [65]. This step is crucial for minimizing false positives arising from spatial artifacts rather than true biological activity.
Hit Identification and Confidence Assessment
For single-concentration screens, use the RVM t-test after robust preprocessing, which has been shown to provide superior power in identifying true hits [65]. For qHTS data, the hit confirmation workflow involves:
- Curve Classification: Categorize concentration-response profiles based on curve quality and efficacy.
- Parameter Estimation: Extract AC₅₀ and Eₘₐₓ from high-quality fits. Acknowledge the high uncertainty in AC₅₀ when asymptotes are not well-defined [7].
- FDR Control: Apply false discovery rate control to the final list of active variants to estimate and manage the proportion of false positives [63].
Table 3: Protocol for Hit Confirmation from qHTS Data
| Step | Action | Tool/Method | Goal |
|---|---|---|---|
| 1. Preprocessing | Normalize plate data using controls | Trimmed-mean polish [65] | Remove spatial and technical biases |
| 2. Curve Fitting | Fit normalized data to Hill model | Nonlinear regression [7] | Estimate AC₅₀, Eₘₐₓ, and curve shape |
| 3. Quality Filtering | Flag poor fits and irregular curves | Visual inspection & goodness-of-fit metrics (e.g., R²) | Exclude unreliable data points |
| 4. Hit Calling | Apply thresholds to parameters | FDR control on Eₘₐₓ and AC₅₀ [63] | Generate a list of confident hits |
Comparative Analysis of Machine Learning Models for Variant Effect Prediction
Variant effect prediction (VEP) is a cornerstone of modern genomics and enzyme engineering, crucial for interpreting the vast number of genetic variants discovered through sequencing and for engineering improved enzymes in high-throughput screening campaigns. The primary challenge lies in accurately distinguishing functional, deleterious mutations from neutral ones within immense sequence spaces. Machine learning (ML) has emerged as a transformative tool for this task, with models ranging from convolutional neural networks (CNNs) to large protein language models demonstrating significant utility. This application note provides a comparative analysis of state-of-the-art ML models for VEP, framed within the context of high-throughput screening of enzyme variants. It offers structured performance data, detailed experimental protocols for validation, and practical guidance for researchers and drug development professionals to select and implement the most appropriate models for their specific protein engineering goals.
Model Architectures and Performance Comparison
ML models for VEP can be broadly categorized by their underlying architecture and training paradigm. Each class possesses distinct strengths and mechanistic rationales for predicting the functional consequences of amino acid substitutions.
- Convolutional Neural Networks (CNNs): Models such as DeepSEA and TREDNet excel at learning hierarchical representations of protein sequences. Their early layers detect local features like short motifs or k-mers, while deeper layers integrate these into higher-order regulatory or functional signals. This makes them particularly robust for identifying variants that disrupt local structural elements or transcription factor binding sites [66].
- Transformer-Based Protein Language Models: Models like ESM1b and ESM-2 are deep neural networks trained on millions of diverse protein sequences from databases such as UniProt. They learn the underlying "grammar" and "syntax" of protein sequences, allowing them to predict the likelihood of any given amino acid sequence without explicit homology modeling. They have been shown to implicitly learn aspects of protein structure and function, including residue-residue interactions and functional sites [67] [21].
- Hybrid CNN-Transformer Models: Architectures such as Borzoi combine the strengths of CNNs in capturing local motif-level features with the Transformer's ability to model long-range dependencies across the sequence. This hybrid approach has proven superior for tasks like causal variant prioritization within linkage disequilibrium blocks [66].
- Generative Adversarial Networks (GANs): ProteinGAN is an example of a generative model that learns the distribution of natural protein sequences. It can sample novel, functional sequences from this learned distribution, which is valuable for exploring new regions of sequence space during enzyme engineering [5].
- Ancestral Sequence Reconstruction (ASR): A phylogeny-based statistical method that infers ancestral sequences. While not a neural network, ASR is a powerful computational tool that often generates stable, functional enzyme variants, effectively resurrecting historical sequences that can serve as excellent starting points for engineering [5].
Quantitative Performance Benchmarking
Model performance varies significantly depending on the specific task, such as classifying clinical pathogenicity versus predicting quantitative functional changes from deep mutational scans (DMS). The following tables summarize key benchmarking results to guide model selection.
Table 1: Performance in Classifying ClinVar/HGMD Pathogenic vs. gnomAD Benign Missense Variants
| Model | Architecture | ROC-AUC (ClinVar) | ROC-AUC (HGMD/gnomAD) | Key Strengths |
|---|---|---|---|---|
| ESM1b | Protein Language Model | 0.905 | 0.897 | Genome-wide coverage; outperforms 45 other methods [67] |
| EVE | Unsupervised Generative (VAE) | 0.885 | 0.882 | Robust, MSA-based evolutionary analysis [67] |
| CNN models (e.g., TREDNet) | Convolutional Neural Network | - | - | Superior for regulatory variant detection in enhancers [66] |
| Hybrid CNN-Transformer (e.g., Borzoi) | Hybrid | - | - | Best for causal SNP prioritization in LD blocks [66] |
Table 2: Experimental Success Rates in Generating Functional Enzymes (Malate Dehydrogenase & Copper Superoxide Dismutase)
| Model | Experimental Success Rate (Active Enzymes) | Key Limitations / Notes |
|---|---|---|
| Ancestral Sequence Reconstruction (ASR) | ~50-55% (9/18 for CuSOD, 10/18 for MDH) [5] | High success rate; often generates stabilized variants |
| Protein Language Model (ESM-MSA) | 0% for CuSOD and MDH in initial round [5] | Performance highly dependent on proper sequence truncation and quality checks |
| Generative Adversarial Network (ProteinGAN) | 0% for MDH, ~11% for CuSOD (2/18) in initial round [5] | May require careful filtering and multiple design rounds |
| Natural Test Sequences | ~19% overall (including all models) [5] | Baseline for comparison |
Experimental Protocols for Model Validation and Application
Protocol: High-Throughput Validation of Computationally Generated Enzyme Variants
This protocol outlines the process for experimentally testing the functional activity of enzyme variants generated by ML models, as used in recent large-scale evaluations [5].
1. Library Design and Curation
- Input: Generate sequences using your selected model(s) (e.g., ESM-MSA, ProteinGAN, ASR).
- Filtering: Apply the COMPSS (Composite Metrics for Protein Sequence Selection) framework or similar criteria. Key metrics include:
- Alignment-based: Sequence identity to closest natural homologue (e.g., 70-90%).
- Alignment-free: Likelihood scores from protein language models (e.g., ESM-2).
- Structure-based: Predicted confidence scores from AlphaFold2 or Rosetta.
- Output: A curated list of 150-200 diverse variants for synthesis.
2. DNA Synthesis and Plasmid Construction
- Gene Synthesis: Synthesize the selected variant genes with codons optimized for the expression host (e.g., E. coli).
- Cloning: Clone genes into an appropriate expression vector (e.g., pET series with T7 promoter) using high-fidelity assembly methods like HiFi assembly to minimize errors.
- Transformation: Transform the constructed plasmids into a competent expression strain (e.g., E. coli BL21(DE3)).
3. Protein Expression and Purification
- Cultivation: Grow cultures in 96-deep-well plates in auto-induction media.
- Expression: Induce protein expression with IPTG and incubate with shaking.
- Lysis: Lyse cells chemically or enzymatically. Centrifuge to clarify lysates.
- Purification: Use automated systems (e.g., biofoundry robotics) for affinity purification (e.g., His-tag purification) in 96-well format.
4. High-Throughput Activity Assay
- Assay Principle: Use a spectrophotometric or fluorometric assay compatible with microtiter plates.
- Procedure: a. In a 96-well plate, add purified enzyme variants in buffer. b. Initiate the reaction by adding the substrate. c. Continuously monitor the change in absorbance or fluorescence using a plate reader. d. Include positive (wild-type enzyme) and negative (no enzyme, empty vector control) controls on every plate.
- Analysis: Calculate initial reaction velocities. Normalize activities to the positive control. A variant is considered "experimentally successful" if its activity is statistically significantly above the negative control background.
Protocol: Autonomous ML-Guided Enzyme Engineering on a Biofoundry
This advanced protocol describes a closed-loop, autonomous workflow that integrates ML with robotic automation for iterative enzyme engineering [21].
1. Initial Library Design
- Input: Wild-type protein sequence and a quantifiable fitness objective (e.g., specific activity, thermostability).
- Unsupervised Model Combination: Use a combination of a protein LLM (e.g., ESM-2) and an epistasis model (e.g., EVmutation) to generate a diverse and high-quality initial library of ~180 variants.
2. Automated DBTL Cycle (Executed on iBioFAB or equivalent biofoundry)
- DESIGN: The ML agent selects the next set of variants (e.g., 50-100) based on the previous round's assay data, using a "low-N" machine learning model to predict fitness from a small dataset.
- BUILD: a. Mutagenesis PCR: Perform site-directed mutagenesis using an optimized high-fidelity PCR assembly method (95% accuracy). b. DpnI Digestion: Digest the methylated parental DNA template. c. Transformation: Perform high-throughput transformation in 96-well format.
- TEST: a. Colony Picking: Robotically pick colonies and inoculate expression cultures. b. Protein Expression & Lysis: Induce expression and prepare crude cell lysates. c. Enzyme Assay: Perform a robotic, high-throughput functional assay (e.g., methyltransferase or phytase activity assay, as applicable).
- LEARN: The assay data is automatically fed back to the ML model, which retrains and proposes the designs for the next cycle. This loop typically runs for 3-4 rounds.
Visualization of Workflows
Autonomous Enzyme Engineering Workflow
Experimental Validation Pipeline
The Scientist's Toolkit: Essential Research Reagents and Platforms
Table 3: Key Resources for AI-Powered Enzyme Engineering
| Resource Category | Specific Tool / Platform | Function / Application |
|---|---|---|
| Protein Language Models | ESM1b, ESM-2, ESM-MSA | Unsupervised variant effect scoring and novel sequence generation [67] [21] [5] |
| Biofoundry Automation | Illinois Biological Foundry (iBioFAB) | Integrated robotic platform for fully automated DBTL cycles [21] |
| Epistasis Models | EVmutation | Models residue-residue co-evolution to inform mutation selection [21] |
| High-Throughput Assays | Microtiter Plates (96-/384-well), FACS, IVTC | Enables rapid functional screening of thousands of variants [2] |
| Composite Metric Framework | COMPSS | Computational filter combining multiple metrics to prioritize functional sequences [5] |
| Model Benchmarking Portal | ESM Variants Web Portal | Query, visualize, and download missense predictions for human protein isoforms [67] |
Within clinical genetics, the accurate classification of sequence variants as pathogenic or benign is fundamental for diagnosis and treatment. The 2015 American College of Medical Genetics and Genomics and the Association for Molecular Pathology (ACMG/AMP) guidelines established a standardized framework for variant interpretation, which includes functional data as a key type of evidence [68]. Specifically, the PS3 code supports pathogenicity based on "well-established" functional assays demonstrating deleterious effects, while the BS3 code supports benignity based on functional evidence showing no detrimental effect [69] [68]. However, the original guidelines provided limited detail on how to determine if an assay is "well-established," leading to inconsistencies in application between laboratories and expert groups [70] [69].
The Clinical Genome Resource (ClinGen) consortium has undertaken the critical task of refining these criteria. Through its Sequence Variant Interpretation (SVI) Working Group and Variant Curation Expert Panels (VCEPs), ClinGen has developed a more structured framework for evaluating functional assays, ensuring their proper use in clinical variant classification [71] [69]. This document outlines these refined standards and provides practical protocols for their implementation, contextualized within modern high-throughput research paradigms.
ClinGen's Framework for Functional Evidence Evaluation
The Four-Step Provisional Framework
The ClinGen SVI Working Group recommends a structured, four-step process for evaluators to determine the clinical validity of functional data and the appropriate strength of evidence [69].
Step 1: Define the Disease Mechanism
- Objective: Establish the molecular basis of the disease (e.g., loss-of-function, gain-of-function, dominant negative) and the relevant functional pathways.
- Protocol: Utilize resources such as the Monarch Disease Ontology (MONDO) for disease phenotypes and Gene Ontology (GO) terms for functional pathways. This foundational step ensures the assay is biologically relevant to the gene-disease pair [68].
Step 2: Evaluate Applicability of General Assay Classes
- Objective: Determine which broad categories of assays (e.g., biochemical activity, protein interaction, cell-based growth assays) are capable of measuring the biological function disrupted in the disease.
- Protocol: VCEPs specify approved classes of assays using ontology terms from the Bioassay Ontology (BAO) and Evidence and Conclusion Ontology (ECO). For example, a loss-of-function disease might be appropriately tested by an assay measuring enzymatic activity or protein expression [68].
Step 3: Evaluate Validity of Specific Assay Instances
- Objective: Assess whether a specific, published implementation of an assay class is sufficiently robust and well-validated to be used as evidence.
- Protocol: Curate the specific assay instance from the primary literature. This involves a detailed examination of key validation parameters, as outlined in Table 1.
Step 4: Apply Evidence to Individual Variant Interpretation
- Objective: Based on the data from the validated assay, apply the PS3 or BS3 criterion at the appropriate evidence strength (Supporting, Moderate, Strong, or Stand-Alone).
- Protocol: The strength is determined by the assay's validation status and the quality of the experimental data for the specific variant. The SVI Working Group has quantified that a minimum of eleven total pathogenic and benign variant controls are required to reach a Moderate level of evidence in the absence of rigorous statistical analysis [69].
Key Validation Parameters for Assay Instances
A comparative analysis of multiple VCEPs revealed that while the specific assays approved vary by disease, the core parameters for validating any assay instance are consistent [70] [68]. The following table summarizes these critical parameters and how they are assessed.
Table 1: Key Validation Parameters for Functional Assay Instances
| Parameter | Description | VCEP Assessment Criteria |
|---|---|---|
| Controls | Use of appropriate positive (pathogenic) and negative (benign) control variants to calibrate the assay. | Considered the most critical parameter. Requires a range of controls to establish a clear normal vs. abnormal result range. |
| Replicates | The number of independent experimental repetitions performed. | Specified by most VCEPs to ensure result reliability and reproducibility. |
| Thresholds | Pre-defined cut-off values that distinguish between a normal and abnormal functional result. | Must be established and justified using data from control variants. |
| Validation Measures | Statistical or other analytical methods used to demonstrate the assay's predictive power. | Includes measures like statistical significance (p-values) and predictive accuracy for known variants. |
Variability and Specifications Across Expert Panels
Different VCEPs develop gene- or disease-specific specifications for the ACMG/AMP criteria, leading to a tailored list of approved assays. An analysis of six VCEPs (CDH1, Hearing Loss, Inherited Cardiomyopathy-MYH7, PAH, PTEN, RASopathy) highlighted this diversity [70] [68].
- Approved Assays: The number of approved assays per VCEP ranged from one to seven, reflecting the specific disease mechanisms.
- Assay Specificity: Specifications varied from highly detailed assays (e.g., evaluating the myristoylation status of a single residue for the RASopathy VCEP) to broader categories (e.g., any mammalian variant-specific knock-in model for the Inherited Cardiomyopathy VCEP) [68].
- Strength Modification: VCEPs also provide guidance on downgrading the default Strong evidence level to Moderate or Supporting based on limitations in the assay's validation or the quality of the data for a specific variant [72] [70].
This variability underscores the importance of consulting the specific specifications developed by the relevant VCEP when interpreting variants for a particular gene or disease.
Integrated Protocols for High-Throughput Functional Validation
The following protocol demonstrates how modern, automated enzyme screening workflows can be adapted to generate functional data that meets ClinGen's rigorous standards for clinical variant interpretation.
Automated, High-Throughput Enzyme Expression and Purification
This protocol is adapted from low-cost, robot-assisted pipelines for high-throughput protein purification, which are essential for characterizing large numbers of variants [10].
- Objective: To express and purify hundreds of enzyme variants in parallel for subsequent functional characterization.
- Principle: Use of a liquid-handling robot (e.g., Opentrons OT-2) to automate miniaturized cell culture, lysis, and affinity purification in a 96-well plate format.
- Materials and Reagents:
- Plasmid Construct: pCDB179 or similar vector with an N-terminal His-tag and SUMO (Smt3) fusion tag for purification and scarless cleavage [10].
- E. coli Strain: Chemically competent cells (e.g., E. coli BL21(DE3)).
- Transformation Kit: Zymo Mix & Go! E. coli Transformation Kit or equivalent.
- Culture Media: LB broth supplemented with appropriate antibiotic. Autoinduction media can be used to bypass the need for manual induction.
- Lysis and Purification Buffers:
- Lysis Buffer: 50 mM Tris-HCl, pH 8.0, 300 mM NaCl, 10 mM Imidazole, 1 mg/mL Lysozyme.
- Wash Buffer: 50 mM Tris-HCl, pH 8.0, 300 mM NaCl, 25 mM Imidazole.
- Elution (Cleavage) Buffer: 50 mM Tris-HCl, pH 8.0, 150 mM NaCl, 1 mM DTT (for on-bead cleavage).
- Ni-charged Magnetic Beads: For immobilized metal affinity chromatography (IMAC).
- SUMO Protease (or other relevant tag-specific protease): For cleaving the fusion tag to release the pure target protein.
- Procedure:
- Transformation: Dispense competent cells into a 96-well PCR plate. Add plasmid DNA (10-50 ng) using the liquid handler. Incubate on ice, heat-shock if required, and then add outgrowth media. After outgrowth, add antibiotic and transfer the culture to a 96-deep well plate. Grow for ~40 hours at 30°C to saturation [10].
- Protein Expression: Use the robot to inoculate expression media in a 24-deep well plate with the saturated starter culture. Incubate with shaking at 37°C until the optimal density is reached, then induce with IPTG or use autoinduction. Continue incubation for a further 4-16 hours at a suitable temperature (e.g., 18-25°C for better solubility of difficult proteins).
- Cell Lysis and Purification:
- Harvesting: Centrifuge the deep-well plate to pellet cells.
- Lysis: Resuspend cell pellets in Lysis Buffer. Incubate to facilitate cell lysis.
- Clarification: Centrifuge the plate to remove cell debris.
- Binding: Transfer clarified lysates to a new plate containing Ni-charged magnetic beads. Incubate with mixing to allow binding of the His-tagged protein.
- Washing: Use a magnetic plate to immobilize the beads. Remove the supernatant and wash the beads multiple times with Wash Buffer.
- Tag Cleavage (Elution): Resuspend the beads in Cleavage Buffer and add the SUMO protease. Incubate to allow cleavage. Use the magnetic plate to separate the beads (with the His-SUMO tag bound) from the supernatant containing the purified, untagged enzyme.
- Quality Control: Analyze a subset of purified variants by SDS-PAGE and spectrophotometry to confirm purity and concentration.
Functional Characterization for PS3/BS3 Application
This protocol outlines a generic enzyme activity assay that can be adapted to measure the specific biochemical function relevant to the gene-disease pair.
- Objective: To quantitatively measure the catalytic activity of purified enzyme variants and classify them as functional (supporting benign evidence, BS3) or non-functional (supporting pathogenic evidence, PS3).
- Principle: The enzyme is incubated with its substrate under defined conditions, and the formation of product (or consumption of substrate) is measured over time using a spectrophotometer, fluorimeter, or mass spectrometer.
- Materials and Reagents:
- Purified Enzyme Variants: From Protocol 3.1.
- Assay Buffer: Appropriate for the enzyme's native environment (e.g., specific pH, salt concentration, cofactors).
- Substrate: The natural or highly relevant substrate for the enzyme.
- Positive Control: Purified wild-type enzyme.
- Negative Controls:
- Benign Controls: Known benign variants (e.g., synonymous variants or known benign missense variants with confirmed normal function).
- Pathogenic Controls: Known pathogenic loss-of-function variants.
- No-Enzyme Control: Assay buffer without enzyme to account for non-enzymatic substrate conversion.
- Procedure:
- Assay Development and Validation:
- Establish a linear range for the assay by varying enzyme concentration and time.
- Determine the kinetic parameters (Km, Vmax) for the wild-type enzyme.
- Using the positive and negative controls, define a clear activity threshold that distinguishes normal function from abnormal function. This is a critical requirement for VCEPs [68].
- High-Throughput Activity Screening:
- In a 96-well or 384-well assay plate, dispense Assay Buffer and substrate using the liquid handler.
- Initiate the reaction by adding a standardized amount of each purified enzyme variant (wild-type, controls, and unknowns) in triplicate.
- Monitor the reaction in real-time using a plate reader or quench the reaction at a specific time point for endpoint measurement.
- Data Analysis:
- Calculate the enzymatic activity for each variant, normalized to the wild-type control set at 100%.
- Apply the pre-defined activity threshold. Variants with activity statistically indistinguishable from wild-type (e.g., 85-115%) support a BS3 classification. Variants with activity statistically indistinguishable from pathogenic controls (e.g., <20%) support a PS3 classification.
- The strength of evidence (Supporting, Moderate, Strong) is determined by the number of independent replicates and, crucially, the number and quality of control variants used to validate the assay, as per ClinGen recommendations [69].
- Assay Development and Validation:
Integration with AI-Powered Enzyme Engineering Workflows
Modern enzyme engineering increasingly relies on autonomous platforms that integrate machine learning (ML) and large language models (LLMs) with biofoundry automation [21]. The functional data generated using the above protocols is the critical "test" component in a Design-Build-Test-Learn (DBTL) cycle.
- AI-Driven Design: Protein LLMs (e.g., ESM-2) and epistasis models (e.g., EVmutation) are used to predict fitness and design diverse, high-quality variant libraries for initial testing [21].
- Automated Build and Test: The protocols in Section 3 are executed on automated biofoundries (e.g., the Illinois Biological Foundry for Advanced Biomanufacturing, iBioFAB) to construct and characterize the designed variants [21] [10].
- Learning for the Next Cycle: The functional assay data (fitness scores) from each round is used to retrain the ML model, which then proposes a new set of variants for the next DBTL cycle, efficiently navigating the vast sequence space toward improved enzyme function [21].
This closed-loop, data-driven approach can rapidly generate a wealth of functional data on thousands of variants. When calibrated with appropriate pathogenic and benign controls, this high-throughput functional data can be leveraged for clinical variant classification, directly feeding into the ClinGen framework.
The Scientist's Toolkit: Research Reagent Solutions
Table 2: Essential Research Reagents for High-Throughput Functional Studies
| Item | Function | Example Product/Note |
|---|---|---|
| Liquid-Handling Robot | Automates liquid transfers for high-throughput, miniaturized assays in well plates. | Opentrons OT-2 (low-cost, open-source); Hamilton or Tecan systems (high-flexibility) [10]. |
| Ni-charged Magnetic Beads | Enable immobilization and purification of His-tagged proteins in a plate-based format. | Various commercial suppliers; compatible with magnetic plate separators. |
| Tag-Specific Protease | Enables scarless cleavage of the fusion tag from the purified protein, avoiding harsh elution conditions. | SUMO Protease, TEV Protease, or HRV 3C Protease. |
| Cell-Free Protein Synthesis System | Allows for rapid protein production without the need for live cells, useful for toxic proteins. | NEBExpress Cell-free E. coli Protein Synthesis System [73]. |
| High-Throughput Mass Spectrometry | For precise identification and quantification of enzyme activity and reaction products. | Enabled by streptavidin magnetic beads for sample preparation [73]. |
| Automated DNA Assembly Master Mix | For rapid and reliable construction of variant libraries. | NEBuilder HiFi DNA Assembly Master Mix or NEBridge Golden Gate Assembly [73]. |
Workflow and Relationship Diagrams
ClinGen Functional Assay Evaluation Workflow
AI-Powered DBTL Cycle for Enzyme Engineering
Quantitative Assessment of Assay Performance and Signal Variability
Within high-throughput screening (HTS) campaigns for enzyme engineering, the reliability of data generated by enzymatic assays is paramount. The discovery and development of small molecule inhibitors or enhanced enzyme variants rely on robust, cost-effective, and physiologically relevant in vitro assays that can support prolonged screening and optimization efforts [74]. A critical component of this process is the rigorous quantitative assessment of assay performance and signal variability, which ensures that the observed results truly reflect the biochemical properties of the tested compounds or enzyme variants, rather than systemic or random noise inherent to the experimental system. This document outlines detailed protocols and application notes for establishing such assessments, framed within the context of a high-throughput enzyme variant screening pipeline [59] [10].
Experimental Protocols
Protocol: Assay Development Workflow for HTS
This protocol describes a generalized workflow for developing, optimizing, and validating an enzymatic assay suitable for high-throughput screening of enzyme variants, culminating in the quantitative assessment of its performance [74].
Materials:
- Purified enzyme (e.g., a model enzyme like alkaline phosphatase).
- Enzyme substrate (e.g., DiFMUP, pNPP).
- Suitable assay buffer (e.g., DEA buffer for phosphatases).
- Low-volume microplates (e.g., 384-well or 1536-well plates).
- Liquid handling robot or automated pipetting system.
- Appropriate plate reader (e.g., fluorimeter or spectrophotometer).
- Positive control (known inhibitor or purified variant with altered activity).
- Negative control (no-enzyme control).
Procedure:
Initial Assay Optimization:
- Determine Kinetic Constants: Perform kinetic experiments to determine the Michaelis constant (K~M~) and maximal reaction velocity (V~max~) for your enzyme and substrate. Conduct assays under varying conditions of pH, temperature, and ionic strength to establish optimal buffer constituents and reaction conditions [74].
- Define Linear Range: Establish the linear range of the assay with respect to time and enzyme concentration. This ensures that initial velocity measurements are obtained during the HTS campaign.
Assay Miniaturization and Automation:
- Volume Reduction: Systematically reduce the assay volume from a standard scale (e.g., 100 µL) to the target HTS scale (e.g., 10-20 µL). At each step, compare the performance (signal, background, variability) to the larger scale assay [74].
- Automated Liquid Handling: Translate the assay protocol to an automated liquid handling system. Script the steps for reagent dispensing, compound/addition, and incubation. A low-cost robot like the Opentrons OT-2 can be employed for this purpose to increase throughput and reproducibility [10].
- Determine Reagent Stability: Assess the stability of all assay components (enzyme, substrate, controls) when stored on the automated system's deck for the duration of a full screening plate run.
Assay Validation and Quantitative Performance Assessment:
- Plate Setup: For validation runs, include both positive controls (e.g., enzyme with full activity) and negative controls (e.g., no enzyme, or enzyme with a known potent inhibitor) distributed across the entire microplate. This allows for the assessment of spatial uniformity and the calculation of performance metrics.
- Data Collection: Run the fully automated, miniaturized assay on multiple plates (n≥3) to collect robust statistical data.
- Performance Calculation: Calculate the following key parameters for each plate using the data from the positive and negative control wells [74]:
- Signal-to-Background Ratio (S/B): ( S/B = \frac{\mu{positive}}{\mu{negative}} )
- Signal-to-Noise Ratio (S/N): ( S/N = \frac{\mu{positive} - \mu{negative}}{\sqrt{\sigma{positive}^2 + \sigma{negative}^2}} )
- Coefficient of Variation (CV): ( CV = \frac{\sigma}{\mu} \times 100\% ) (Calculated for both positive and negative controls).
- Z'-Factor: ( Z' = 1 - \frac{3\sigma{positive} + 3\sigma{negative}}{|\mu{positive} - \mu{negative}|} )
- Interpretation: An assay with a Z'-factor value between 0.5 and 1.0 is considered excellent for HTS. A value between 0 and 0.5 may be marginal but usable, while a value below 0 indicates a non-functional assay [74].
Workflow Diagram: HTS Assay Validation
The following diagram illustrates the key stages in the development and validation of a robust assay for high-throughput screening.
Protocol: Quantitative Dose-Response Analysis
For hit confirmation and characterization from primary HTS, dose-response experiments are essential to determine the potency of inhibitors or the catalytic efficiency of enzyme variants [74].
Materials:
- Active compound(s) or purified enzyme variants identified from primary HTS.
- Serial dilution materials (e.g., automated liquid handler).
- The validated HTS assay system from Protocol 2.1.
Procedure:
- Compound/Enzyme Dilution: Prepare a serial dilution (e.g., 1:3 or 1:2 dilutions) of the test compound or a dilution series of the purified enzyme variant. A typical curve uses 8-12 data points. Use the same assay buffer for dilutions to maintain constant conditions.
- Assay Execution: Run the validated assay protocol (from Protocol 2.1) with the dilution series, including positive and negative controls on the same plate.
- Data Analysis:
- Plot the measured signal (e.g., fluorescence, absorbance) against the logarithm of the compound concentration or enzyme concentration.
- Fit the data to a four-parameter logistic model (4PL) to determine the IC~50~ (half-maximal inhibitory concentration) for an inhibitor or the apparent K~M~ and k~cat~ for a variant.
- The quality of the dose-response curve can be assessed by the goodness-of-fit (R²) and the confidence intervals of the fitted parameters.
The Scientist's Toolkit: Research Reagent Solutions
The following table details key reagents and materials essential for establishing a high-throughput enzymatic assay and its performance assessment [74] [10].
Table 1: Essential Research Reagents and Materials for HTS Assay Development
| Item | Function/Application in HTS | Example(s) |
|---|---|---|
| Detection Substrate | Enzyme substrate that generates a measurable signal (e.g., fluorescent, chromogenic) upon catalytic conversion. | DiFMUP (fluorogenic), pNPP (chromogenic) [74] |
| Affinity Purification Tag | Enables rapid, parallel purification of multiple enzyme variants from cell lysates for biochemical characterization. | His-tag, SUMO tag [10] |
| Liquid Handling Robot | Automates repetitive pipetting tasks, enabling miniaturization, increased throughput, and improved reproducibility. | Opentrons OT-2, Hamilton, Tecan systems [10] |
| Positive & Negative Controls | Essential for validating assay performance and calculating statistical parameters like Z'-factor. | Known potent inhibitor (control), no-enzyme control [74] |
| Low-Volume Microplates | The physical platform for miniaturized assays, allowing high-density screening and reagent conservation. | 384-well, 1536-well plates [74] |
| Specialized Assay Buffer | Provides optimal pH, ionic strength, and co-factors for enzyme activity; critical for assay robustness. | DEA buffer for phosphatases [74] |
Data Presentation: Quantitative Assessment Metrics
The following tables summarize the key quantitative parameters used to assess assay performance and signal variability, providing target values for HTS-compatible assays.
Table 2: Key Parameters for Quantitative Assay Assessment [74]
| Parameter | Formula | Interpretation & HTS Target | ||
|---|---|---|---|---|
| Z'-Factor | ( Z' = 1 - \frac{3\sigma{p} + 3\sigma{n}}{ | \mu{p} - \mu{n} | } ) | Excellent: 0.5 - 1.0Marginal: 0 - 0.5Unsuitable: < 0 |
| Signal-to-Background (S/B) | ( S/B = \frac{\mu{p}}{\mu{n}} ) | A high ratio is desirable. The acceptable value is assay-dependent, but often >3. | ||
| Signal-to-Noise (S/N) | ( S/N = \frac{\mu{p} - \mu{n}}{\sqrt{\sigma{p}^2 + \sigma{n}^2}} ) | A high ratio indicates a robust signal. The acceptable value is assay-dependent, but often >10. | ||
| Coefficient of Variation (CV) | ( CV = \frac{\sigma}{\mu} \times 100\% ) | Measures well-to-well variability. For HTS, CV for controls should typically be <10-15%. |
Table 3: Exemplary Data from a Validated Assay Performance Run
| Plate | Mean Signal (Positive) | Mean Signal (Negative) | SD (Positive) | SD (Negative) | Z'-Factor | S/B | CV (Positive) |
|---|---|---|---|---|---|---|---|
| 1 | 12,450 RFU | 850 RFU | 550 | 80 | 0.86 | 14.6 | 4.4% |
| 2 | 12,100 RFU | 820 RFU | 620 | 85 | 0.83 | 14.8 | 5.1% |
| 3 | 12,550 RFU | 880 RFU | 580 | 90 | 0.85 | 14.3 | 4.6% |
| Average | 12,367 RFU | 850 RFU | 583 RFU | 85 RFU | 0.85 | 14.6 | 4.7% |
Advanced Concepts: Signal Equalization in Multiplexed Assays
A frontier in biomarker and enzyme variant characterization is the simultaneous quantification of multiple analytes (multiplexing) present at vastly different concentrations. Traditional methods are constrained by a limited dynamic range (3-4 orders of magnitude), often requiring sample splitting and differential dilution, which introduces non-linear dilution effects and compromises reproducibility [75].
The EVROS (Equalization of Signal) strategy overcomes this by using two tuning mechanisms to individually adjust the signal output for each analyte, bringing signals from low and high-abundance targets into the same quantifiable range without physical dilution [75].
Diagram: EVROS Signal Equalization Strategy
The following diagram outlines the core principles of the EVROS methodology for extending dynamic range in multiplexed assays.
Probe Loading: Increasing the concentration of detection antibodies (probes) shifts the binding curve, enhancing the signal for low-abundance analytes due to a shift in equilibrium [75].
Epitope Depletion: Adding unlabeled "depletant" antibodies (from the same pool as the detection antibodies) competes for binding sites on high-abundance analytes. This reduces the probability of forming a detectable complex, thereby attenuating the signal from these analytes and preventing saturation [75].
Within high-throughput screening of enzyme variants, the selection of an initial screening methodology is a pivotal decision that profoundly influences the efficiency, cost, and ultimate success of a research campaign. For decades, Traditional High-Throughput Screening (HTS) has been the cornerstone of drug discovery and enzyme engineering, relying on the automated experimental testing of vast physical compound libraries. In contrast, Virtual Screening (VS) leverages computational power to prioritize compounds for synthesis and testing by predicting their interaction with a biological target. The evolution of artificial intelligence and the availability of synthesis-on-demand chemical libraries have dramatically expanded the scope and capabilities of virtual screening. This Application Note provides a structured comparison of these two paradigms, delivering detailed protocols and benchmark data to guide researchers in selecting and implementing the optimal strategy for their enzyme variant screening projects.
The following table summarizes the fundamental characteristics of Virtual Screening and Traditional HTS, highlighting their distinct advantages and challenges.
Table 1: Core Characteristics of Virtual Screening vs. Traditional HTS
| Feature | Virtual Screening (VS) | Traditional HTS |
|---|---|---|
| Fundamental Principle | Computational prediction of binding/activity [76] [77] | Experimental testing of physical compounds in an automated assay [78] |
| Theoretical Library Size | Ultra-large (billions to trillions), including make-on-demand compounds [77] [79] | Limited by physical collection size (typically thousands to millions) [79] |
| Primary Cost Driver | Computational resources (CPU/GPU time) [77] [79] | Reagents, compound libraries, and robotic equipment [10] [78] |
| Speed (Theoretical) | Days to screen billions of compounds [77] | Weeks to months to screen millions of compounds [78] |
| Key Requirement | Structural or ligand-based information about the target [76] [77] | A robust, miniaturizable, and automatable biochemical or cellular assay [10] |
| Typical Hit Rate | ~1-10% (highly variable) [76] [77] [79] | ~0.001-0.15% [79] |
| Key Advantage | Unlocks vast chemical space; no synthesis required for initial screen [79] | Empirically tests real compounds in a relevant assay format [10] |
| Key Limitation | Dependent on model accuracy and input data quality [77] | Limited to existing compound collections; prone to assay artifacts [79] |
Performance Benchmarking and Key Considerations
Quantitative performance metrics are critical for evaluating the success of a screening campaign. The table below consolidates key benchmarking data from recent literature.
Table 2: Performance Benchmarking and Practical Considerations
| Aspect | Virtual Screening (VS) | Traditional HTS |
|---|---|---|
| Reported Hit Rates | Internal portfolio: 6.7% DR hit rate; Academic collaborations: 7.6% hit rate [79]. Specific examples: 14% and 44% for targeted campaigns [77]. | Typically ranges from 0.001% to 0.15% [79]. |
| Chemical Scaffold Novelty | Capable of identifying novel, drug-like scaffolds distinct from known bioactive compounds [79]. | Often identifies known chemotypes or close analogs present in the screening library. |
| Automation & Throughput | AI-accelerated platforms can screen billions of compounds in under a week [77]. | Liquid-handling robots automate plate-based assays; throughput is physically constrained [10] [78]. |
| Assay Interference | Computationally selected compounds can still exhibit real-world assay interference, requiring experimental mitigation (e.g., Tween-20, DTT) [79]. | Inherently prone to false positives from aggregation, fluorescence, cytotoxicity, etc. [79]. |
| Target Applicability | Successful for targets without known binders or high-resolution structures (using homology models) [79]. | Requires a developable assay, which can be challenging for certain target classes (e.g., PPIs). |
Detailed Experimental Protocols
Protocol for AI-Accelerated Structure-Based Virtual Screening
This protocol utilizes the open-source RosettaVS platform and an active learning workflow to efficiently screen ultra-large chemical libraries [77].
Materials:
- Target Preparation: A high-resolution 3D structure of the enzyme target (X-ray, Cryo-EM, or a high-quality homology model).
- Chemical Library: Access to a computable chemical library (e.g., ZINC, Enamine REAL) in SMILES or SDF format.
- Computational Resources: A high-performance computing (HPC) cluster with multiple CPUs/GPUs. The OpenVS platform is designed for scalability [77].
- Software: RosettaVS suite installed and configured.
Procedure:
- Target Preprocessing: Prepare the protein structure by adding hydrogen atoms, assigning partial charges, and defining the binding site coordinates.
- Library Pre-filtering: Apply drug-like filters (e.g., Lipinski's Rule of Five) and remove compounds with undesirable chemical functionalities.
- Active Learning Workflow: Initiate the OpenVS platform, which integrates a target-specific neural network.
- The system performs an initial docking of a diverse subset of the library.
- The neural network learns from these initial results to predict the binding of remaining compounds.
- The platform iteratively selects and docks the most promising compounds, minimizing the total number of expensive docking calculations [77].
- High-Precision Docking: The top-ranked compounds from the active learning step are subjected to a more rigorous and accurate docking protocol (VSH mode in RosettaVS), which includes full receptor side-chain flexibility and limited backbone movement for improved pose prediction [77].
- Hit Selection and Analysis: The final output is a ranked list of compounds. Select a diverse set of top-ranking compounds for purchase and experimental validation. Prioritize compounds from different structural clusters to ensure scaffold diversity.
Protocol for Traditional HTS of Enzyme Variants
This protocol outlines a robot-assisted, high-throughput method for the expression, purification, and activity screening of enzyme variants in a 96-well format, adapted from a low-cost pipeline [10].
Materials:
- Liquid-Handling Robot: An automated system such as the Opentrons OT-2 [10].
- Plasmids: Cloned genes for the enzyme variants in an appropriate expression vector (e.g., pET-based with a His-SUMO tag) [10].
- E. coli Expression System: Chemically competent cells (e.g., prepared with Zymo Mix & Go! kit) [10].
- Consumables: 24-deep-well plates, 96-well assay plates, Ni-charged magnetic beads.
- Assay Reagents: Substrates, detection reagents (e.g., for colorimetric or fluorometric readouts), and purified positive control enzyme.
Procedure:
- Transformation and Inoculation:
- Using the liquid handler, transform competent E. coli with the variant plasmids directly in a 96-well plate and incubate for ~40 hours at 30°C to saturation [10].
- Inoculate 2 mL of auto-induction media in a 24-deep-well plate with the saturated transformation cultures. Incubate with shaking for protein expression.
- Small-Scale Protein Purification:
- Lyse the cells, typically by chemical or enzymatic methods.
- Transfer the lysates to a plate containing Ni-charged magnetic beads to bind the His-tagged enzyme variants.
- Wash the beads to remove non-specifically bound proteins.
- "Elute" the target enzyme by cleaving it from the beads using the SUMO protease, yielding a purified, tag-free enzyme sample without high imidazole concentrations [10].
- Activity Screening Assay:
- Dispense assay buffer, substrate, and the purified enzyme variants into a 96-well assay plate using the liquid handler.
- For enzymes where the product is not directly detectable, employ a coupled enzyme assay. This involves adding one or more auxiliary enzymes that convert the primary product into a measurable signal (e.g., a change in absorbance or fluorescence) [59].
- Incubate the plate under defined conditions (temperature, pH) and measure the signal kinetically or at endpoint using a plate reader.
- Data Analysis:
- Normalize the activity signals to positive and negative controls.
- Identify "hits" – enzyme variants that show significantly enhanced activity compared to a wild-type control or baseline.
The Scientist's Toolkit: Essential Research Reagents and Materials
Table 3: Key Research Reagent Solutions for Screening Campaigns
| Item | Function/Description | Example Use Case |
|---|---|---|
| Opentrons OT-2 Robot | A low-cost, open-source liquid-handling robot for automating pipetting steps in well-plate formats [10]. | Automates protein purification and assay setup in traditional HTS protocols [10]. |
| His-SUMO Tag Vector | An expression construct (e.g., pCDB179) allowing affinity purification via a His-tag and scarless elution via SUMO protease cleavage [10]. | Enables high-throughput, small-scale purification of enzyme variants without imidazole interference [10]. |
| Ni-charged Magnetic Beads | Beads functionalized with Ni²⁺ ions that bind to polyhistidine tags, allowing for magnetic separation and washing [10]. | Facilitates rapid, parallel purification of His-tagged enzyme variants in a 96-well format [10]. |
| Coupled Enzyme Assay | A detection system where the activity of the primary enzyme is coupled to a secondary enzyme that generates a measurable output (e.g., fluorescence, absorbance) [59]. | Measures the activity of enzymes that do not produce a natively detectable product in HTS [59]. |
| Synthesis-on-Demand Library | Vast catalogs of commercially available, but unsynthesized, compounds that can be produced within weeks (e.g., Enamine REAL library) [79]. | Provides access to billions of novel chemical structures for virtual screening campaigns [77] [79]. |
| RosettaVS Software | A physics-based virtual screening method integrated into an open-source platform (OpenVS) that supports active learning [77]. | Docks and scores ultra-large compound libraries against a target of interest, enabling hit discovery from billions of molecules [77]. |
Workflow Visualization
The following diagrams illustrate the logical flow of the two primary screening methodologies.
Virtual Screening Workflow
Traditional HTS Workflow
The choice between Virtual Screening and Traditional HTS is not mutually exclusive. An integrated approach can leverage the strengths of both: using VS to efficiently triage an ultra-large chemical space down to a manageable number of promising, novel scaffolds, which are then procured and validated using miniaturized, HTS-inspired experimental assays. This hybrid model is particularly powerful in the context of enzyme variant research, where it can be used to screen vast in silico mutant libraries or identify small-molecule modulators of enzyme function.
Evidence demonstrates that AI-accelerated virtual screening is now a mature and robust technology capable of identifying bioactive hits across a wide range of targets, with hit rates that often surpass those of traditional HTS [79]. When combined with affordable, automated laboratory pipelines for experimental validation [10], researchers are equipped with an unprecedented capacity to explore complex biological questions and accelerate the discovery of novel enzyme variants and therapeutics.
Conclusion
The integration of high-throughput screening with machine learning represents a transformative advancement in enzyme engineering, enabling the rapid exploration of sequence-function landscapes that was previously unimaginable. Current research demonstrates that structural characteristics significantly influence variant effect predictability, with mutations at buried positions, near active sites, or within secondary structures presenting distinct challenges for prediction models. The development of cell-free, ML-guided platforms allows for parallel engineering of specialized biocatalysts while addressing traditional limitations of small functional datasets and low-throughput strategies. However, consistent functional validation frameworks and standardized assay parameters remain crucial for reliable variant interpretation. Future directions will likely focus on leveraging emerging artificial intelligence methods, expanding beyond activity optimization to include stability and industrial performance, and generating comprehensive sequence-function maps to accelerate the development of novel biocatalysts for sustainable chemistry and precision medicine. As these technologies mature, they promise to significantly impact the bioeconomy across energy, materials, and therapeutic applications.
References
- 1. High-throughput screening [https://en.wikipedia.org/wiki/High-throughput_screening]
- 2. High Throughput Screening and Selection Methods for ... [https://pmc.ncbi.nlm.nih.gov/articles/PMC4461044/]
- 3. High Throughput Screening Assays for Drug Discovery [https://bellbrooklabs.com/high-throughput-screening-assays-drug-discovery/?srsltid=AfmBOorsfbmuO-gC9CPKQtxCSuF9sPhUNoGOBaYqHzFHpR4eNaZp4jb7]
- 4. Structure-filtered search of enzyme variants - PMC [https://pmc.ncbi.nlm.nih.gov/articles/PMC12513185/]
- 5. Computational scoring and experimental evaluation of ... [https://www.nature.com/articles/s41587-024-02214-2]
- 6. Advanced strategies in high-throughput droplet screening ... [https://www.sciencedirect.com/science/article/abs/pii/S0956566323009144]
- 7. Quantitative high-throughput screening data analysis [https://pmc.ncbi.nlm.nih.gov/articles/PMC4375054/]
- 8. Accelerating Biocatalysis Discovery with Machine Learning [https://pubmed.ncbi.nlm.nih.gov/37942268/]
- 9. Accelerated enzyme engineering by machine-learning ... [https://www.nature.com/articles/s41467-024-55399-0]
- 10. Enabling high-throughput enzyme discovery and ... [https://www.nature.com/articles/s41598-024-64938-0]
- 11. Enzyme structure correlates with variant effect predictability [https://www.sciencedirect.com/science/article/pii/S2001037024002940]
- 12. Enzyme structure correlates with variant effect predictability [https://research.wur.nl/en/publications/enzyme-structure-correlates-with-variant-effect-predictability]
- 13. Prediction of Function Determining and Buried Residues ... [https://pmc.ncbi.nlm.nih.gov/articles/PMC7991590/]
- 14. Enriching productive mutational paths accelerates enzyme ... [https://pmc.ncbi.nlm.nih.gov/articles/PMC11581979/]
- 15. Practical high-throughput screening assays to engineer the ... [https://pubmed.ncbi.nlm.nih.gov/41203354/]
- 16. 自動化實驗室與機器學習結合加速蛋白質工程革命 [https://geneonline.news/%E8%87%AA%E5%8B%95%E5%8C%96%E5%AF%A6%E9%A9%97%E5%AE%A4%E8%88%87%E6%A9%9F%E5%99%A8%E5%AD%B8%E7%BF%92%E7%B5%90%E5%90%88%E5%8A%A0%E9%80%9F%E8%9B%8B%E7%99%BD%E8%B3%AA%E5%B7%A5%E7%A8%8B%E9%9D%A9%E5%91%BD/]
- 17. 新质谱技术将酶筛选效率提升千倍 [https://www.stdaily.com/web/gdxw/2025-05/01/content_334117.html]
- 18. Integrated approach of Machine Learning and High ... [https://pmc.ncbi.nlm.nih.gov/articles/PMC12519302/]
- 19. 高通量微發酵技術革新助力生物製劑研發提速 [https://geneonline.news/%E9%AB%98%E9%80%9A%E9%87%8F%E5%BE%AE%E7%99%BC%E9%85%B5%E6%8A%80%E8%A1%93%E9%9D%A9%E6%96%B0%E5%8A%A9%E5%8A%9B%E7%94%9F%E7%89%A9%E8%A3%BD%E5%8A%91%E7%A0%94%E7%99%BC%E6%8F%90%E9%80%9F/]
- 20. 新质谱技术将酶筛选效率提升千倍 [https://cn.chinadaily.com.cn/a/202505/04/WS6826e8b0a31020537703375e.html]
- 21. A generalized platform for artificial intelligence-powered ... [https://www.nature.com/articles/s41467-025-61209-y]
- 22. 左二伟团队开发AI模型——AlphaCD,高精度表征胞嘧啶脱氨酶 [https://news.bioon.com/article/566189234200.html]
- 23. ML-Guided Enzyme Engineering Advances Green Chemistry | News | Northwestern Engineering [https://www.mccormick.northwestern.edu/news/articles/2025/01/ml-guided-enzyme-engineering-advances-green-chemistry/]
- 24. Establishment of High-Throughput Screening Protocol ... [https://pmc.ncbi.nlm.nih.gov/articles/PMC12409428/]
- 25. Automated in vivo enzyme engineering accelerates ... [https://www.nature.com/articles/s41467-024-46574-4]
- 26. Directed evolution of hydrocarbon-producing enzymes | Biotechnology for Biofuels and Bioproducts | Full Text [https://biotechnologyforbiofuels.biomedcentral.com/articles/10.1186/s13068-025-02689-4]
- 27. Super High-Throughput Screening of Enzyme Variants by ... [https://pmc.ncbi.nlm.nih.gov/articles/PMC10373491/]
- 28. Variant Effect Predictor (VEP) [https://re-docs.genomicsengland.co.uk/vep/]
- 29. htFuncLib: Designing Libraries of Active-site Multipoint ... [https://www.sciencedirect.com/science/article/pii/S0022283625000774]
- 30. Data-driven enzyme engineering to identify function ... [https://pmc.ncbi.nlm.nih.gov/articles/PMC10365845/]
- 31. A side-by-side comparison of variant function ... [https://pmc.ncbi.nlm.nih.gov/articles/PMC12311789/]
- 32. Application Notes [https://www.neb.com/en-us/application-notes?srsltid=AfmBOordwTCX_W4haVXCYh-gFF2YsZRB7Y1lb5Im7xKYQ2o_4s7hKEnk]
- 33. Efficient transferase engineering for SAM analog synthesis ... [https://pubmed.ncbi.nlm.nih.gov/41167846/]
- 34. Amide Bonds Meet Flow Chemistry: A Journey into ... [https://pmc.ncbi.nlm.nih.gov/articles/PMC9304223/]
- 35. Amide Coupling in Medicinal Chemistry [https://hepatochem.com/amide-coupling-medicinal-chemistry/]
- 36. An Extremely Sensitive Ultra-High Throughput Growth ... [https://link.springer.com/article/10.1007/s00253-024-13233-z]
- 37. Biochemical Assay Development: Strategies to Speed Up ... [https://bellbrooklabs.com/accelerate-biochemical-assay-development/?srsltid=AfmBOor3mNI7Aet_NPhO6mF0gX1SPy6Cnj7pw8zPEl5w6sCqb2DhoV2c]
- 38. A High‐Throughput Multi Well Plate–Based Approach for ... [https://pmc.ncbi.nlm.nih.gov/articles/PMC12590519/]
- 39. Structure Data for Analysis [https://help.tableau.com/current/pro/desktop/en-us/data_structure_for_analysis.htm]
- 40. Understanding the anatomy and proper construction of tables [https://www.decisionfoundry.com/misc/articles/understanding-the-anatomy-and-proper-construction-of-tables/]
- 41. Restriction enzyme troubleshooting guide [https://www.thermofisher.com/us/en/home/life-science/cloning/cloning-learning-center/invitrogen-school-of-molecular-biology/molecular-cloning/restriction-enzymes/restriction-enzyme-troubleshooting-guide.html]
- 42. Troubleshooting Common Issues with Restriction Digestion ... [https://www.thermofisher.com/us/en/home/brands/thermo-scientific/molecular-biology/molecular-biology-learning-center/molecular-biology-resource-library/spotlight-articles/7-common-issues-with-restriction-digestion-reactions-and-how-to-avoid-them.html]
- 43. Establishment of High-Throughput Screening Protocol ... [https://pubmed.ncbi.nlm.nih.gov/40877025/]
- 44. 限制酶消化实验方案 [https://www.sigmaaldrich.com/HK/zh/technical-documents/protocol/genomics/cloning-and-expression/restriction-enzyme-digest-protocol?srsltid=AfmBOopFqq_GzAyLrc_BLUkpFk-DG6ZK9F0KVNvRyLTUInGvp8_a7EpM]
- 45. 聚合酶链反应: [https://www.sigmaaldrich.com/HK/zh/technical-documents/technical-article/genomics/pcr/polymerase-chain-reaction?srsltid=AfmBOor2TOCkeQCLrd22PuUzagVzI1usZufAfsWPCKY8BJkvQ3WAQwVK]
- 46. A General Guide for the Optimization of Enzyme Assay ... [https://www.sciencedirect.com/science/article/pii/S247255522206779X]
- 47. 纯化并表征具有细胞毒性和抗菌作用的蛋白酶抑制剂 [https://www.ebiotrade.com/newsf/2025-11/20251124001948004.htm]
- 48. 基于 反 元 应 的调控因子 件 ——双荧光报告基因法 —BIO-101 筛 选 [https://en.bio-protocol.org/bio101/e1010839]
- 49. patents.google.com/patent/CN101629143A/zh [https://patents.google.com/patent/CN101629143A/zh]
- 50. DNA methylation and machine learning - PubMed Central - NIH [https://pmc.ncbi.nlm.nih.gov/articles/PMC12512482/]
- 51. A substrate-multiplexed platform for profiling enzymatic ... [https://www.nature.com/articles/s41467-025-61530-6]
- 52. Protocol for high-throughput DNA methylation profiling in ... [https://pmc.ncbi.nlm.nih.gov/articles/PMC11070626/]
- 53. High-coverage allele-resolved single-cell DNA methylation ... [https://www.nature.com/articles/s41467-025-61589-1]
- 54. Enzyme Assays: The Foundation of Modern Drug Discovery [https://bellbrooklabs.com/enzyme-assays-and-drug-discovery/?srsltid=AfmBOoryFU5782g5UxPE9VM-HAcGPam5m_dTn0HiCsy3eSy3OzshuVVL]
- 55. Fine tuning enzyme activity assays for monitoring the ... [https://www.nature.com/articles/s41598-024-84177-7]
- 56. Top Enzymatic Assays for Drug Screening in 2025 [https://synapse.patsnap.com/article/top-enzymatic-assays-for-drug-screening-in-2025]
- 57. CAPIM: Catalytic activity and site prediction and analysis tool ... [https://pmc.ncbi.nlm.nih.gov/articles/PMC12535199/]
- 58. Quantitative high-throughput screening: A titration-based ... [https://pmc.ncbi.nlm.nih.gov/articles/PMC1518803/]
- 59. High-throughput screening, next generation sequencing ... [https://pmc.ncbi.nlm.nih.gov/articles/PMC8851469/]
- 60. Organic Fusion of Molecular Simulation and Wet-Lab Validation [https://pmc.ncbi.nlm.nih.gov/articles/PMC12385867/]
- 61. Application and prospects of high-throughput screening for in ... [https://pmc.ncbi.nlm.nih.gov/articles/PMC9244953/]
- 62. High‐Throughput Assays to Assess the Functional Impact of ... [https://pmc.ncbi.nlm.nih.gov/articles/PMC5355973/]
- 63. Optimal design for high-throughput screening via false ... [https://pubmed.ncbi.nlm.nih.gov/30924183/]
- 64. The Distribution of Standard Deviations Applied to High ... [https://www.nature.com/articles/s41598-018-36722-4]
- 65. Experimental Design and Statistical Methods for Improved ... [https://www.sciencedirect.com/science/article/pii/S2472555222079801]
- 66. Comparative Analysis of Deep Learning Models for Predicting ... [https://pmc.ncbi.nlm.nih.gov/articles/PMC12562713/]
- 67. Genome-wide prediction of disease variant effects with a ... [https://www.nature.com/articles/s41588-023-01465-0]
- 68. Comparative analysis of functional assay evidence use ... - PMC [https://pmc.ncbi.nlm.nih.gov/articles/PMC6884856/]
- 69. Recommendations for application of the functional ... [https://clinicalgenome.org/docs/recommendations-for-application-of-the-functional-evidence-ps3-bs3-criterion-using-the-acmg-amp-sequence-variant-interpretation/]
- 70. Comparative analysis of functional assay evidence use ... [https://clinicalgenome.org/docs/comparative-analysis-of-functional-assay-evidence-use-by-clingen-variant-curation-expert-panels/]
- 71. Sequence Variant Interpretation [https://clinicalgenome.org/working-groups/sequence-variant-interpretation/]
- 72. Variant Pathogenicity Training Materials [https://clinicalgenome.org/curation-activities/variant-pathogenicity/training-materials/]
- 73. Application Notes [https://www.neb.com/en-us/application-notes?srsltid=AfmBOooqvEn7k-PFklipSJ8IdFQ6WHTtKsjgyxUC3yLnhPhW8IFqlixf]
- 74. Development, validation and quantitative assessment of an ... [https://pubmed.ncbi.nlm.nih.gov/27077032/]
- 75. Extending the dynamic range of biomarker quantification ... [https://www.nature.com/articles/s41467-023-39772-z]
- 76. Hit Identification and Optimization in Virtual Screening [https://pmc.ncbi.nlm.nih.gov/articles/PMC3772997/]
- 77. An artificial intelligence accelerated virtual screening ... [https://www.nature.com/articles/s41467-024-52061-7]
- 78. 中国高通量筛选(HTS) 服务市场规模、竞争格局及产业链研究 ... [https://www.wenkh.com.cn/reports/high-throughput-screening-hts-service-1914652486947430400]
- 79. AI is a viable alternative to high throughput screening [https://www.nature.com/articles/s41598-024-54655-z]