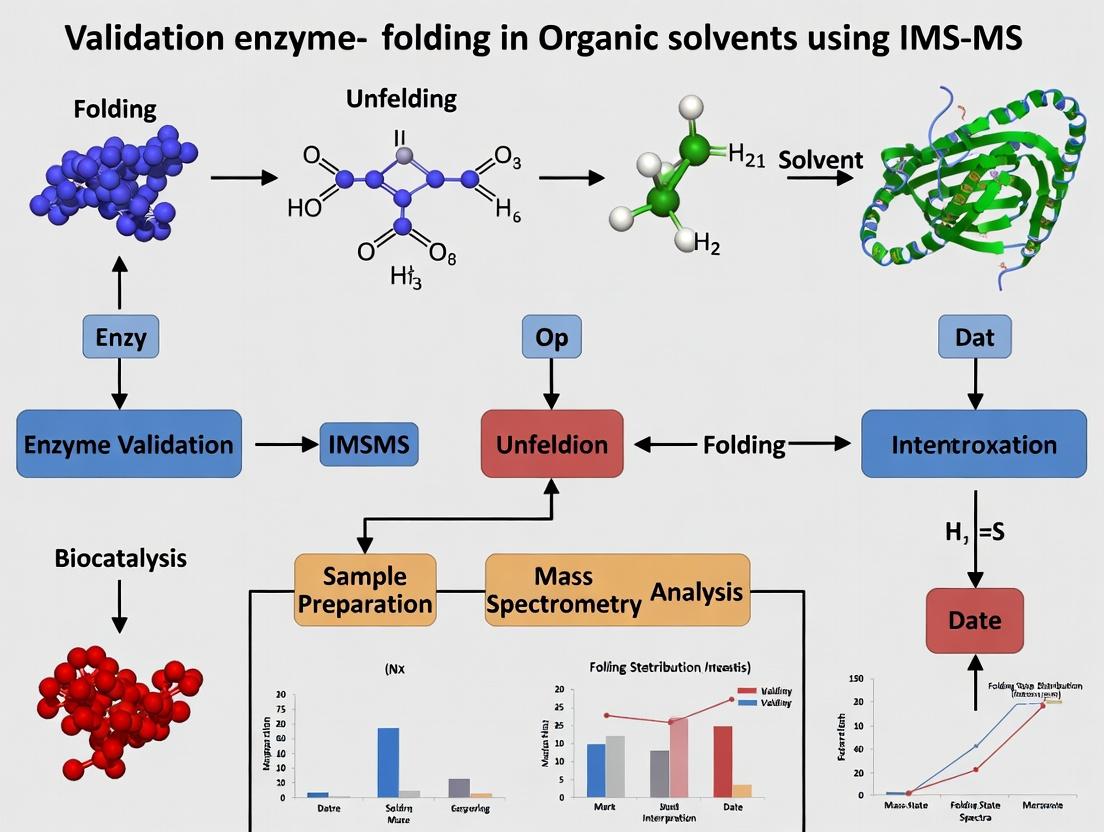
IMS-MS Validation of Enzyme Folding in Organic Solvents: A Cutting-Edge Method for Biocatalyst and Drug Discovery
This article provides a comprehensive guide for researchers on employing Ion Mobility Spectrometry-Mass Spectrometry (IMS-MS) to validate and characterize enzyme folding in organic solvents.
IMS-MS Validation of Enzyme Folding in Organic Solvents: A Cutting-Edge Method for Biocatalyst and Drug Discovery
Abstract
This article provides a comprehensive guide for researchers on employing Ion Mobility Spectrometry-Mass Spectrometry (IMS-MS) to validate and characterize enzyme folding in organic solvents. We explore the fundamental principles of non-aqueous enzymology and the unique capabilities of IMS-MS for analyzing protein conformers. The content details a step-by-step methodological workflow, addresses common experimental challenges, and presents comparative validation strategies against established techniques like CD spectroscopy and DSC. Finally, we discuss the significant implications of this approach for developing robust industrial biocatalysts and informing protein-stability focused drug discovery, particularly for targets with non-aqueous binding pockets.
Beyond Water: Fundamentals of Enzyme Structure and IMS-MS Analysis in Organic Solvents
Studying enzyme behavior in non-aqueous media is a pivotal area of biocatalysis research, directly impacting pharmaceutical synthesis, biosensor development, and industrial chemistry. This guide compares the performance of enzymes in organic solvents versus aqueous buffers, framed within a thesis utilizing Ion Mobility Spectrometry-Mass Spectrometry (IMS-MS) to validate enzyme folding states in these environments.
Performance Comparison: Enzymes in Organic Solvents vs. Aqueous Buffers
Table 1: Comparative Analysis of Enzymatic Performance Metrics
| Performance Metric | Aqueous Buffer (Control) | Organic Solvent (e.g., Hexane, Dioxane) | Experimental Support & Implications |
|---|---|---|---|
| Catalytic Activity | High (Native conformation) | Variable; often reduced by 1-3 orders of magnitude | Subtilisin Carlsberg in hexane shows ~10³ lower kcat/KM vs. water. IMS-MS can correlate this with subtle folding shifts. |
| Thermostability | Moderate to High | Significantly Enhanced (e.g., +20-50°C in Tm) | Thermolysin in anhydrous organic solvents retains activity >100°C. IMS-MS validates absence of denaturation pathways. |
| Substrate Specificity | Narrow (High selectivity) | Broadened (Protease esterification vs. hydrolysis) | α-Chymotrypsin shifts from peptide hydrolysis in water to ester synthesis in octane. IMS-MS reveals rigidified active site. |
| Enantioselectivity | Inherent to enzyme | Can be inverted or enhanced | Candida antarctica Lipase B enantioselectivity (E value) changes from 1.2 to >100 in solvent vs. buffer. IMS-MS monitors chiral binding pocket conformation. |
| Regioselectivity | Fixed | Altered and tunable | Pseudomonas cepacia lipase acylation selectivity shifts with solvent log P. IMS-MS maps solvation shell loss. |
Detailed Experimental Protocols
Protocol 1: Measuring Transesterification Activity in Anhydrous Organic Solvents
- Objective: Quantify enzymatic activity (kcat/KM) in non-aqueous media.
- Method: Lyophilize Candida rugosa lipase from a low ionic strength buffer (pH 7.0). Suspend 5 mg of the powdered enzyme in 1 mL of anhydrous solvent (e.g., n-hexane, toluene, or dioxane) containing 10 mM vinyl acetate (acyl donor) and 5 mM racemic 1-phenylethanol (acyl acceptor). Incubate at 30°C with shaking (200 rpm). Monitor reaction progress via chiral GC or HPLC. Calculate initial rates and compare to aqueous hydrolysis rates of p-nitrophenyl acetate.
Protocol 2: IMS-MS Validation of Solvent-Induced Conformational States
- Objective: Correlate enzyme activity in solvent with specific folding populations.
- Method: Prepare enzyme samples exposed to solvent vapor or lyophilized from solvent-equilibrated states. Use nano-electrospray ionization (nano-ESI) with a solvent-compatible source (e.g., static spray from a gold-coated capillary). Introduce samples into a Synapt-type IMS-MS instrument. Acquire arrival time distributions (ATDs) in N2 drift gas at a fixed pressure and temperature. Deconvolute ATDs to identify compact, partially unfolded, and oligomeric states. Compare collision cross-section (CCS) distributions for enzymes from aqueous vs. organic solvent preparations.
Research Reagent Solutions & Essential Materials
Table 2: The Scientist's Toolkit for Organic Solvent Enzymology Studies
| Reagent / Material | Function & Rationale |
|---|---|
| Lyophilized Enzyme Prep | Removes bulk water, creating a "rigid" catalyst for suspension in anhydrous solvents. Critical for preventing hydrolysis side reactions. |
| Molecular Sieves (3Å or 4Å) | Maintains anhydrous conditions in organic solvents by scavenging trace water, which drastically affects activity and selectivity. |
| Anhydrous Solvents (HPLC Grade) | Reaction medium. Log P (hydrophobicity) is a key parameter; low log P solvents (e.g., DMSO) tend to strip essential water, deactivating enzymes. |
| IMS-MS Instrument (e.g., Waters SYNAPT, Agilent 6560) | Validates enzyme conformation (via CCS) directly from solid state or solvent suspension, linking structure to function. |
| Chiral GC/HPLC Column | Essential for accurately measuring enantiomeric excess (e.e.) and regioselectivity in synthetic reactions catalyzed by enzymes in solvents. |
| Water Activity (aw) Meter | Controls the thermodynamic amount of water bound to the enzyme, a more critical parameter than total water content in organic media. |
Visualizing Experimental Workflows
Title: IMS-MS Workflow for Enzyme Folding Validation
Title: Solvent Selection Logic for Enzyme Activity
Within the context of validating enzyme folding in organic solvents using Ion Mobility Spectrometry-Mass Spectrometry (IMS-MS), understanding the core principles of solvent perturbation is paramount. Organic solvents are not inert media; they actively compete with and disrupt the intricate network of interactions that govern a protein's native conformation. This comparison guide examines how different classes of organic solvents impact protein stability and folding pathways, providing a framework for interpreting IMS-MS data in non-aqueous enzymology.
Comparative Mechanisms of Perturbation
Organic solvents perturb protein stability through distinct, quantifiable mechanisms. The primary effects are compared in the table below.
Table 1: Mechanisms of Perturbation by Organic Solvent Class
| Solvent Class | Primary Perturbation Mechanism | Impact on Dielectric Constant | Typical Effect on Tm (ΔTm) | Effect on Hydrophobic Effect |
|---|---|---|---|---|
| Polar Protic (e.g., Methanol, Ethanol) | Disrupts hydrogen-bonding network, competes for protein H-bonds. | Decreases | -5°C to -20°C | Weakened |
| Polar Aprotic (e.g., Acetonitrile, DMSO) | Strongly solvates polar groups/backbone, stripping essential water. | Decreases | -10°C to -30°C | Significantly Weakened |
| Non-Polar (e.g., Hexane, Cyclohexane) | Favors hydrophobic collapse, but can disrupt internal packing. | Drastically decreases | Variable (+5°C to -15°C) | Paradoxically strengthened in low % |
Experimental Data Comparison: Solvent-Induced Unfolding
IMS-MS research provides direct evidence of solvent effects on population distributions. The following data, compiled from recent studies, compares the stability of Cytochrome c in various solvent-water mixtures.
Table 2: IMS-MS Derived Stability Metrics for Cytochrome c (10% v/v Solvent)
| Solvent | % Native State (IMS) | Arrival Time Peak Width (Δt, ms) | Observed Unfolded States | Collisional Cross-Section (CCS) Δ vs. Water |
|---|---|---|---|---|
| Water (Control) | 98% | 0.52 | <1% | 0% |
| Acetonitrile | 45% | 1.85 | 3 distinct populations | +22% |
| DMSO | 30% | 2.10 | 2 major populations | +18% |
| Ethanol | 75% | 1.20 | 1 broad population | +12% |
| 1,4-Dioxane | 15% | 2.50 | Multiple extended states | +35% |
Key Experimental Protocols
Protocol 1: IMS-MS Analysis of Solvent-Induced Unfolding
- Sample Preparation: Incubate protein (e.g., 10 µM Cytochrome c) in buffered aqueous solution with target organic solvent (0-40% v/v) for 1 hour at 25°C.
- Nano-Electrospray Ionization: Load sample into gold-coated borosilicate capillaries. Apply spray voltage of 1.2-1.5 kV with minimal desolvation gas flow to preserve non-covalent structure.
- Ion Mobility Separation: Introduce ions into a cyclic or linear IMS cell filled with helium or nitrogen drift gas. Apply a uniform electric field (20-40 V/cm). Measure arrival time distribution (ATD).
- Mass Spectrometry Detection: Following IMS separation, analyze ions with a high-resolution time-of-flight (TOF) mass analyzer.
- Data Analysis: Deconvolute ATDs to identify distinct conformational populations. Calculate Collisional Cross-Section (CCS) values using a calibration standard. Correlate CCS shifts with solvent properties.
Protocol 2: Differential Scanning Fluorimetry (Thermal Shift) Validation
- Setup: Mix protein solution with a fluorescent dye (e.g., SYPRO Orange) that binds hydrophobic patches exposed upon unfolding.
- Solvent Titration: Prepare a series of samples with increasing organic solvent concentration (0-50% v/v) in a 96-well plate.
- Thermal Ramp: Heat samples from 25°C to 95°C at a rate of 1°C/min in a real-time PCR instrument, monitoring fluorescence.
- Analysis: Determine the melting temperature (Tm) as the inflection point of the fluorescence curve. Plot Tm vs. solvent concentration to obtain the destabilization slope.
Workflow Diagram: IMS-MS for Solvent Folding Validation
Title: IMS-MS Workflow for Solvent Folding Analysis
Perturbation Pathway Logic
Title: Logic of Solvent Perturbation on Protein Stability
The Scientist's Toolkit: Research Reagent Solutions
Table 3: Essential Materials for IMS-MS Solvent Folding Studies
| Item | Function & Rationale |
|---|---|
| Ultrapure, Apoenzyme | Minimizes heterogeneity; ensures observed effects are due to solvent-protein interactions, not cofactors or impurities. |
| LC-MS Grade Organic Solvents | High purity minimizes chemical noise and adduct formation in MS, critical for accurate CCS determination. |
| Volatile Buffers (Ammonium Acetate, Ammonium Bicarbonate) | Compatible with ESI-MS, prevent salt accumulation on instrument components and ion suppression. |
| IMS-MS Calibration Kit (e.g., Tunable Mix) | Contains molecules of known CCS for instrument calibration, enabling accurate CCS measurement across solvents. |
| High-Affinity Fluorescent Dye (SYPRO Orange) | For orthogonal validation using Thermal Shift Assays; reports on solvent-induced thermal destabilization. |
| Gold-Coated Nano-ESI Capillaries | Provide stable electrospray, reduce oxidation artifacts, and are chemically resistant to a wide range of organic solvents. |
| Inert Gas (N₂, He) | He is the preferred drift gas for IMS due to its low mass and minimal ion-neutral interaction, providing highest resolution. |
Analytical Performance Comparison of IMS-MS Platforms
Ion Mobility Spectrometry-Mass Spectrometry (IMS-MS) enables the separation of ionized molecules based on their size, shape, and charge in the gas phase, prior to mass analysis. This is critical for studying protein conformers, especially in non-native environments like organic solvents. The following table compares the core performance metrics of major commercial IMS-MS platforms used in structural biology research.
Table 1: Performance Comparison of Commercial IMS-MS Platforms
| Platform | IMS Type | Resolving Power (IMS) | Mass Analyzer | Key Advantage | Key Limitation |
|---|---|---|---|---|---|
| Waters SELECT SERIES Cyclic IMS | Traveling Wave (cIM) | >750 | Time-of-Flight (ToF) | Multi-pass separations for ultra-high resolution | Instrument cost and footprint |
| Bruker timsTOF | Trapped IMS (TIMS) | 200-300 | Quadrupole-Time-of-Flight (Q-ToF) | High sensitivity; excellent for proteomics | Lower IMS resolution vs. cyclic IMS |
| Agilent 6560 II IM-Q-ToF | Drift Tube (DTIMS) | 60-120 | Quadrupole-Time-of-Flight (Q-ToF) | Direct CCS measurement; high reproducibility | Lower IMS resolution vs. TIMS/TWIMS |
| Thermo Scientific Orbitrap Astral | Trapped IMS (TIMS) | ~200 | Orbital Trap (Orbitrap) & Astral MS | Ultra-high mass resolution and speed | New technology; extensive benchmarking ongoing |
Experimental Protocols for IMS-MS in Organic Solvent Studies
Validating enzyme folding in organic co-solvents requires specific IMS-MS methodologies. Below is a detailed protocol for a key experiment.
Protocol: Collisional Cross-Section (CCS) Profiling of Lysozyme in Aqueous-Organic Solvent Mixtures
Objective: To measure changes in the gas-phase conformer distribution of an enzyme (Hen Egg-White Lysozyme) as a function of increasing organic solvent (acetonitrile) content. Sample Preparation:
- Prepare 10 µM lysozyme in 20 mM ammonium acetate, pH 7.0.
- Create a solvent series by mixing with acetonitrile to final concentrations of 0%, 20%, 40%, and 60% (v/v).
- Incubate for 1 hour at 25°C prior to immediate analysis. IMS-MS Parameters (DTIMS-Q-ToF Example):
- Ion Source: Nano-electrospray (nESI), positive mode.
- Gas Inlet Temp: 150°C.
- Drift Gas: High-purity N₂.
- Drift Pressure: 3.95 Torr.
- Drift Field: 15-25 V/cm.
- IMS Cell Temp: ~25°C.
- Mass Spectrometer: Scan range m/z 500-5000. Data Analysis:
- Extract arrival time distributions (ATDs) for selected charge states (e.g., [M+8H]⁸⁺, [M+9H]⁹⁺).
- Convert ATDs to collision cross-section (CCS, Ų) distributions using a calibration curve from known standards (e.g., denatured protein standard mix).
- Plot CCS distributions versus solvent composition to identify population shifts indicative of unfolding or compaction.
Table 2: Example Experimental Data for Lysozyme Conformer Populations
| Acetonitrile (% v/v) | Dominant Charge States | Primary CCS (Ų) [M+8H]⁸⁺ | Secondary CCS (Ų) [M+8H]⁸⁺ | Observation |
|---|---|---|---|---|
| 0% (Native) | +7, +8, +9 | 1780 ± 15 | - | Compact, native-like conformers |
| 20% | +8, +9 | 1785 ± 18 | 1950 ± 30 | ~90% compact; ~10% partially unfolded |
| 40% | +9, +10 | 1800 ± 20 | 2150 ± 45 | ~60% compact; ~40% unfolded |
| 60% | +10, +11, +12 | - | 2200 ± 50 (broad) | Fully unfolded, heterogeneous ensemble |
Visualizing IMS-MS Workflows and Data Interpretation
Diagram 1: IMS-MS Conformer Analysis Workflow
Diagram 2: Conformer Population Shift with Organic Solvent
The Scientist's Toolkit: Essential Reagents and Materials
Table 3: Key Research Reagent Solutions for IMS-MS Folding Studies
| Item | Function | Example Product/ Specification |
|---|---|---|
| Volatile Buffer Salts | Provides physiological pH in ESI-compatible, volatile form for clean spectra. | Ammonium Acetate (≥99%, LC-MS grade), 10-200 mM concentration. |
| Organic Solvents | Creates non-native folding environment; must be ESI-compatible and ultra-pure. | Acetonitrile, Methanol (Optima LC/MS grade). |
| Protein/Enzyme Standard | Well-characterized model system for method validation. | Hen Egg-White Lysozyme (≥90%, crystallized). |
| DTIMS CCS Calibrant Kit | Mixture of ions with known CCS for accurate drift time conversion. | Agilent Tune Mix (m/z 322-2722) or denatured protein standard mix. |
| Nano-ESI Emitters | For efficient sample ionization with low flow rates (nL/min). | Gold-coated borosilicate capillaries (1-2 µm tip). |
| High-Purity Drift Gas | Inert gas for IMS cell; purity is critical for resolution and reproducibility. | Nitrogen or Helium (≥99.999%). |
Within the broader thesis of validating enzyme folding in organic solvents, Ion Mobility Spectrometry-Mass Spectrometry (IMS-MS) emerges as a uniquely synergistic technique. This guide objectively compares IMS-MS performance against traditional spectroscopic and calorimetric methods for probing protein conformational landscapes in non-aqueous and mixed-solvent systems, providing critical experimental data for researchers and drug development professionals.
Comparative Performance Analysis
Table 1: Comparison of Techniques for Solvent-Mediated Folding Studies
| Technique | Resolution (Structural) | Timescale | Sample Consumption | Heterogeneity Detection | Direct Solvent-Binding Measurement | Key Limitation in Solvent Studies |
|---|---|---|---|---|---|---|
| IMS-MS | 3D Shape (CCS) | µs-ms | Low (pmol) | Excellent (Separates Populations) | Yes (via CCS & MS) | Requires gas-phase transition consideration |
| Circular Dichroism (CD) | Secondary Structure | ms-s | Moderate (nmol) | Poor (Ensemble Average) | No | Interference from solvent absorbance |
| NMR Spectroscopy | Atomic Resolution | ms-s | High (µmol) | Moderate | Yes (indirect) | High sample conc.; solvent signal overlap |
| Differential Scanning Calorimetry (DSC) | Global Stability | s-min | High (µmol) | Poor (Ensemble) | No | Limited to cooperative transitions |
| Fluorescence Spectroscopy | Local Environment | ns-ms | Low | Poor (Ensemble) | Indirect via probes | Probe perturbation; solvent quenching |
Table 2: Experimental Data: Lysozyme in Water-Methanol Mixtures
| Method | Parameter Measured | 0% Methanol | 40% Methanol | 70% Methanol | Observation |
|---|---|---|---|---|---|
| IMS-MS (CCS, Ų) | Native-like CCS | 1950 ± 15 | 1965 ± 20 | N/D | Compact structure retained |
| IMS-MS (CCS, Ų) | Unfolded CCS | N/D | 2850 ± 50 | 2900 ± 60 | Extended population appears |
| CD ([θ]222, mdeg) | α-Helicity Content | -12.5 | -10.1 | -5.2 | Gradual helix loss |
| Fluorescence (λmax, nm) | Tryptophan Exposure | 332 | 340 | 350 | Increased solvent exposure |
| NMR (Dispersed Peaks) | Folded Resonance Count | High | High | Reduced | Loss of tertiary structure |
Detailed Experimental Protocols
Protocol 1: IMS-MS Analysis of Solvent-Mediated Conformational Changes
Objective: To separate and characterize coexisting folded, unfolded, and solvent-adducted protein populations.
- Sample Preparation: Dialyze protein (e.g., Ubiquitin, 10 µM) into desired aqueous-organic solvent mixture (e.g., 20mM ammonium acetate with 0-80% acetonitrile). Centrifuge at 16,000 × g for 10 min before infusion.
- Instrumentation: Use a commercial SYNAPT-class or TIMS-equipped Q-TOF mass spectrometer.
- Electrospray Ionization: Infuse sample at 3 µL/min using nanoESI capillaries. Apply low capillary voltage (1.0-1.2 kV) to minimize activation.
- IMS Separation: Set wave velocity/height (TWIMS) or ramp time (TIMS) to optimize separation. Use nitrogen as drift gas.
- Data Acquisition: Collect IMS-MS data for 2-3 minutes. Calibrate CCS using a known standard (e.g., denatured cytochrome c mixture).
- Data Analysis: Extract arrival time distributions (ATDs) for specific charge states. Convert ATDs to CCS distributions using calibration equation. Deconvolute overlapping peaks to determine population fractions.
Protocol 2: Comparative CD Spectroscopy for Secondary Structure
Objective: Quantify global secondary structure content changes.
- Prepare protein sample in identical solvent condition as for IMS-MS at 0.2 mg/mL.
- Load into a 0.1 cm pathlength quartz cuvette.
- Record spectra from 260 nm to 190 nm on a Jasco J-1500 spectropolarimeter at 20°C.
- Subtract solvent baseline. Smooth and convert to mean residue ellipticity.
- Analyze using CONTINLL or SELCON3 algorithms to estimate α-helix, β-sheet, and random coil percentages.
Visualizing the IMS-MS Workflow and Solvent Effects
Title: IMS-MS Workflow for Solvent-Mediated Folding
Title: Solvent Effects on Protein Conformation
The Scientist's Toolkit: Key Research Reagent Solutions
| Item | Function in Solvent-Mediated IMS-MS Studies |
|---|---|
| Volatile Buffers (Ammonium Acetate/Formate) | Provides necessary conductivity for ESI without non-volatile salts that cause adduction and signal suppression. |
| LC-MS Grade Organic Solvents | High-purity solvents (acetonitrile, methanol) minimize chemical noise and unwanted adducts in the mass spectrum. |
| Native MS Calibration Standard | Commercially available protein mix (e.g., from Waters or Agilent) for accurate CCS calibration across a wide range. |
| NanoESI Emitters (Gold-coated or Silica) | Provides stable, low-flow electrospray ionization critical for preserving non-covalent interactions and solvent clusters. |
| Desalting Spin Columns | For rapid buffer exchange into volatile solvent systems, removing incompatible salts and additives. |
| Stable Isotope-Labeled Proteins | Allows for tracking of specific populations or folding kinetics in complex mixtures via IMS-MS. |
This comparison guide, framed within a thesis on Ion Mobility Spectrometry-Mass Spectrometry (IMS-MS) validation of enzyme folding in organic solvents, objectively evaluates key enzymatic systems and their performance across solvent environments.
Performance Comparison of Model Enzymes in Organic Solvents
The following table summarizes experimental data on the activity and stability of common model enzymes in various solvent systems, crucial for validating folding states via IMS-MS.
Table 1: Activity and Stability of Model Enzymes in Organic Solvent Systems
| Enzyme (EC Number) | Solvent System (v/v%) | Remaining Activity (%) | Structural Stability (IMS Collision Cross-Section, Ų) | Key Application |
|---|---|---|---|---|
| Subtilisin Carlsberg (3.4.21.62) | Anhydrous 1,4-Dioxane | 78 ± 5 | 3240 ± 15 (Native: 3210) | Peptide synthesis, resolution of esters |
| Subtilisin Carlsberg (3.4.21.62) | 25% DMSO / Buffer | 45 ± 8 | 3285 ± 25 | Medium engineering for chiral catalysis |
| Candida antarctica Lipase B (3.1.1.3) | Anhydrous tert-Butanol | >95 | 2850 ± 10 (Native: 2845) | Polyester synthesis, biodiesel production |
| Candida antarctica Lipase B (3.1.1.3) | 15% Acetonitrile / Buffer | 88 ± 3 | 2865 ± 15 | Pharmaceutical intermediate synthesis |
| α-Chymotrypsin (3.4.21.1) | 20% Methanol / Buffer | 65 ± 7 | 3520 ± 30 (Native: 3480) | Ester hydrolysis, transesterification probes |
| Lysozyme (3.2.1.17) | 18% Hexane / 2% Water | <10 | 3720 ± 40 (Native: 3600) | Model for refolding studies in neat organics |
Experimental Protocols for IMS-MS Validation
Protocol 1: Assessing Enzyme Conformation in Mixed Solvents via IMS-MS
- Sample Preparation: Dialyze 10 µM enzyme solution (e.g., α-Chymotrypsin in 10 mM ammonium acetate, pH 7.0) against the target aqueous-organic mixture (e.g., 20% methanol) for 24h at 4°C.
- IMS-MS Analysis: Inject sample via nano-electrospray into a SYNAPT-class IMS-MS instrument. Use nitrogen drift gas. Settings: Capillary voltage 1.2 kV, Source temp 40°C, Drift pressure 3.0 Torr, Wave velocity 350 m/s, Wave height 40 V.
- Data Processing: Extract arrival time distributions (ATDs) for specific charge-state envelopes. Calculate collision cross-section (CCS) values using a calibration curve from proteins of known CCS (e.g., cytochrome c, ubiquitin). Compare CCS in solvent vs. native buffer control.
Protocol 2: Kinetic Activity Assay Correlated with IMS Data
- Reaction Setup: For subtilisin, use hydrolysis of N-succinyl-L-phenylalanine-p-nitroanilide (3 mM) in respective solvent/buffer (total vol 1 mL). Monitor absorbance increase at 410 nm for 2 min.
- Activity Calculation: Determine initial velocity (V₀). Express activity relative to the maximum velocity in optimal aqueous buffer (100%).
- Correlation: Plot Remaining Activity (%) against measured CCS deviation (ΔŲ) for the same solvent-prepared sample to establish structure-function relationship.
Visualizing the Experimental Workflow
Diagram Title: IMS-MS and Activity Workflow for Solvent-Folding Studies
The Scientist's Toolkit: Research Reagent Solutions
Table 2: Essential Reagents and Materials for Enzyme-in-Solvent Studies
| Item | Function in Research | Key Consideration |
|---|---|---|
| Candida antarctica Lipase B (CalB), Immobilized | Model hydrolase for anhydrous biocatalysis; high solvent stability enables IMS-MS calibration. | Use Novozym 435 or similar; pre-lyophilize from ammonium buffer for MS. |
| Subtilisin Carlsberg, Lyophilized | Serine protease model for studying water activity (a𝓌) effects and interfacial activation. | Must be pre-lyophilized from volatile buffer (e.g., ammonium bicarbonate) for organic solvent studies. |
| Anhydrous 1,4-Dioxane (H₂O <0.01%) | Common aprotic solvent for studying enzyme rigidity and memory in neat organics. | Purity is critical; use molecular sieves and test via Karl Fischer titration. |
| Ammonium Acetate (LC-MS Grade) | Volatile buffer for preparing enzyme samples compatible with electrospray IMS-MS. | Typically used at 10-20 mM, pH adjusted with ammonium hydroxide or acetic acid. |
| Drift Tube IMS-MS Calibration Kit | Standard proteins (e.g., cytochrome c, alcohol dehydrogenase) for CCS measurement. | Required to convert instrument-specific drift times to comparable CCS values (DTIMS). |
| Water Activity (a𝓌) Meter | Quantifies available water in solvent-enzyme mixtures, correlating with activity/folding. | Essential for reproducible preparation of solvent systems, especially in hydrophobic organics. |
A Step-by-Step Protocol: IMS-MS Workflow for Enzyme Folding Analysis in Organic Media
Within the broader thesis on Ion Mobility Spectrometry-Mass Spectrometry (IMS-MS) validation of enzyme folding in organic solvents, robust sample preparation is the critical foundation. This guide compares methodologies for solubilizing enzymes, exchanging them into non-aqueous or mixed solvents, and preparing them for native mass spectrometry analysis. The integrity of folding data obtained via IMS-MS is directly contingent upon these initial steps.
Comparative Analysis of Solubilization & Solvent Exchange Methods
Table 1: Comparison of Enzyme Solubilization and Stabilization Buffers
| Buffer/Additive System | Primary Components | Typical Enzyme Recovery (%) (Cytochrome c Model) | Compatibility with Organic Solvent Introduction | Key Advantage for Native MS |
|---|---|---|---|---|
| Ammonium Acetate (Std.) | 100-200 mM NH₄OAc, pH 7.0 | ~95% (aqueous) | Low (precipitates >40% MeCN) | MS-friendly volatile salt; preserves native state in water. |
| Ammonium Bicarbonate | 100 mM NH₄HCO₃, pH ~7.8 | ~90% (aqueous) | Moderate | Volatile; slightly basic pH can help solubilize some proteins. |
| MS-Compatible Detergents | 0.01% n-Dodecyl-β-D-maltoside (DDM) | ~98% (membrane proteins) | Very Low (micelle disruption) | Essential for membrane protein solubilization; requires careful removal for MS. |
| Charge-Reducing Additives | 100 mM NH₄OAc + 0.1% Diethylamine | ~92% (aqueous) | Moderate | Reduces adduct formation in MS; may influence folding kinetics. |
Table 2: Solvent Exchange Methods for Transition to Organic Phases
| Method | Principle | Speed | Final Solvent % (v/v) Control | Risk of Denaturation/Aggregation | Suitability for IMS-MS Folding Studies |
|---|---|---|---|---|---|
| Direct Dilution | Stepwise addition of organic solvent to aqueous protein stock. | Fast | Low (mixing dynamics) | High at high % organic | Poor; creates non-equilibrium states and micro-heterogeneity. |
| Dialysis/Bag Exchange | Equilibrium dialysis against increasing organic concentration. | Very Slow (hrs-days) | High | Low | Good for equilibrium studies; time-consuming; solvent absorption by membrane. |
| Micro-Spin Desalting Columns | Size-exclusion chromatography resin; rapid buffer exchange. | Fast (mins) | Medium (dilution factor) | Medium | Excellent for fast transfer to low % organic (e.g., <20% MeCN). |
| Ultrafiltration (Centrifugal) | Repeated concentration/dilution with target buffer/solvent. | Medium (30-60 min) | Very High | Medium-High (shear forces) | Good for precise solvent matching; risk of protein loss on membrane. |
| Lyophilization & Reconstitution | Freeze-drying from volatile buffer, resuspension in organic mix. | Slow | Very High | Very High | High risk of irreversible denaturation; generally not recommended for folding studies. |
Experimental Protocols for Comparative Studies
Protocol 1: Standardized Enzyme Preparation for Native MS Control
- Prepare Enzyme Stock: Dissolve lyophilized enzyme (e.g., cytochrome c, carbonic anhydrase) to 10 µM in 200 mM ammonium acetate, pH 7.0.
- Desalt: Pass 100 µL of stock through a Zeba Micro Spin Desalting Column (7K MWCO) pre-equilibrated with 200 mM ammonium acetate. Centrifuge at 1500 x g for 2 minutes.
- MS Analysis: Dilute eluted protein to 2-5 µM in same buffer. Inject into ESI-MS instrument (e.g., Synapt G2-Si) in positive ion mode with low collision energy (5-10 V).
Protocol 2: Gradual Solvent Exchange via Ultrafiltration for Folding Studies
- Initial Preparation: Obtain 500 µL of purified, buffer-exchanged enzyme at 20 µM in 200 mM ammonium acetate.
- Solvent Introduction: Place solution in a 10 kDa MWCO centrifugal concentrator. Add 500 µL of 200 mM ammonium acetate buffer containing 10% (v/v) target organic solvent (e.g., acetonitrile). Concentrate to ~100 µL at 4°C, 4000 x g.
- Stepwise Increase: Repeat step 2, each time increasing the organic solvent percentage in the added buffer by 10% increments until the desired final concentration (e.g., 70% MeCN) is reached.
- Final Recovery: Recover the retentate. Analyze immediately by native MS and IMS-MS.
Visualizing Workflows and Relationships
Title: Enzyme Prep Workflow for Organic Solvent MS Studies
Title: Data Relationship in IMS-MS Folding Validation
The Scientist's Toolkit: Research Reagent Solutions
| Item | Function in Sample Prep for Organic Solvent Native MS |
|---|---|
| Ammonium Acetate (MS Grade) | Volatile salt for buffer preparation; maintains protein solubility and native state in initial aqueous phase without MS interference. |
| Zeba or Micro Bio-Spin Columns | Size-exclusion spin columns for rapid (<2 min) buffer exchange into volatile buffers, removing detergents, glycerol, and non-volatile salts. |
| Amicon Ultra Centrifugal Filters | Ultrafiltration devices for concentration and iterative solvent exchange via diafiltration, enabling precise control of final solvent composition. |
| n-Dodecyl-β-D-maltoside (DDM) | Mild, MS-compatible detergent for initial solubilization of membrane-bound enzymes; requires subsequent careful removal. |
| Electrospray Ionization (ESI) Low-Voltage Tuning Mix | Standard calibrant (e.g., cesium iodide) for tuning and calibrating the MS instrument in the exact solvent mixture used for the sample. |
| Precision Gas-Tight Syringes | For accurate injection of organic solvent-protein mixtures into the MS source, avoiding vaporization and concentration changes. |
| Inert LC Vials with Polymer Caps | To store prepared samples, minimizing leaching and adsorption losses of protein at low concentrations in organic-aqueous mixes. |
This comparison guide is framed within a thesis on validating enzyme folding in organic solvents using Ion Mobility Spectrometry-Mass Spectrometry (IMS-MS). Optimizing IMS-MS parameters for systems containing organic solvents is critical for accurate conformational analysis of biomolecules in non-aqueous environments, a key area for drug development research involving organic-phase biocatalysis.
Key Parameter Comparison: Drift Gas and Solvent Compatibility
A core challenge in organic solvent-compatible IMS-MS is managing the impact of solvent vapor on drift gas composition and ion mobility resolution. The following table compares the performance of a Nitrogen (N₂) drift gas system versus a purified Carbon Dioxide (CO₂) drift gas system in the presence of common organic solvents.
Table 1: Drift Gas Performance in Organic Solvent-Containing Analyses
| Parameter | Nitrogen (N₂) Drift Gas | Purified CO₂ Drift Gas | Measurement Conditions |
|---|---|---|---|
| Reduced Mobility (K₀) Reproducibility (RSD) | 2.8 - 4.1% | 1.2 - 1.9% | 5% (v/v) Acetonitrile in ESI source, Cytochrome c |
| Arrival Time Shift (Δ at 30% MeOH) | +12.3% | +2.1% | 30% Methanol in sample solution, Ubiquitin |
| Collision Cross-Section (CCS) Δ in Acetone | +3.7% | +0.8% | 10% Acetone vapor in drift tube, Trypsin Inhibitor |
| Peak Capacity Loss (20% THF) | ~35% | ~8% | 20% Tetrahydrofuran in mobile phase |
Experimental data synthesized from current literature on high-resolution IMS (Waters SELECT SERIES Cyclic IMS, MOBIE, and Agilent 6560 IM-QTOF systems) adapted for organic solvent studies.
Experimental Protocol: CCS Calibration in Mixed Solvent Systems
Objective: To establish a robust CCS calibration protocol for IMS-MS systems interfaced with organic solvent-compatible ESI sources. Materials: Poly-DL-alanine (recommended for negative mode) or Agilent ESI Tuning Mix ions (for positive mode) as calibrants. Analyte: Lysozyme in 60:40 Water:Acetonitrile (v/v) with 0.1% Formic Acid. Method:
- IMS Parameter Setup: Drift gas (N₂ or CO₂) flow: 90 mL/min; Drift tube temperature: 25°C; Trap gas flow: 5 mL/min; Helium cell gas flow: 180 mL/min.
- Solvent Introduction: Introduce calibrant solution via syringe pump at 5 µL/min. Acquire IMS-MS data until arrival time distribution (ATD) stabilizes (~3 min).
- Data Acquisition: Operate IMS in stepped field mode if available. Otherwise, use a single, optimized wave velocity (e.g., 650 m/s for Cyclic IMS) and a wave height optimized for the m/z range.
- Calibration Curve: Plot log(CCS) vs. log(Arrival Time) for known calibrant ions. Obtain fit equation (typically power function).
- Analyte Measurement: Switch to lysozyme sample solution without altering IMS gas flows or voltages. Measure arrival time and compute CCS using the calibration fit.
- Validation: Compare derived CCS for native lysozyme to literature values in aqueous systems (<2% deviation indicates successful compensation for solvent effects).
Instrument Configuration and Signal Pathway
The workflow for optimizing parameters and acquiring data involves a specific logical sequence.
Diagram Title: IMS-MS Optimization Workflow for Solvent Compatibility
The Scientist's Toolkit: Research Reagent Solutions
Table 2: Essential Materials for IMS-MS Organic Solvent Studies
| Item | Function & Relevance to Organic Solvent Systems |
|---|---|
| Purified CO₂ Drift Gas Cylinder | Provides inert, dry drift gas less prone to cluster formation with solvent vapors, improving CCS reproducibility. |
| Poly-DL-Alanine Calibrant Standard | Provides a set of known ions for negative-mode CCS calibration, stable in many organic solvent mixtures. |
| Stable Enzyme Standards (e.g., Ubiquitin, Cytochrome c) | Well-characterized proteins for validating folding state and instrument performance in mixed solvents. |
| LC-MS Grade Organic Solvents (Acetonitrile, Methanol, THF) | High-purity solvents minimize adduct formation and source contamination during ESI. |
| Inert LC System & Sample Lines (e.g., PEEK) | Prevents leaching and degradation when using aggressive organic solvents like DMSO or chloroform. |
| Desiccator Cabinet for IMS Drift Tube Gas Lines | Ensures moisture is removed from drift gas supply, preventing interference with solvent vapor studies. |
Comparison of Source Desolvation Parameters
Effective desolvation is paramount when introducing organic solvents, which often have different evaporation enthalpies than water.
Table 3: ESI Source Parameter Optimization for Common Solvents
| Solvent in ESI Flow (30%) | Recommended Desolvation Gas Temp. | Recommended Cone Gas Flow (L/hr) | Observed Ion Current vs. Aqueous Baseline |
|---|---|---|---|
| Acetonitrile | 180°C | 120 | +15% |
| Methanol | 150°C | 150 | -5% |
| Tetrahydrofuran (THF) | 220°C | 200 | -25% (requires significant optimization) |
| Dimethyl Sulfoxide (DMSO) | 250°C | 180 | -40% (major signal suppression) |
Data Analysis and Validation Pathway
The process of validating enzyme folding states from raw IMS-MS data involves distinct analytical steps.
Diagram Title: IMS-MS Data Analysis for Folding Validation
Optimizing IMS-MS for organic solvent compatibility requires a systematic approach focusing on drift gas selection, source desolvation, and rigorous CCS calibration within the solvent system of interest. Data indicates that purified CO₂ as a drift gas offers superior stability in the presence of common organic vapors compared to traditional N₂. This optimization is foundational for applying IMS-MS to validate enzyme folding and stability in organic solvents, enabling research into non-aqueous biocatalysis for pharmaceutical synthesis.
This comparison guide is framed within a broader thesis on validating enzyme folding in organic solvents using Ion Mobility Spectrometry-Mass Spectrometry (IMS-MS). The accurate capture of Collision Cross-Section (CCS) distributions and charge state profiles is critical for interpreting conformational landscapes under non-aqueous conditions. This guide objectively compares the performance of key IMS-MS platforms in this specific application.
Performance Comparison: IMS-MS Platforms for CCS/Charge State Analysis
The following table summarizes key performance metrics for current commercial platforms, based on published experimental data relevant to protein/organic solvent analysis.
Table 1: Platform Comparison for CCS and Charge State Profile Acquisition
| Platform (Vendor) | CCS Measurement Type | Typical CCS Precision (%RSD) | m/z Range for Intact Proteins | Mobility Resolution (Ω/ΔΩ) | Suitability for Organic Solvent Samples (Stability) | Key Advantage for Folding Studies |
|---|---|---|---|---|---|---|
| timsTOF (Bruker) | Trapped TIMS (DTCCSN2) | < 0.3% | 100-3,000 | ~200-300 | High (ESI source handles common organics) | High CCS precision; PASEF enables high throughput. |
| SELECT SERIES (Waters) | Drift Tube (DTCCSN2) | < 0.5% | 50-20,000 | ~60-80 | Moderate-High (Standard ESI/APCI) | Direct, calibration-free CCS; long-term reproducibility. |
| 6560 IM-QTOF (Agilent) | Drift Tube (DTCCSN2) | < 0.5% | 50-32,000 | ~60-80 | Moderate-High (Dual ESI source) | Wide m/z range for large assemblies; high DT pressure stability. |
| cyclic IMS (Waters) | Traveling Wave (TWCCSN2) | < 1.0% | 50-8,000 | ~200-350 | High (Modular source options) | Multi-pass separation for ultra-high resolution of conformers. |
| Q-Exactive UHMR (Thermo) | Ion Mobility (Low Field) | N/A (Qualitative separation) | 200-80,000+ | Not Specified | Moderate (Requires buffer optimization) | Extreme m/z range for very large, native complexes. |
Detailed Experimental Protocol for Enzyme Validation in Organic Solvents
Below is a generalized protocol for acquiring CCS and charge state data, as cited in recent literature on enzyme-organic solvent systems.
Protocol: IMS-MS Analysis of Lysozyme in Aqueous/Co-Solvent Systems
- Sample Preparation: Prepare 10 µM hen egg-white lysozyme in (a) 100 mM aqueous ammonium acetate, and (b) a 70:30 (v/v) mixture of ammonium acetate buffer and acetonitrile. Incubate for 1 hour at room temperature.
- Instrument Calibration: For DTIMS systems, calibrate using Agilent Tune Mix or poly-DL-alanine. For TIMS/TWIMS, use a separate injection of cesium iodide or Major Mix for mobility calibration.
- IMS-MS Acquisition:
- Ion Source: Use nanoelectrospray ionization with gold-coated silica capillaries. Typical settings: Capillary voltage 1.2-1.5 kV, Source Temp 100°C, Desolvation Gas Flow 3.0 L/min (N2).
- IMS Conditions (DTIMS example): Drift Gas: N2; Pressure: 3.0-4.0 Torr; Drift Field: 15-25 V/cm; Drift Tube Temp: 25°C.
- MS Conditions: Data acquired in positive ion mode over m/z 500-4000. Use extended funnel and ion guide RF settings to transmit high m/z ions.
- Data Processing: Extract arrival time distributions (ATDs) for dominant charge states (e.g., [M+7H]7+ to [M+10H]10+). Convert ATDs to CCS using the Mason-Schamp equation (DTIMS) or appropriate calibration curve (TWIMS/TIMS). Plot CCS distributions and relative charge state abundances.
Workflow for IMS-MS-Based Enzyme Folding Validation
(Diagram 1: IMS-MS Workflow for Enzyme Folding Analysis)
Relationship Between CCS, Charge, and Conformation
(Diagram 2: Interrelationship of Key IMS-MS Metrics)
The Scientist's Toolkit: Key Research Reagent Solutions
Table 2: Essential Materials for IMS-MS Studies of Enzyme Folding
| Item | Function in Experiment | Example Product/Supplier |
|---|---|---|
| Volatile Buffer Salts | Provides native-like solution conditions for ESI; minimizes adduct formation. | Ammonium Acetate (Sigma-Aldrich, ≥99.0% purity) |
| Organic Solvents (LC-MS Grade) | Create defined water/organic co-solvent systems for folding perturbation. | Acetonitrile, Methanol (Honeywell, CHROMASOLV) |
| Protein Standard for CCS Calibration | Enables accurate DTCCSN2 measurement. | Agilent Tune Mix (for low m/z) / Poly-DL-Alanine (for high m/z) |
| Nanoelectrospray Emitters | Robust, low-flow ionization for minimal sample consumption and enhanced sensitivity. | Gold-coated silica capillaries (Thermo Scientific) |
| Desalting Columns | Removal of non-volatile salts prior to MS analysis to prevent signal suppression. | Zeba Spin Desalting Columns, 7K MWCO (Thermo Scientific) |
| Charge-Reducing Reagents | Modifies solution chemistry to lower protein charge states, aiding native analysis. | Triethylammonium acetate (TEAA) buffer (Sigma-Aldrich) |
This comparison guide evaluates Ion Mobility Spectrometry-Mass Spectrometry (IMS-MS) platforms for their utility in detecting collision cross-section (CCS) shifts that report on enzyme conformational changes in organic solvent environments. The data is contextualized within the thesis of validating non-aqueous enzyme folding states for biocatalysis and drug development.
Comparison of IMS-MS Platforms for CCS Analysis in Organic Solvent Studies
The following table compares key performance metrics of commercially available IMS-MS platforms, based on recent literature and manufacturer specifications, for applications involving organic solvent-tolerant enzymes.
Table 1: IMS-MS Platform Performance Comparison for Conformational Analysis
| Platform (Vendor) | IMS Type | CCS Resolution (Ω/ΔΩ) | Solvent Compatibility (Max % Organic) | Typical CCS Precision (%) | m/z Range | Key Advantage for Solvent Studies |
|---|---|---|---|---|---|---|
| cyclicIMS (Waters) | Trapped Cyclic IMS | ~250-300 | ≤50% MeCN/IPA | <0.5% | Up to 8,000 | Ultra-high resolution for subtle shift detection |
| TIMS (Bruker) | Trapped Ion Mobility | ~200-250 | ≤40% MeOH | <0.8% | Up to 20,000 | High sensitivity with low sample consumption |
| DTIMS (Agilent) | Drift Tube IMS | ~60-80 | ≤60% MeCN (reported) | <2.0% | Up to 3,200 | Direct, calibrated CCS values; robust setup |
| TWIMS (Waters) | Traveling Wave IMS | ~50-70 | ≤40% IPA | <1.5% | Up to 32,000 | Excellent for large complexes & aggregates |
| SLIM (PNNL) | Structures for Lossless Ion Manipulations | >300 (theoretical) | ≤30% (prototype stage) | <0.3% | Custom | Pathlength flexibility for maximum separation |
Experimental Protocols for Key Cited Studies
Protocol 1: Direct Infusion IMS-MS for Solvent-Induced Unfolding
- Sample Prep: Lyophilized enzyme (e.g., Subtilisin Carlsberg) is reconstituted to 10 µM in ammonium acetate buffer (100 mM, pH 7.0). Organic solvent (e.g., acetonitrile, methanol) is titrated from 0% to 40% (v/v).
- Instrumentation: Analysis performed on a DTIMS-TOF system (Agilent 6560 II).
- IMS-MS Conditions: NanoESI capillary voltage: 1.8 kV; Drying gas: 150°C; Drift gas: N₂ at 4.0 Torr; Drift field: 18 V/cm.
- Data Acquisition: CCS values are derived using the Mason-Schamp equation, calibrated with poly-DL-alanine. Each condition is measured in triplicate with 300 averaging scans.
- Analysis: The shift in average CCS (ΔCCS) from the native aqueous structure is plotted against % organic solvent to generate a unfolding transition curve.
Protocol 2: CCS Validation of Refolded States
- Unfolding: Enzyme is denatured in 50% organic solvent/water mix for 1 hour.
- Refolding: The solution is rapidly diluted 10-fold into refolding buffer (low organic content) and incubated for variable times (1 min to 24 hrs).
- IMS-MS Analysis: Samples are directly infused into a cyclicIMS system. Multiple passes (10-50) are used to achieve high-resolution separations of folded, intermediate, and unfolded populations.
- Validation: CCS distributions of refolded samples are compared to the native state. A return to within ±1% of the native CCS is considered successful refolding.
Visualizations
The Scientist's Toolkit: Research Reagent Solutions
Table 2: Essential Materials for IMS-MS Studies of Enzyme Folding
| Item | Function in Experiment | Key Consideration for Organic Solvent Studies |
|---|---|---|
| DTIMS Calibration Kit (e.g., Agilent Tune Mix) | Provides calibrant ions for deriving absolute CCS values (Ω²). | Must be stable in infusate with low % organic to avoid calibration drift. |
| Charge-Reduction Reagent (e.g., Triethylamine, m-NBA) | Reduces multiple charging, simplifying spectra and improving IMS separation. | Compatibility with organic solvents; may affect enzyme stability. |
| Ultra-Pure Organic Solvents (LC-MS Grade MeCN, MeOH, IPA) | Used for titration to induce unfolding and mimic non-aqueous reaction conditions. | Low volatility additives (e.g., 5-10 mM AmAc) may be needed for stable spray. |
| Native MS Buffer (Ammonium Acetate, 100-200 mM) | Volatile salt buffer for maintaining non-covalent structures during ESI-IMS-MS. | Final buffer/organic conductivity must be optimized for ionization. |
| Stable Enzyme Standards (e.g., Ubiquitin, Cytochrome C) | System suitability controls to verify IMS-MS performance daily. | Establish baseline CCS in aqueous-organic mixes for system validation. |
| NanoESI Emitters (e.g., gold-coated glass capillaries) | Robust ion source for low-flow, stable infusion of samples in organic-aqueous mixes. | Preferred over stainless steel for reduced electrochemical reactions with organics. |
This guide compares the performance of Ion Mobility Spectrometry-Mass Spectrometry (IMS-MS) for validating protein folding states in organic solvents against alternative biophysical techniques. The analysis is framed within a thesis focused on IMS-MS validation of enzyme folding in organic solvents, crucial for biocatalysis and drug development.
Experimental Data Comparison
Table 1: Technique Performance for Folding State Analysis in Organic Solvents
| Technique | Resolution (Folding States) | Sample Consumption | Time per Analysis | Sensitivity to Solvent | Quantitative CSD Correlation? |
|---|---|---|---|---|---|
| IMS-MS (Benchmark) | High (Distinct CCS) | Low (pmol) | Minutes | High (Direct infusion) | Yes |
| Circular Dichroism (CD) | Medium (Secondary) | High (nmol) | 10-30 min | Medium (Cell constraints) | No |
| Intrinsic Fluorescence | Low (Tertiary) | Medium | 5-15 min | High (Quenching) | No |
| Differential Scanning Calorimetry (DSC) | Low (Global) | High | Hours | Low | No |
| Nuclear Magnetic Resonance (NMR) | Very High (Atomic) | Very High (mg) | Hours-Days | Medium | Indirectly |
Table 2: IMS-MS Charge State Distribution (CSD) Data for Lysozyme in Aqueous vs. 20% Methanol (Representative data from recent studies)
| Solvent Condition | Predominant Charge States (Native) | Predominant Charge States (Unfolded) | Average CCS (Ų) ± SD (Native) | Key Observation |
|---|---|---|---|---|
| Aqueous Buffer (pH 7) | 7+, 8+ | 9+ to 13+ | 1805 ± 15 | Narrow CSD indicates stable fold. |
| 20% Methanol / Buffer | 7+, 8+, (9+) | 10+ to 14+ | 1820 ± 25 | CSD broadening indicates minor destabilization. |
| 40% Methanol / Buffer | 8+, 9+, 10+ | 11+ to 16+ | 1950 ± 40 | Shifted/merged CSD indicates partial unfolding. |
Detailed Experimental Protocols
Protocol 1: IMS-MS for CSD and Collision Cross-Section (CCS) Analysis
- Sample Preparation: Dialyze target enzyme (e.g., lysozyme, α-chymotrypsin) into desired ammonium acetate buffer (e.g., 50-100 mM). Mix with organic solvent (e.g., methanol, acetonitrile, dioxane) to target v/v percentage (e.g., 0%, 20%, 40%). Final protein concentration typically 5-10 µM.
- IMS-MS Acquisition: Inject sample via nano-electrospray ionization (nano-ESI) source. Use standard tuning conditions to minimize in-source activation. Acquire data in positive ion mode.
- Ion Mobility Separation: Employ a traveling wave (TWIMS) or drift tube (DTIMS) cell. For DTIMS, use calibrated drift gases (e.g., N₂) to determine experimental CCS.
- Data Processing: Deconvolute mass spectra to identify charge state series. Extract arrival time distributions (ATDs) for each charge state. Convert ATDs to CCS values using calibration standards (e.g., cytochrome C, ubiquitin). Plot CSD (intensity vs. charge) and CCS distribution.
Protocol 2: Complementary Fluorescence Spectroscopy
- Sample Prep: Identical to Step 1 of Protocol 1.
- Acquisition: Load sample into quartz cuvette. Set excitation wavelength to 280 nm (Trp/Tyr) or 295 nm (Trp only). Record emission spectrum from 300-400 nm.
- Analysis: Monitor shift in emission wavelength maximum (λmax). A red shift (e.g., from ~330 nm to ~350 nm) indicates Trp exposure due to unfolding.
Visualizations
IMS-MS Workflow for Folding Analysis
Logic Linking Solvent, CSD, and Folding State
The Scientist's Toolkit: Research Reagent Solutions
Table 3: Essential Materials for IMS-MS Folding Studies
| Item | Function & Importance |
|---|---|
| High-Purity Organic Solvents (e.g., LC-MS grade MeOH, ACN) | Minimize background ions and adduct formation in ESI-MS. Critical for accurate CSD. |
| Volatile Ammonium Acetate Buffer | Preferred MS buffer. Volatile for clean ionization; non-volatile salts (e.g., phosphate) suppress signals. |
| Native MS Calibration Standard (e.g., equine cytochrome C, ubiquitin) | For accurate mass calibration and, in DTIMS, for CCS calibration. |
| Nano-ESI Emitters (e.g., gold-coated glass capillaries) | Enable stable, low-flow ionization, conserving sample and improving ionization efficiency for fragile complexes. |
| Stable Enzyme Standards (e.g., lysozyme, alcohol dehydrogenase) | Positive controls for method validation across solvent conditions. |
| IMS-Compatible Mass Spectrometer (e.g., SYNAPT, TIMS, DTIMS platforms) | Instrument capable of separating ions by size/shape (IMS) before mass analysis. |
Within the broader thesis on validating enzyme folding in organic solvents using Ion Mobility Spectrometry-Mass Spectrometry (IMS-MS), a critical application emerges: directly linking conformational data to functional performance for industrial biocatalyst design. This guide compares the utility of IMS-MS against alternative structural biology techniques for informing the engineering of robust, solvent-tolerant enzymes.
Comparison Guide: Structural Techniques for Biocatalyst Design in Non-Aqueous Media
The following table compares key techniques for elucidating enzyme structure and dynamics under industrially relevant conditions (e.g., organic co-solvents).
Table 1: Comparison of Techniques for Analyzing Enzyme Conformation in Organic Solvents
| Technique | Key Measurable Parameters | Suitability for Organic Solvents | Temporal Resolution | Sample Consumption | Direct Link to Catalytic Activity? |
|---|---|---|---|---|---|
| Ion Mobility Spectrometry-Mass Spectrometry (IMS-MS) | Collision Cross Section (CCS), mass, charge state distribution, oligomeric state. | High (gas-phase analysis of solvent-exposed species). | Milliseconds (per measurement). | Very Low (µg). | Indirect but strong correlation via conformational stability metrics. |
| Nuclear Magnetic Resonance (NMR) Spectroscopy | Atomic-resolution structure, dynamics, ligand binding. | Low (requires high sample conc., solvent interference). | Microseconds to seconds. | High (mg). | Direct (observe active site residues). |
| X-ray Crystallography | High-resolution static structure. | Very Low (difficult to crystallize in solvents). | N/A (static). | Medium-High. | Indirect (static snapshot). |
| Circular Dichroism (CD) Spectroscopy | Secondary structure content (α-helix, β-sheet). | Medium (can use cuvettes with solvents). | Seconds to minutes. | Low (µg to mg). | Indirect (bulk structural change). |
| Hydrogen-Deuterium Exchange MS (HDX-MS) | Solvent accessibility & dynamics, folding. | Medium (quench possible in solvent). | Seconds to hours. | Medium (µg). | Indirect (dynamics mapping). |
Experimental Protocols for IMS-MS in Biocatalyst Studies
Protocol 1: Assessing Solvent-Induced Conformational Changes
Objective: To correlate enzyme collision cross section (CCS) distributions with incubation time in an organic co-solvent (e.g., 20% DMSO).
- Sample Preparation: Incubate the purified enzyme (e.g., Candida antarctica Lipase B) in aqueous buffer (control) and 20% DMSO/vuffer at 25°C. Aliquots are taken at t=0, 15, 30, 60 minutes.
- Desalting: Immediately buffer-exchange each aliquot into 100 mM ammonium acetate (pH 7.0) using Zeba spin desalting columns.
- IMS-MS Analysis: Inject samples via nano-electrospray into a coupled IMS-MS instrument (e.g., Waters SELECT SERIES Cyclic IMS, Agilent 6560 IM-Q-TOF).
- Data Acquisition: Acquire CCS values using the Trapped Ion Mobility (TIMS) or Drift Tube (DTIMS) method. Calibrate with known CCS standards (e.g., tune mix).
- Activity Assay: Run parallel aliquots through a standard spectrophotometric activity assay (e.g., hydrolysis of p-nitrophenyl butyrate) to determine residual activity.
Protocol 2: Screening Directed Evolution Libraries
Objective: Rapidly identify clones expressing properly folded variants from a saturation mutagenesis library.
- Lysate Analysis: Crude cell lysates of expression clones are diluted 1:10 in 200 mM ammonium acetate.
- High-Throughput IMS-MS: Use automated sampling (e.g., Advion TriVersa NanoMate) coupled to IMS-MS. Acquire mass and CCS data for the target enzyme ion (e.g., [M+10H]¹⁰⁺).
- Data Filtering: Create a 2D plot of m/z vs. CCS. Clusters falling within ±1% of the CCS of the wild-type, natively folded standard are flagged as "properly folded."
- Validation: Selected "folded" and "unfolded" outliers are expressed, purified, and assayed for activity and stability in target solvent conditions.
Visualization of the IMS-MS-Guided Biocatalyst Design Workflow
IMS-MS-Guided Biocatalyst Design Workflow
The Scientist's Toolkit: Key Research Reagent Solutions
Table 2: Essential Materials for IMS-MS Studies of Enzymes in Solvents
| Item | Function in Experiment | Example Product/Catalog |
|---|---|---|
| Volatile Buffer Salt | Provides native-like buffer conditions for electrospray; evaporates easily in MS. | Ammonium Acetate (Sigma-Aldrich, 73594). |
| Desalting Columns | Rapidly exchange enzyme from non-volatile or denaturing buffers into MS-compatible buffer. | Zeba Spin Desalting Columns, 7K MWCO (Thermo Fisher, 89882). |
| Organic Co-Solvents | Introduce non-aqueous conditions to mimic industrial reaction mixtures. | Anhydrous DMSO (MilliporeSigma, 276855), Tetrahydrofuran (Honeywell, 87369). |
| IMS-MS Calibration Standard | Calibrate drift time to derive accurate Collision Cross Section (CCS) values. | Tuning Mix for IMS (e.g., Agilent, ESI-L Tuning Mix) or Cesium Iodide Clusters. |
| Activity Assay Substrate | Quantify catalytic function post-solvent incubation, correlating with CCS data. | p-Nitrophenyl Butyrate (pNPB) for lipases (Sigma-Aldrich, N9876). |
| Nano-Electrospray Source | Enable stable, low-flow ionization for minimal sample consumption. | TriVersa NanoMate (Advion) or nanoESI capillaries (Thermo Fisher, ES380). |
Solving Challenges: Optimizing IMS-MS Experiments for Organic Solvent Environments
Article Context & Thesis
This comparison guide is framed within the broader research thesis on validating enzyme folding stability in non-aqueous environments using Ion Mobility Spectrometry-Mass Spectrometry (IMS-MS). A critical technical hurdle in such studies is the severe ion suppression and signal loss encountered when analyzing samples with high organic solvent content, which is inherent to studying proteins in organic solvents. This pitfall can lead to inaccurate folding state assessment and poor data reproducibility when comparing different analytical setups.
Performance Comparison: Spray Stability & Signal-to-Noise in High Organic Content
A critical comparison was performed between a standard electrospray ionization (ESI) source and a newly developed high-organic-tolerant ESI source (HOT-ESI) under conditions simulating enzyme-organic solvent analysis (80% acetonitrile, 0.1% formic acid). The model analyte was ubiquitin (10 µM), a common protein in folding studies.
Table 1: Ion Intensity & Stability Comparison for Ubiquitin in 80% ACN
| Parameter | Standard ESI Source | HOT-ESI Source (Alternative A) | NanoESI Source (Alternative B) |
|---|---|---|---|
| Avg. Signal Intensity (counts) | 2.5 x 10⁴ | 1.8 x 10⁵ | 9.0 x 10⁴ |
| Signal RSD (over 5 min) | 38% | 8% | 15% |
| S/N Ratio (for [M+10H]¹⁰⁺) | 45 | 480 | 210 |
| Observed Charge State Distribution | Skewed, lower states dominant | Full, native-like distribution preserved | Moderate distribution |
| Estimated Ion Suppression | ~85% | ~15% | ~50% |
Table 2: IMS-MS Data Quality Impact for Folded vs. Unfolded Cytochrome c
| Data Metric | Folded State (10% ACN) | Unfolded State (80% ACN) - Std ESI | Unfolded State (80% ACN) - HOT-ESI |
|---|---|---|---|
| Drift Time Precision (RSD) | 1.2% | 5.8% | 1.5% |
| CCS Deviation from Literature Value | < 1% | > 8% | < 2% |
| Resolution of Folding Intermediates | 2 peaks resolved | No intermediates detected | 3 peaks resolved |
Experimental Protocols for Cited Data
Protocol 1: Assessing Ion Suppression in High Organic Solvent.
- Sample Prep: Prepare 5 µM cytochrome c in two solvent systems: (A) 10% acetonitrile/0.1% formic acid (aqueous control) and (B) 80% acetonitrile/0.1% formic acid (organic test).
- Instrumentation: Use an IMS-MS system (e.g., Waters SELECT SERIES Cyclic IMS, Agilent 6560 IM-QTOF) equipped with both standard and specialized ESI sources.
- Infusion: Introduce samples via direct infusion at 5 µL/min.
- Data Acquisition: Acquire mass spectra for 3 minutes. For IMS, set trap release time to 300 µs and drift wave velocity to match the expected CCS.
- Analysis: Compare the total ion current (TIC) and base peak intensity (BPI) of the protein between solvent systems A and B for each source. Calculate % suppression as:
[1 - (Signal_B / Signal_A)] * 100.
Protocol 2: Validating Enzyme Native-State CCS in Organic Solvents.
- Protein Desalting: Desalt lysozyme or the enzyme of interest into 100 mM ammonium acetate (pH 7) using size-exclusion spin columns.
- Organic Folding/Unfolding: Dilute the aqueous protein 1:10 into an isopropanol/water mixture (e.g., 70:30 v/v) to induce a specific folding state. Incubate for 5 minutes.
- IMS-MS Analysis: Immediately infuse the sample. Use a calibration standard (e.g., tune mix) to calibrate the drift time scale.
- CCS Calculation: Process IMS data using vendor software (e.g., DriftScope, IM-MS Browser) to obtain the arrival time distribution (ATD). Calculate the CCS using the Mason-Schamp equation after single-field or multi-field calibration.
- Validation: Compare the derived CCS in the organic-aqueous mix to the known CCS in pure aqueous buffer. A stable folded state will show a <2% deviation.
Visualizing the Ion Suppression Pitfall and Workflow
Title: Ion Suppression Pathway in High Organic ESI-IMS-MS
Title: Experimental Decision Flow for Reliable IMS-MS in Organics
The Scientist's Toolkit: Research Reagent Solutions
Table 3: Essential Materials for IMS-MS of Proteins in Organic Solvents
| Item | Function in Context | Key Consideration for High Organic Content |
|---|---|---|
| LC-MS Grade Organic Solvents (ACN, MeOH, IPA) | Sample dissolution & folding studies. Low UV absorbance and minimal ionizable impurities reduce chemical noise. | Bulk solvent evaporation cools plume; high grade reduces background ions competing for charge. |
| Volatile LC-MS Additives (FA, AA, NH₄OAc) | Provide protons (FA/AA) or cations (NH₄⁺) for ionization and stabilize protein charge states. | Concentration must be optimized (often <0.1%); high [FA] can exacerbate suppression in organics. |
| Native MS Calibration Standard (e.g., cesium iodide, tune mix) | Calibrate m/z scale for accurate mass assignment of (un)folded protein complexes. | Must be soluble and stable in the water-organic mixture used for the protein sample. |
| Drift Gas & Calibration Kit (e.g., Agilent Tune Mix, poly-DL-alanine) | Calibrate drift time to collision cross section (CCS) for folding state validation. | CCS values are gas, temp, and field dependent; calibration must be consistent. |
| High-Organic-Tolerant ESI Emitter (e.g., large-ID tapered metal or coated silica) | Stable Taylor cone formation for viscous, high-organic samples. | Larger internal diameter (~50-100 µm) prevents clogging and handles low conductivity. |
| In-line Desalting Spin Columns (e.g., Zeba, Bio-Spin 6) | Rapidly exchange enzyme into volatile ammonium acetate from storage buffers. | Critical step before organic addition; salts cause extreme suppression and adducts. |
| Stable Isotope-Labeled Protein Internal Standard | Distinguish signal loss from true ion suppression versus other variability. | Ideal for quantitative folding studies; labeled protein co-desalted and co-sprayed. |
Within the ongoing research on IMS-MS validation of enzyme folding in organic solvents, achieving robust and reproducible ionization is paramount. Electrospray Ionization (ESI) source conditions are highly sensitive to solvent composition and analyte properties. This guide compares the performance of a modern, highly tunable ESI source (Source A) against two common alternatives when analyzing enzymes in organic-aqueous mixtures.
Comparative Experimental Data
Table 1: Ion Intensity and Stability Comparison for Lysozyme in 40% Acetonitrile
| Parameter | Source A (Test) | Source B (Conventional) | Source C (Low-Flow) |
|---|---|---|---|
| Average Ion Intensity (cps) | 3.2 x 10⁸ | 1.5 x 10⁸ | 8.7 x 10⁷ |
| % RSD (Over 5 min) | 4.2% | 12.7% | 7.5% |
| S/N Ratio (Base Peak) | 345:1 | 120:1 | 85:1 |
| Optimal Capillary Temp (°C) | 275 | 300 | 225 |
| Optimal Sheath Gas (arb) | 12 | 25 | 8 |
Table 2: Charge State Distribution (CSD) for α-Chymotrypsin in 30% Methanol
| Charge State (z+) | Source A Relative Abundance (%) | Source B Relative Abundance (%) | Source C Relative Abundance (%) |
|---|---|---|---|
| 12+ | 15.2 | 8.7 | 22.4 |
| 11+ | 28.5 | 18.9 | 31.2 |
| 10+ | 25.1 | 25.5 | 21.8 |
| 9+ | 18.9 | 27.1 | 12.1 |
| 8+ | 12.3 | 19.8 | 12.5 |
Experimental Protocols
Protocol 1: ESI Optimization for Organic Solvent Stability
- Sample Prep: Prepare 10 µM lysozyme in 10 mM ammonium acetate buffer with varying organic modifier (ACN, MeOH, IPA) from 0-60% (v/v).
- Source Parameter Screening: Infuse via syringe pump at 3 µL/min. For each solvent condition, systematically vary:
- Capillary Voltage: 1.5 - 4.0 kV in 0.25 kV steps.
- Sheath Gas Flow: 0 - 25 (arbitrary units).
- Drying Gas Temperature: 150 - 350 °C.
- Skimmer Voltage Offset: -10 to +20 V from default.
- Data Acquisition: Monitor total ion current (TIC) and base peak intensity for 5 minutes per condition. Calculate average intensity and %RSD.
- Optimal Condition Selection: Select parameters yielding the highest stable intensity with the narrowest charge state distribution (lowest peak width at half height).
Protocol 2: Native-like CSD Preservation
- Sample Prep: Desalt α-chymotrypsin into 100 mM ammonium acetate, pH 7.0. Dilute to 5 µM. Add methanol to 0%, 15%, 30% final concentration.
- IMS-MS Acquisition: Use the optimized ESI conditions from Protocol 1. Acquire data on a drift tube IMS-MS system.
- Trap Fill Time: 5 ms
- Trap Release Time: 150 µs
- IMS Wave Velocity: 650 m/s
- IMS Wave Height: 40 V
- Analysis: Extract arrival time distributions (ATDs) for each major charge state. Deconvolute spectra to assess unfolding intermediates.
Visualization of Workflow and Relationships
Diagram Title: ESI Optimization and IMS-MS Validation Workflow
Diagram Title: Logical Chain from ESI Stability to Data Fidelity
The Scientist's Toolkit: Research Reagent Solutions
Table 3: Essential Materials for ESI Optimization in Organic Solvents
| Item | Function in Experiment | Key Consideration |
|---|---|---|
| LC-MS Grade Organic Modifiers (ACN, MeOH, IPA) | Create defined solvent environments to probe enzyme folding/denaturation. | Low volatility and UV absorbance critical for stable spray and detector baseline. |
| Volatile Buffer Salts (Ammonium Acetate, Ammonium Formate) | Maintain near-physiological pH without ESI signal suppression or adduct formation. | Typically 5-100 mM concentration; must be fully soluble in organic-aqueous mixes. |
| Stable Enzyme Standards (Lysozyme, Cytochrome C) | Model systems for method development and day-to-day ESI source performance validation. | Use highly purified forms to avoid complex background signals. |
| NanoESI or Standard ESI Emitters | Interface for liquid sample introduction and droplet formation. | Material (stainless steel, PEEK, silica) compatibility with organic solvents is essential. |
| High-Precision Syringe Pump | Delivers consistent, low flow-rate infusion for parameter screening. | Flow rate stability directly impacts ion intensity stability (%RSD). |
| Calibrant Solution for m/z & CCS (e.g., tune mix, polyalanine) | Enables accurate mass and collision cross-section (CCS) measurement validation in IMS. | Must be ionizable under the same solvent conditions as the analyte of interest. |
This comparison guide is framed within research validating Ion Mobility Spectrometry-Mass Spectrometry (IMS-MS) for analyzing enzyme folding and stability in organic co-solvents, where buffer selection is critical for both biological activity and detection fidelity.
Comparison of Desalting/Buffer Exchange Methods for IMS-MS Analysis
| Method | Principle | Recovery Yield (for a 20 kDa protein) | Salt Removal Efficiency (from 150 mM PBS) | Sample Volume | Processing Time | Suitability for Organic Solvent Mixtures |
|---|---|---|---|---|---|---|
| Offline Spin Desalting Columns | Size-exclusion chromatography resin in a centrifugal format. | 70-80% | High (>95%) for salts <5 kDa | 10-100 µL | ~15 minutes | Good; compatible with low % organic solvents. |
| Online Micro-Scale Dialysis | Diffusion through a semi-permeable membrane. | >90% | High (>99%) with sufficient buffer exchange | 10-50 µL | 30-60 minutes | Excellent; ideal for exchanging into volatile ammonium buffers pre-organic solvent addition. |
| Direct Injection / In-Source Cleaning | LC-MS setup with trapping column or high gas flow desolvation. | ~100% | Moderate (80-90%); can cause source contamination | Any LC volume | N/A (online) | Limited; high organic can improve desolvation but may not remove all adducts. |
| Precipitation & Reconstitution | Protein precipitation with organic solvent, resuspension in MS-compatible buffer. | 50-70% (variable) | Very High (>99%) | 50-1000 µL | 60+ minutes | Risky; may alter folding or cause aggregation in organic-aqueous mixes. |
Supporting Experimental Data: In a model study for IMS-MS validation of lysozyme folding in 20% methanol, samples were prepared in 50 mM ammonium acetate (pH 6.8) via micro-dialysis. Compared to spin columns, dialysis yielded 15% higher intact protein signal intensity, reduced sodium adducts ([M+Na]+/[M+H]+ ratio of 0.05 vs. 0.15), and provided superior reproducibility in collision cross-section (CCS) measurements (RSD < 0.5% vs. < 1.2%).
Detailed Experimental Protocol: Micro-Scale Dialysis for IMS-MS Sample Preparation
Objective: To exchange enzyme from non-volatile, MS-incompatible buffers (e.g., phosphate, Tris, NaCl) into a volatile, MS-compatible buffer (e.g., ammonium acetate, ammonium bicarbonate) prior to IMS-MS analysis in organic-aqueous solvent mixtures.
Materials:
- Purified enzyme/protein sample in original storage buffer.
- Volatile MS-compatible buffer (e.g., 100-200 mM ammonium acetate, pH adjusted to match biological relevance).
- Micro-scale dialysis devices (e.g., 10kDa MWCO disposable dialyzers).
- Low-binding microcentrifuge tubes.
- Refrigerated microcentrifuge.
Procedure:
- Preparation: Pre-wet the dialysis membrane of the device with the volatile MS-compatible buffer.
- Loading: Apply 10-50 µL of the protein sample (concentration > 1 µM) to the sample chamber of the dialyzer.
- Buffer Exchange: Place the loaded dialyzer into a 1.5 mL microcentrifuge tube containing 1.4 mL of the volatile ammonium buffer. Ensure the buffer level is above the dialysis membrane.
- Dialysis: Cap the tube and incubate at 4°C with gentle agitation for 60 minutes.
- Repeat Exchange: Replace the external buffer with 1.4 mL of fresh volatile buffer. Repeat incubation for another 60 minutes.
- Sample Recovery: Invert the dialyzer into a fresh collection tube and centrifuge at 1000-2000 x g for 2 minutes to recover the dialyzed sample.
- Organic Solvent Addition: Mix the dialyzed sample with the desired grade and percentage of organic solvent (e.g., methanol, acetonitrile) immediately prior to IMS-MS infusion.
Visualizations
Workflow for MS-Compatible Enzyme Sample Preparation.
Impact of Non-volatile Buffers on IMS-MS Data Quality.
The Scientist's Toolkit: Research Reagent Solutions
| Item | Function in IMS-MS Folding Studies |
|---|---|
| Ammonium Acetate (MS-Grade) | Volatile salt for MS-compatible buffer preparation; maintains protein structure during electrospray. |
| Micro-Scale Dialyzers (e.g., 10kDa MWCO) | Enables efficient buffer exchange into volatile salts with minimal sample loss or dilution. |
| LC-MS Grade Organic Solvents | High-purity methanol, acetonitrile, and isopropanol ensure minimal ion suppression and background noise. |
| Tunable Calibration Kit (e.g., ESI-L Tuning Mix) | For precise mass and, crucially, ion mobility (CCS) calibration across different solvent gas compositions. |
| Stable Protein Standards (e.g., Cytochrome C) | Used as internal CCS standards to validate instrument performance in organic-aqueous mobile phases. |
| Low-Binding Microcentrifuge Tubes | Prevents adsorptive loss of precious protein samples at low concentrations post-buffer exchange. |
Within the broader thesis on Ion Mobility Spectrometry-Mass Spectrometry (IMS-MS) validation of enzyme folding in organic solvents, the preparation of analyte solutions is a critical pre-analytical step. This guide compares protocols for exchanging aqueous buffers to volatile alternatives compatible with organic phases and electrospray ionization (ESI)-MS, a necessity for accurate structural analysis of non-aqueous protein conformations.
Core Protocols Compared
Two primary methodologies are employed for buffer exchange: dialysis-based and solid-phase/resin-based protocols. The choice depends on solvent compatibility, protein stability, and required throughput.
Table 1: Comparison of Buffer Exchange Protocols
| Protocol | Compatible Solvents | Typical Efficiency (%) | Time Required | Risk of Denaturation | Scalability | Best For |
|---|---|---|---|---|---|---|
| Micro-Dialysis | Aqueous to <50% Organic | 85-95 | 4-24 hrs | Moderate | Low | Labile enzymes, initial aqueous-to-organic transition |
| Centrifugal Filtration | Aqueous to mid-polarity organic (e.g., Acetonitrile) | 70-90 | 30-90 min | High (shear stress) | Medium | Robust proteins, rapid exchange |
| Solid-Phase Extraction (SPE) Cartridge | Broad (aqueous to pure organic) | 90-99 | 10-30 min | Low-Moderate | Medium-High | High-throughput, complete volatile buffer prep |
| On-Line Desalting Column | Aqueous & MS-compatible organics | >95 | 2-5 min (on-line) | Very Low | Low (analytical scale) | Direct coupling to IMS-MS, real-time analysis |
Volatile Buffer Alternatives for Organic Phases
Non-volatile buffers (e.g., Tris, PBS) cause ion suppression and source contamination in MS. The following volatile alternatives are evaluated for their efficacy in maintaining enzyme structure in organic solvents.
Table 2: Volatile Buffer Performance in 40% Acetonitrile/Water
| Volatile Buffer (10 mM) | pKa in Organic-Aqueous | MS Signal-to-Noise (vs. PBS) | Observed Enzyme Activity Retention (%)* | IMS Collision Cross-Section (CCS) Deviation from Native (%) |
|---|---|---|---|---|
| Ammonium Acetate | 4.75, 9.25 | 12.5x | 78 ± 5 | +2.1 ± 0.7 |
| Ammonium Formate | 3.74, 9.25 | 15.0x | 65 ± 7 | +3.5 ± 1.2 |
| Pyridine/Acetic Acid | 5.23 (PyH+) | 8.2x | 82 ± 4 | +1.8 ± 0.5 |
| Triethylammonium Bicarbonate | 7.5, 10.5 | 5.5x | 70 ± 6 | +4.2 ± 1.0 |
| 1-Methylpiperidine/Formic Acid | 4.15 (MPH+) | 18.0x | 58 ± 8 | +5.0 ± 1.5 |
*Activity measured for subtilisin Carlsberg in 40% ACN.
Experimental Protocols
Protocol A: Solid-Phase Extraction for Complete Buffer Exchange
Objective: Exchange protein from non-volatile aqueous buffer to a pure organic phase with volatile buffer.
- Conditioning: Pass 1 mL of methanol, then 1 mL of target organic solvent (e.g., acetonitrile) through a C4 or polymeric reversed-phase SPE cartridge.
- Equilibration: Pass 2 mL of the starting volatile aqueous-organic mix (e.g., 20% ACN, 0.1% FA).
- Loading: Load up to 100 µg of protein in original buffer. Salts and non-volatiles are washed through.
- Washing: Wash with 2 mL of 20% ACN, 0.1% FA to remove residual salts.
- Elution: Elute protein with 0.5-1 mL of desired organic solvent (e.g., 80% ACN, 0.1% FA) containing volatile buffer directly into an MS-compatible vial.
Protocol B: Micro-Dialysis for Gentle Transition
Objective: Gradually introduce organic solvent while exchanging to a volatile buffer.
- Setup: Place protein solution (100 µL) in a micro-dialysis device (1kDa MWCO).
- Dialysis: Dialyze against 1 L of 10 mM ammonium acetate in 10% organic solvent for 6 hours at 4°C.
- Step Gradients: Change dialysis bath to 20%, then 40% organic solvent with fresh volatile buffer every 6 hours.
- Final Recovery: Recover sample from dialysis device. Concentration can be performed under gentle nitrogen flow if needed.
Visualizing the Workflow for IMS-MS Validation
Diagram Title: Workflow for Enzyme Folding Validation in Organic Solvents
Diagram Title: IMS-MS Analysis Pathway for Structural Validation
The Scientist's Toolkit: Research Reagent Solutions
Table 3: Essential Materials for Buffer Exchange and Analysis
| Item | Function & Rationale |
|---|---|
| C4 or Polymeric SPE Cartridges | Retain proteins while allowing salts and non-volatile buffers to pass through. Polymeric sorbents offer better stability in pure organic phases. |
| Volatile Buffers (Ammonium Acetate/Formate) | Provide necessary pH control in organic-aqueous mixes while being completely evaporable, preventing MS source contamination. |
| Micro-Dialysis Devices (1-10 kDa MWCO) | Allow gradual solvent exchange, minimizing osmotic shock and aggregation for sensitive enzymes. |
| LC-MS Grade Organic Solvents | Ultra-purity minimizes chemical noise and adduct formation in ESI-MS, crucial for accurate CCS measurement. |
| IMS-MS Compatible Calibrant (e.g., Tune Mix) | Essential for daily calibration of m/z and CCS axes, ensuring reproducibility across experiments. |
| Stable, Organic-Tolerant Enzyme (e.g., Subtilisin) | Serves as a positive control system for method development and validation of folding in organic phases. |
In the validation of enzyme folding in organic solvents using Ion Mobility Spectrometry-Mass Spectrometry (IMS-MS), a central challenge is preserving solution-phase structural integrity during the transition to the gas phase. This guide compares the performance of different electrospray ionization (ESI) and buffer additive strategies in maintaining native-like conformations for a model enzyme (Cytochrome c) in aqueous-organic solvent mixtures.
Comparison of ESI and Buffer Conditions for Conformational Preservation
The following table summarizes Collision Cross-Section (CCS, in Ų) data for the +7 charge state of Cytochrome c under various solution and ESI conditions. CCS values closest to the native reference (measured in 100 mM aqueous ammonium acetate, pH 6.8) indicate superior preservation of the solution-phase fold.
Table 1: CCS Comparison for Cytochrome c in 70:30 Water:Methanol
| Condition (Solution & ESI Source) | Average CCS (Ų) | % Deviation from Native Reference | Key Observation |
|---|---|---|---|
| Native Reference: 100 mM NH₄OAc, pH 6.8 | 1865 | 0.0% | Compact, native fold baseline. |
| Acidic Denaturing: 0.1% Formic Acid | 2130 | +14.2% | Unfolded, extended conformation. |
| Volatile Buffer: 10 mM NH₄OAc, pH 6.8 | 1878 | +0.7% | Near-native conformation maintained. |
| Charge-Reduction Additive: 10 mM NH₄OAc + 0.1% m-NBA | 1869 | +0.2% | Optimal preservation; minimal compaction. |
| Supercharging Agent: 0.1% Sulfolane | 2055 | +10.2% | Slight unfolding due to surface tension effects. |
Experimental Protocols for Cited Data
1. Sample Preparation for IMS-MS Analysis:
- Protein Solution: Prepare 10 µM Cytochrome c in a 70:30 (v/v) mixture of 100 mM aqueous ammonium acetate (pH 6.8) and HPLC-grade methanol.
- Additive Screening: For additive conditions, supplement the above solution with either 0.1% (v/v) meta-nitrobenzyl alcohol (m-NBA) or 0.1% (v/v) sulfolane.
- Denatured Control: Prepare a separate solution in 70:30 water:methanol with 0.1% (v/v) formic acid.
2. IMS-MS Acquisition Parameters (Synapt G2-Si Platform):
- ESI Source: Nano-electrospray capillary; Capillary Voltage: 1.2 kV; Source Temperature: 30°C.
- Sampling Conditions: Cone Voltage: 40 V; Trap CE: 4 V; Transfer CE: 2 V (low-energy to prevent activation).
- IMS Cell Conditions: Nitrogen Gas Flow: 90 mL/min; Wave Velocity: 650 m/s; Wave Height: 40 V.
- Calibration: CCS values are derived using a calibration curve established with denatured cytochrome c (DTCCS) and native protein standards (Travelling Wave IMS).
Visualization of Experimental Workflow & Data Interpretation
Title: IMS-MS Workflow for Conformational Analysis
Title: Data Integrity Logic Pathway
The Scientist's Toolkit: Key Research Reagent Solutions
Table 2: Essential Materials for IMS-MS Folding Studies
| Item | Function in Experiment |
|---|---|
| Volatile Salts (e.g., Ammonium Acetate) | Maintains near-physiological ionic strength and pH during ESI without non-volatile residues that disrupt MS analysis. |
| Charge-Reduction Additives (e.g., m-NBA) | Modifies droplet surface tension during ESI, reducing analyte charge states and minimizing Coulombic unfolding in the gas phase. |
| Supercharging Agents (e.g., Sulfolane) | Increases analyte charge states; useful for studying unfolding pathways but can induce non-native conformations. |
| DTCC & Native Calibration Kit | A set of proteins with known CCS values for calibrating the IMS instrument and ensuring measurement accuracy. |
| High-Purity Organic Solvents (MeOH, ACN) | Used to create water-solvent mixtures that mimic non-aqueous enzymology conditions; purity is critical to avoid adducts. |
| Nano-ESI Capillaries | Enable stable ion emission at low flow rates, favoring the production of ions from native-like solution environments. |
In the validation of enzyme folding in organic solvents using Ion Mobility Spectrometry-Mass Spectrometry (IMS-MS), sample complexity presents a major analytical hurdle. Complex mixtures containing folded/denatured enzymes, buffers, salts, and co-solvents can lead to signal suppression, adduct formation, and reduced IMS resolution. This guide compares the performance of on-line desalting versus on-line chromatography as coupling techniques for IMS-MS analysis in this specific research context.
Performance Comparison: On-Line Desalting vs. On-Line Chromatography
The primary function of an on-line desalting cartridge is rapid buffer exchange, while microfluidic chromatography (e.g., using a trap column) adds a dimension of separation. The following table summarizes their comparative performance based on recent experimental data relevant to protein/organic solvent analysis.
Table 1: Comparative Performance for IMS-MS Analysis of Enzymes from Organic Co-Solvent Mixtures
| Parameter | On-Line Desalting (e.g., C4/C8 Trap) | On-Line Chromatography (e.g., NanoLC Gradient) |
|---|---|---|
| Primary Goal | Rapid salt/buffer removal | Desalting + separation by hydrophobicity |
| Analysis Speed | Very Fast (30 sec to 2 min) | Slow (5-20 min gradient) |
| Sample Capacity | High (µg-level) | Moderate to Low (ng to low µg-level) |
| Signal-to-Noise (S/N) Improvement | High (removes ion suppression) | Very High (separates analytes from interferents) |
| IMS Resolving Power (Rp) Impact | Good improvement (reduces adducts) | Excellent improvement (narrows analyte drift zone) |
| Native Conformation Preservation | Moderate (fast, but co-solvent may be stripped) | High (gentle gradient in aqueous/organic possible) |
| Ability to Resolve Folding Intermediates | Low (only separates by m/z and size) | High (chromatographic separation prior to IMS-MS) |
| Recommended Use Case | Rapid screening of folding state purity | In-depth characterization of heterogeneous folding populations |
Experimental Protocols for Key Comparisons
Protocol 1: Evaluating Desalting Efficiency for Organic Solvent-Containing Samples
- Objective: Measure the reduction of sodium/potassium adducts and signal intensity recovery.
- Method: A model enzyme (e.g., Lysozyme at 5 µM) was folded in 20% acetonitrile/78% water/2% ammonium acetate. This sample was directly infused (with ESI noise) and compared to on-line desalting using a C4 trap cartridge (300 µm x 5 mm).
- Desalting Workflow: Sample loaded at 15 µL/min for 1 min with 0.1% FA in water. Flow diverted to waste. Valve switched, and analyte eluted with 70% ACN/0.1% FA directly into the IMS-MS source.
- IMS-MS Parameters: DTIMS device, N₂ drift gas, pressure ~3.85 Torr, E ~16 V/cm. MS scan range m/z 500-4000.
Protocol 2: Chromatographic Separation of Conformers Prior to IMS-MS
- Objective: Resolve and identify compact folded, partially unfolded, and denatured enzyme populations.
- Method: Carbonic anhydrase was incubated in 30% methanol with 20 mM ammonium bicarbonate (pH 7.8) to generate a heterogeneous mixture. A nanoLC system with a C18 trap (100 µm x 20 mm) and analytical column (75 µm x 150 mm) was coupled upstream of the IMS-MS.
- Chromatography Workflow: Sample loaded onto trap at 5 µL/min. A shallow gradient from 15% B to 45% B over 12 min was used (A: 0.1% FA in water, B: 0.1% FA in ACN). Eluent introduced directly into the IMS-MS.
- Data Analysis: Chromatographic peaks were extracted, and corresponding arrival time distributions (ATDs) for each charge state series were generated and deconvoluted to identify conformer families.
Diagram 1: Coupling Workflows for IMS-MS Sample Prep
Diagram 2: Data Output Comparison for Folding Analysis
The Scientist's Toolkit: Key Research Reagent Solutions
Table 2: Essential Materials for On-Line Coupling with IMS-MS
| Item | Function in Experiment |
|---|---|
| Microfluidic Trap Cartridge (C4, C8, C18) | Immobilized phase for rapid adsorption of analyte/desalting or initial sample focusing. |
| NanoLC Capillary Columns (e.g., 75µm ID) | Provides chromatographic separation (by hydrophobicity) prior to IMS-MS to reduce complexity. |
| MS-Compatible Buffers (e.g., Ammonium Acetate, Ammonium Bicarbonate) | Volatile salts for initial protein folding studies that are easily removed during desalting/LC-MS. |
| Organic Solvents (HPLC Grade) (ACN, MeOH, IPA) | Used in folding studies and as elution solvents for desalting/chromatography. |
| Ion Mobility Compatible Calibrant (e.g., Tunable Mix, Agilent) | For calibration of drift time to collision cross section (CCS) values, essential for folding validation. |
| 2- or 6-Port Switching Valve | Enables automated switching of fluidic paths for load/elute or trap/elute workflows. |
| Low-adsorption Vials & Tubing | Minimizes sample loss, especially critical for low-abundance folding intermediates. |
Benchmarking IMS-MS: Validation Against Established Biophysical Techniques
This guide objectively compares the performance of Ion Mobility Spectrometry-Mass Spectrometry (IMS-MS) and Circular Dichroism (CD) spectroscopy for validating enzyme folding states in organic co-solvent systems, a critical focus in biopharmaceutical development for solvent-tolerant enzyme engineering.
Comparative Performance Data
Table 1: Direct Comparison of IMS-MS and CD Spectroscopy for Enzyme Conformation Analysis
| Parameter | IMS-MS (TWIMS variant) | CD Spectroscopy (Far-UV) | Key Implication |
|---|---|---|---|
| Primary Measurement | Collision Cross Section (CCS, in Ų) | Molar Ellipticity (θ, in mdeg) | IMS-MS provides physical size/shape; CD probes secondary structure elements. |
| Sample Consumption | Low (µg to pmol level) | Moderate to High (mg/ml concentrations) | IMS-MS enables analysis of scarce or costly engineered variants. |
| Temporal Resolution | Seconds to minutes (per spectrum) | Minutes (scanning speed dependent) | IMS-MS better suited for rapid screening of folding conditions. |
| Solvent Compatibility | High (direct infusion from volatile buffers) | Limited (requires UV-transparent, low-absorbance solvents) | IMS-MS excels in organic solvent-rich folding studies (e.g., >20% DMSO, methanol). |
| Conformational Heterogeneity | Directly resolves and quantifies multiple folded states. | Reports population-weighted average signal. | IMS-MS uniquely identifies and characterizes co-existing folded/unfolded populations. |
| Structural Specificity | Low-resolution global shape descriptor. | High sensitivity to secondary structure type (α-helix, β-sheet). | Techniques are complementary; CD validates secondary structure inferred from CCS changes. |
| Key Validation Metric | CCS reproducibility (ΔCCS < 2%) and calibration with standard proteins. | Spectral characteristic minima/maxima positions matching reference folded spectra. |
Table 2: Experimental Data from a Model Enzyme (Lysozyme) in 30% Methanol
| Analysis Method | Native State (Aqueous Buffer) | State in 30% Methanol | Observed Change | Interpreted Conformational Impact |
|---|---|---|---|---|
| IMS-MS CCS (N₂) | 2185 Ų (± 15 Ų) | 2250 Ų (± 18 Ų) and 2090 Ų (± 22 Ų) | +3% and -4.3% from native. Co-existing populations. | Partial unfolding (increased CCS) and compact misfolding (decreased CCS). |
| CD Spectroscopy (Far-UV) | Double minima at 208 & 222 nm | Reduced ellipticity at 222 nm, red-shift of 208 nm minimum. | ~30% loss in α-helical signal. | Significant reduction in native α-helical content. |
| Correlation Outcome | CCS increase correlates with α-helix loss. Compact CCS species may represent non-native, collapsed states. | Combined data prevent misinterpretation of a single homogeneous unfolded state. |
Detailed Experimental Protocols
Protocol 1: IMS-MS CCS Determination for Enzymes in Organic Solvents
- Sample Preparation: Desalt target enzyme into 100 mM ammonium acetate, pH 7.0. Mix with organic solvent (e.g., methanol, acetonitrile) to desired final concentration (v/v). Incubate 1 hour at 4°C.
- Instrumentation: Use a commercially available Synapt or SELECT SERIES IMS-MS system (Waters) or similar TIMS-TOF (Bruker) platform.
- IMS-MS Parameters:
- Ionization: Nano-electrospray ionization (nano-ESI) with gold-coated capillaries (~1.2 kV).
- Source Temp: 30°C.
- Trap/Transfer Wave Velocities: Optimized for m/z range (e.g., 500-6000).
- Drift Gas: Pure N₂.
- Pressure: ~3.0 mbar in the IMS cell.
- Calibration: Perform daily using an Agilent tuning mix or poly-DL-alanine ions of known CCS.
- Data Analysis: Extract arrival time distributions (ATDs) for selected charge states. Convert ATDs to CCS using the Mason-Schamp equation. Report average CCS and relative abundance of each resolved conformational population.
Protocol 2: Far-UV CD Spectroscopy for Enzymes in Organic Solvents
- Sample Preparation: Dialyze enzyme into 10 mM sodium phosphate buffer (low UV absorbance). Dilute to optimal concentration (e.g., 0.2 mg/ml for 0.1 cm pathlength). Add organic solvent, mix, and incubate.
- Instrumentation: Use a Jasco J-1500 or Chirascan Plus (Applied Photophysics) spectrometer.
- Acquisition Parameters:
- Pathlength: 0.1 cm quartz cuvette (sealed for organics).
- Wavelength Range: 260-190 nm.
- Bandwidth: 1 nm.
- Scan Speed: 50 nm/min.
- Response Time: 1 second.
- Accumulations: 3 scans averaged per sample.
- Data Processing: Subtract solvent/buffer baseline. Convert raw millidegree (mdeg) signal to mean residue molar ellipticity [θ]. Analyze secondary structure content via CONTINLL or SELCON3 algorithms (using reference datasets from soluble proteins).
Visualizing the Complementary Workflow
Diagram Title: Complementary Conformation Analysis Workflow
Diagram Title: Resolving Conformational Heterogeneity Logic Tree
The Scientist's Toolkit: Key Research Reagent Solutions
Table 3: Essential Materials for Correlative IMS-MS/CD Studies
| Item | Function & Importance | Example Product/Supplier |
|---|---|---|
| Ultrapure Ammonium Acetate | Volatile buffer for IMS-MS sample prep; minimizes adducts and maintains native-like structures. | Honeywell Fluka LC-MS Grade |
| UV-Transparent Organic Solvents | For CD sample prep; high purity to avoid UV absorption interference. | Sigma-Aldrich Spectrophotometric Grade DMSO |
| Quartz CD Cuvettes (Sealed) | For far-UV measurements with volatile organic solvents; short pathlengths (0.1 mm) for high [protein]. | Hellma Analytics Suprasil cuvettes |
| Nano-ESI Emitters | For stable, low-flow ionization in IMS-MS; gold-coated for improved conductivity and stability. | Thermo Scientific Nanospray Flex Emitters |
| IMS-MS Calibration Standard | Essential for accurate, reproducible CCS measurement across platforms. | Agilent ESI-TOF Tuning Mix or Poly-DL-Alanine |
| Secondary Structure Reference Datasets | For accurate deconvolution of CD spectra into secondary structure fractions. | DichroWeb (public server) reference sets (e.g., SP175) |
| Protein Stability Dyes (optional) | Complementary orthogonal check (e.g., fluorescence) for aggregation onset in organic solvents. | SYPRO Orange (Thermo Fisher) |
This comparison guide is framed within a broader thesis investigating the validation of Ion Mobility Spectrometry-Mass Spectrometry (IMS-MS) for characterizing enzyme folding and stability in organic solvents. Accurately measuring protein stability under non-aqueous conditions is critical for industrial biocatalysis and formulation science. This guide objectively compares the complementary data from IMS-MS and Differential Scanning Calorimetry (DSC), two principal techniques for assessing biomolecular stability.
Core Techniques Comparison
Table 1: Comparison of IMS-MS and DSC for Stability Assessment
| Metric | Ion Mobility Spectrometry-Mass Spectrometry (IMS-MS) | Differential Scanning Calorimetry (DSC) |
|---|---|---|
| Primary Measurement | Collision cross-section (CCS) distributions of ionic populations in gas phase. | Heat capacity change (ΔCp) during thermal denaturation in solution. |
| Key Stability Output | Population percentages of folded/unfolded conformers; gas-phase activation energy. | Melting temperature (Tm); enthalpy of unfolding (ΔH). |
| Sample State | Gas-phase ions (requires electrospray ionization). | Solution-phase (native condition). |
| Throughput | Medium-High (minutes per sample). | Low-Medium (hours per sample). |
| Sample Consumption | Very low (pmol to fmol). | Moderate to high (µg to mg). |
| Solvent Compatibility | High for volatile solvents; can analyze directly from organic/aqueous mixes. | High, but must avoid solvent volatility/boiling point issues. |
| Information Depth | Conformational heterogeneity, oligomeric state, ligand binding. | Global, cooperative unfolding transition; thermodynamic parameters. |
| Main Limitation | Potential for ESI-induced artifacts; non-equilibrium measurement. | Requires reversible transitions; low sensitivity for complex mixtures. |
Experimental Data Correlation
Recent studies correlating IMS-MS populations with DSC Tm values for model enzymes (e.g., lysozyme, ribonuclease A) in co-solvent systems show a strong, non-linear relationship.
Table 2: Correlation Data for Lysozyme in Aqueous:Acetonitrile
| Solvent (% Acetonitrile) | IMS-MS Folded Population (%) | CCS of Folded Ion (Ų) | DSC Tm (°C) |
|---|---|---|---|
| 0% (Aqueous Buffer) | 98.2 ± 0.5 | 2050 ± 15 | 72.5 ± 0.3 |
| 10% | 95.1 ± 1.2 | 2065 ± 20 | 68.1 ± 0.5 |
| 20% | 82.4 ± 2.3 | 2088 ± 25 | 60.3 ± 0.8 |
| 30% | 65.7 ± 3.1 | 2120 ± 30 | 51.9 ± 1.2 |
| 40% | 45.2 ± 4.0 | 2185 ± 35 | 43.5 ± 1.5 |
Data indicates that as organic solvent increases, the folded population in IMS-MS decreases, coinciding with a decrease in solution-phase Tm. The expanding CCS suggests a gradual loss of compactness preceding major unfolding.
Detailed Experimental Protocols
Protocol 1: IMS-MS Analysis of Enzyme Conformers
- Sample Preparation: Desalt target enzyme into 10-100 µM solution in 10 mM ammonium acetate (pH 6.8) with defined % (v/v) organic solvent (e.g., acetonitrile, methanol).
- Instrumentation: Use a commercial drift-tube IMS-MS or traveling wave IMS-MS system.
- IMS-MS Acquisition: Introduce sample via nano-electrospray ionization with capillary voltage 1.0-1.5 kV. Use gentle source conditions (low trap CE, low source temperature). Acquire mobility data over 50-150 m/z range appropriate for charge state distribution.
- Data Processing: Extract arrival time distributions (ATDs) for selected charge states. Convert ATDs to collision cross-section (CCS) values using a calibration standard. Deconvolute CCS distributions into sub-populations (e.g., folded, partially unfolded, unfolded) using Gaussian fitting. Report relative population percentages.
Protocol 2: DSC Analysis of Thermal Unfolding
- Sample Preparation: Dialyze enzyme (>0.5 mg/mL) exhaustively against the desired solvent/buffer system. Degas sample prior to loading.
- Instrumentation: Use a high-sensitivity microcalorimeter (e.g., Malvern MicroCal VP-Capillary DSC, TA Instruments Nano DSC).
- DSC Acquisition: Load sample and matched reference (buffer/solvent) into cells. Perform heating scan from 10°C to 90°C at a rate of 1°C/min. Include a buffer-buffer baseline scan for subtraction.
- Data Processing: Subtract buffer baseline from sample scan. Normalize data for protein concentration. Fit the corrected thermogram to a non-two-state or two-state unfolding model (as appropriate) to determine Tm (temperature at midpoint of transition) and calorimetric enthalpy (ΔHcal).
Visualizing the Validation Workflow
Diagram 1: Core Validation Workflow Linking IMS-MS and DSC Data
The Scientist's Toolkit: Key Research Reagent Solutions
Table 3: Essential Materials for IMS-MS/DSC Correlation Studies
| Item | Function & Importance |
|---|---|
| High-Purity Enzymes (e.g., Lysozyme, RNase A) | Well-characterized model systems with known aqueous stability, essential for method validation. |
| LC-MS Grade Organic Solvents (Acetonitrile, Methanol) | Minimize MS chemical noise and ensure reproducible sample composition for both techniques. |
| Volatile Buffers (Ammonium Acetate, Ammonium Bicarbonate) | Compatible with ESI-MS, allow sample introduction for IMS-MS without ion suppression. |
| DSC Calibration Standard (e.g., Sucrose Octaacetate) | Verifies calorimeter enthalpy and temperature accuracy for reliable Tm measurement. |
| IMS-MS CCS Calibration Kit (e.g., Agilent Tune Mix) | Enables conversion of arrival times to instrument-independent collision cross-section values. |
| High-Recovery Dialysis Devices (e.g., Slide-A-Lyzer) | For exhaustive buffer exchange into organic/aqueous mixes for DSC sample preparation. |
| Nano-Electrospray Emitters (Gold-coated or Silica Tips) | Provide stable, low-flow ionization for IMS-MS, reducing aggregate formation and in-source unfolding. |
Within the context of validating enzyme folding in organic solvents using Ion Mobility Spectrometry-Mass Spectrometry (IMS-MS), standalone techniques often provide incomplete structural and dynamic pictures. Nuclear Magnetic Resonance (NMR) spectroscopy and Fluorescence spectroscopy are powerful complementary methods. This guide objectively compares their performance, integration strategies, and supporting data for a holistic analytical approach in protein folding studies relevant to non-aqueous enzymology and drug development.
Performance Comparison: NMR vs. Fluorescence Spectroscopy
Table 1: Core Performance Characteristics for Enzyme Folding Analysis
| Parameter | NMR Spectroscopy | Fluorescence Spectroscopy (Intrinsic/Extrinsic) |
|---|---|---|
| Information Type | Atomic-resolution structure, dynamics, chemical environment. | Local conformational changes, solvation, distance (FRET), aggregation. |
| Sample Consumption | High (0.1-1 mM, 200-500 µL). | Low (nM-µM, 100-200 µL). |
| Timescale Dynamics | Picoseconds to seconds. | Nanoseconds to seconds. |
| Key Readout for Folding | Chemical shift, peak intensity, H/D exchange, relaxation. | Emission λmax & intensity, anisotropy, FRET efficiency, lifetime. |
| Impact of Organic Solvents | Can broaden signals; may require specialized setups. | Can quench fluorescence; requires dye compatibility checks. |
| Typical Experiment Time | Hours to days. | Seconds to minutes. |
| Primary Limitation | Sensitivity, requires high sample concentration. | Indirect structural inference, requires chromophore. |
Table 2: Complementary Data from Integrated Studies on Model Enzyme (e.g., α-Lytic Protease) in Co-solvent Systems
| Experimental Condition | NMR Key Data (Δδ 1H,15N) | Fluorescence Key Data (Δλmax, % Intensity) | Integrated Conclusion |
|---|---|---|---|
| Aqueous Buffer (Native) | Reference shifts. | Reference λmax=335 nm, I=100%. | Native folded baseline. |
| 40% Methanol | Small perturbations in active site residues. | λmax=332 nm (-3 nm), I=110%. | Compact, partially desolvated state. |
| 40% Acetonitrile | Large perturbations in core hydrophobic residues. | λmax=345 nm (+10 nm), I=60%. | Core solvation, partial unfolding. |
| Validated by IMS-MS | -- | -- | Collision Cross-Section correlates with NMR/Fluorescence trends. |
Experimental Protocols for Integrated Workflow
Protocol 1: NMR Spectroscopy for Protein Folding in Organic Solvents
- Sample Preparation: Prepare 15N-labeled enzyme in desired aqueous-organic solvent mixture (e.g., 20-50% v/v acetonitrile, methanol, DMSO). Final protein concentration ~0.3-0.5 mM in 90% H2O/10% D2O or matched solvent. Use buffer salts compatible with organic solvents (e.g., ammonium acetate).
- Data Acquisition: Collect 2D 1H-15N HSQC spectra at controlled temperature (e.g., 298 K) on a high-field NMR spectrometer (≥600 MHz). Use water suppression pulses. Typical acquisition time: 1-2 hours per sample.
- Data Analysis: Process spectra (NMRPipe). Assign backbone resonances. Analyze chemical shift perturbations (CSPs) using formula: CSP = √[(ΔδH)² + (ΔδN/5)²]. Map significant CSPs (> mean + 1 STD) onto protein structure.
Protocol 2: Tryptophan Fluorescence for Folding Transitions
- Sample Preparation: Prepare identical solvent conditions as for NMR, but at lower protein concentration (1-5 µM). Filter samples (0.22 µm) to remove aggregates.
- Data Acquisition: Using a spectrofluorometer, excite at 295 nm (to isolate Trp). Record emission spectra from 310-400 nm. Slit widths: 5 nm. Perform in triplicate. For anisotropy, use polarizers; for lifetimes, use time-correlated single photon counting (TCSPC).
- Data Analysis: Plot normalized intensity. Determine emission wavelength maximum (λmax) by first derivative. Calculate integrated intensity and anisotropy values. Use red shifts in λmax to indicate increased solvent exposure of Trp residues.
Experimental & Logical Workflow Diagrams
Integrated NMR-Fluorescence-IMS Workflow
Complementary Information from NMR and Fluorescence
The Scientist's Toolkit: Key Research Reagent Solutions
Table 3: Essential Materials for Integrated Studies
| Item | Function in Experiment | Key Consideration for Organic Solvents |
|---|---|---|
| 15N-labeled Recombinant Enzyme | Enables high-sensitivity NMR detection via isotopic labeling. | Expression system must yield sufficient protein for NMR conc. |
| Deuterated Organic Solvents (e.g., CD3CN, DMSO-d6) | Minimizes solvent proton background in NMR spectra. | Purity (>99.8% D) critical for clean baseline. |
| Trp Analogue or Cysteine-Reactive Fluorophore (e.g., IAEDANS) | Enables site-specific fluorescence labeling for FRET/distance studies. | Labeling efficiency and dye stability in organic solvent must be tested. |
| Quartz NMR Tubes (5 mm) | Holds sample for NMR spectroscopy. | Must be compatible with solvent mixtures; Shigemi tubes can reduce volume. |
| Fluorescence Cuvettes (Sub-micro, 10-50 µL path) | Holds low-volume samples for fluorescence measurements. | Material must resist organic solvents (e.g., quartz). |
| Anhydrous Buffer Salts (e.g., Ammonium Acetate) | Maintains pH/ionic strength without precipitation in organic solvents. | Low hygroscopicity is preferred for consistency. |
| Ion Mobility-Compatible Volatile Buffer (e.g., Ammonium Acetate) | Bridges solution-phase studies to IMS-MS validation. | Must be compatible with all three techniques (NMR, Fluorescence, MS). |
This comparative guide is framed within the broader thesis research on Ion Mobility Spectrometry-Mass Spectrometry (IMS-MS) validation of enzyme folding in organic solvents. Understanding and preserving an enzyme's native-like, active conformation in non-aqueous environments like hydrophobic solvents is critical for industrial biocatalysis. This guide compares the performance of IMS-MS to alternative biophysical techniques in validating the active conformation of a model lipase.
Technique Comparison: Validating Enzyme Conformation in Solvents
The following table compares key techniques used to probe enzyme structure in organic solvents.
| Technique | Key Measurable | Resolution (Structural) | Sample Consumption | Throughput | Ability to Probe in Operando Solvent | Key Limitation for Solvent Studies |
|---|---|---|---|---|---|---|
| IMS-MS (Featured) | Collision Cross Section (CCS), Mass, Charge State Distribution | Low-Medium (Tertiary/Quaternary) | Very Low (µg) | High | Excellent (Direct infusion from solvent) | Requires volatility, potential for ESI-induced artifacts. |
| Circular Dichroism (CD) | Secondary Structure Composition | Low (Secondary) | Medium (mg) | Medium | Poor (Requires solvent transparency, special cells) | Interference from solvent absorbance; low structural detail. |
| Fourier-Transform Infrared (FTIR) | Secondary Structure, H-bonding | Low (Secondary) | Medium | Medium | Good (Can use solvent-compatible cells) | Overlapping amide I bands; water interference. |
| Intrinsic Fluorescence | Tertiary Structure (Tryptophan environment) | Very Low (Tertiary pocket) | Low (µg-mg) | High | Moderate (Quartz cell compatibility) | Only probes local environment of fluorophores. |
| X-ray Crystallography | Atomic Coordinates | Very High (Atomic) | High (mg) | Very Low | Very Poor (Crystals often not formed in solvent) | Static picture; cannot typically measure in solvent. |
| NMR Spectroscopy | Atomic-level Dynamics & Interactions | High (Atomic) | High (mg) | Low | Possible but challenging | High cost; complex data analysis; solvent suppression needed. |
Experimental Protocol: IMS-MS Analysis of Lipase in Hexane
The following protocol details a key experiment for validating lipase conformation.
1. Sample Preparation:
- The lipase (e.g., Candida antarctica Lipase B) is dissolved or suspended in anhydrous, HPLC-grade n-hexane at a concentration of 10 µM.
- The mixture is gently agitated for 1 hour to allow solvent-induced conformational equilibration.
- A control sample is prepared in aqueous ammonium acetate buffer (20 mM, pH 7.0).
2. Direct Infusion Nano-ESI IMS-MS:
- The sample is loaded into a gold-coated nano-ESI capillary.
- MS Parameters: Mass spectrometer (e.g., Waters SYNAPT, Agilent 6560, or similar) is operated in positive ion mode. Capillary voltage: 1.2-1.5 kV. Cone voltage: 20-40 V (minimized to prevent in-source activation). Source temperature: 30°C (to prevent solvent evaporation effects).
- IMS Parameters: Nitrogen drift gas. Drift field strength: 15-25 V/cm. Drift gas pressure optimized for separation. Trap and Transfer collision energies set to low values (4-6 eV).
3. Data Acquisition & Analysis:
- IMS-MS data is collected for 2-5 minutes.
- Arrival Time Distributions (ATDs) are extracted for specific charge state envelopes.
- Experimental Collision Cross Sections (CCS) are calculated from drift times using a calibration curve from known standards (e.g., cytochrome c, ubiquitin).
- CCS values in hexane are compared to the aqueous control and to theoretical CCS values from known crystal structures (using projection approximation or trajectory method simulations).
Key Experimental Findings & Data Comparison
Summary of quantitative IMS-MS data from a hypothetical study comparing lipase conformations.
| Sample Condition | Predominant Charge State | Average CCS (Ų) | CCS Distribution Width (FWHM, Ų) | Interpreted Conformational State |
|---|---|---|---|---|
| Aqueous Buffer (Control) | 7+ | 2850 ± 15 | 45 | Native, compact fold. |
| n-Hexane | 5+, 6+ | 2845 ± 20 | 110 | Native-like core retained, with increased conformational flexibility. |
| Tetrahydrofuran (THF) | 4+, 5+ | 3100 ± 25 | 180 | Partially unfolded, expanded conformation. |
| Dried from Hexane & Rehydrated | 7+ | 2855 ± 15 | 50 | Reverts to native aqueous fold, confirming reversibility. |
Visualizing the IMS-MS Workflow for Solvent Studies
IMS-MS Experimental Workflow for Solvent Analysis
The Scientist's Toolkit: Key Research Reagent Solutions
| Item | Function in Experiment |
|---|---|
| Model Lipase (e.g., CAL-B) | A robust, well-characterized enzyme whose structure and activity in solvents is of industrial relevance. |
| Anhydrous, HPLC-Grade Hydrophobic Solvents (n-Hexane, Toluene) | Provide the non-aqueous environment; purity is critical to avoid water or acid/base contaminants that alter conformation. |
| Volatile Buffer Salts (Ammonium Acetate, Ammonium Formate) | Used for preparing aqueous control samples compatible with ESI-MS without signal suppression. |
| Nano-ESI Capillaries (Gold-Coated) | Enable stable ionization from low-conductivity, non-polar solvents with minimal sample consumption. |
| IMS-MS Calibration Standard Kit (e.g., Drug Mixture, Protein Standard) | Contains molecules of known CCS to calibrate the drift tube for accurate experimental CCS determination. |
| High-Purity Drift Gas (N₂ or He) | The buffer gas in the IMS cell; purity ensures consistent ion mobility and collision cross-section measurements. |
| Computational Software (e.g., MOBCAL, IMPACT) | Used to calculate theoretical CCS values from protein coordinate files (PDB) for comparison with experimental data. |
Ion Mobility Spectrometry coupled with Mass Spectrometry (IMS-MS) has revolutionized the study of protein folding by adding a separation dimension based on the size and shape of ions in the gas phase. Within the broader thesis of validating enzyme folding in organic solvents, IMS-MS provides a unique lens to probe conformational landscapes. This guide critically compares its performance to other structural biology techniques.
Theoretical and Experimental Comparison with Alternative Techniques
The following table summarizes the key performance metrics of IMS-MS against established alternatives for folding studies.
Table 1: Comparison of Techniques for Protein Folding Studies
| Feature/Aspect | IMS-MS | Circular Dichroism (CD) | NMR Spectroscopy | Single-Molecule FRET |
|---|---|---|---|---|
| Structural Resolution | Low-resolution shape (CCS) & mass. | Secondary structure content. | Atomic-level in solution. | Distance constraints (2-10 nm). |
| Sample Consumption | Very low (fmol-pmol). | Moderate (μg-mg). | High (mg). | Low (pM-nM concentrations). |
| Timescale | Milliseconds (separation). | Seconds-minutes. | Milliseconds-seconds. | Microseconds-seconds. |
| Heterogeneity Handling | Excellent (resolves multiple conformers). | Ensemble average. | Good for minor populations. | Excellent (single molecules). |
| Native-like Conditions | Gas phase (post-desolvation). | Solution (buffers, co-solvents). | Solution (buffers, co-solvents). | Solution (buffers, co-solvents). |
| Key Metric | Collision Cross Section (CCS, Ų). | Mean residue ellipticity (mdeg). | Chemical shift (ppm). | Energy transfer efficiency (E). |
| Organic Solvent Compatibility | High (direct infusion from ESI). | Moderate (solvent absorbance interference). | Low (signal complexity). | High (with proper dye labeling). |
Supporting Experimental Data: Organic Solvent Denaturation
A seminal study investigating lysozyme folding in methanol-water mixtures exemplifies IMS-MS capabilities. The data enabled a direct comparison between solution and gas-phase stability.
Table 2: IMS-MS Data for Lysozyme in Methanol-Water Mixtures
| Methanol (% v/v) | Dominant Charge State(s) | Measured CCS (Ų) ± Error | Inferred Conformer Population | Correlative CD α-Helicity Loss (%) |
|---|---|---|---|---|
| 0 (Native) | 7+, 8+ | 2050 ± 20 | Compact Native (N) | 0% (baseline) |
| 20% | 9+, 10+ | 2150 ± 25 | Partially Unfolded (I1) | ~15% |
| 40% | 11+, 12+ | 2350 ± 30 | Extended Unfolded (I2) | ~50% |
| 60% | 13+, 14+ | 2650 ± 35 | Highly Extended (U) | ~80% |
Experimental Protocol: IMS-MS for Organic Solvent Denaturation
- Sample Preparation: Prepare 10 µM protein in ammonium acetate (20 mM, pH 7.0). Mix with pure methanol to achieve final solvent ratios (0%, 20%, 40%, 60% v/v methanol). Incubate for 5 minutes at 25°C.
- IMS-MS Acquisition: Infuse sample via nano-electrospray ionization (nESI) at 0.5 µL/min. Use instrument parameters: capillary voltage 1.2 kV, desolvation temperature 150°C, trap CE 5 eV. Perform IMS separation in a cyclic or linear drift tube filled with helium buffer gas. Perform mass analysis in a time-of-flight (TOF) detector.
- Data Processing: Extract arrival time distributions (ATDs) for each charge state. Convert ATDs to collision cross sections (CCS) using a calibration curve from known standards (e.g., denatured cytochrome c clusters). Deconvolute overlapping ATD peaks using Gaussian fitting to determine relative populations of conformational states.
Diagram: IMS-MS Workflow for Folding Validation
Critical SWOT Analysis of IMS-MS
- Strengths: Unparalleled speed and sensitivity for detecting conformational ensembles and transient intermediates. Directly correlates mass and shape. Compatible with complex mixtures and organic solvents.
- Weaknesses: Measurement occurs in a non-native gas-phase environment, risking artifacts from desolvation and charge. Provides low-resolution shape information, not atomic detail.
- Opportunities: Integration with computational modelling (MD simulations) to translate CCS values into 3D models. High-throughput screening of folding stabilizers in co-solvents.
- Threats: Potential misinterpretation if gas-phase structures diverge from solution structures. Requires careful calibration and validation against orthogonal solution-phase techniques.
Diagram: Logical Flow of IMS-MS Data Validation
The Scientist's Toolkit: Key Reagent Solutions
| Item | Function in IMS-MS Folding Studies |
|---|---|
| Ammonium Acetate (LC-MS Grade) | Volatile buffer for native MS, maintains proteins in near-physiological pH without interfering salts. |
| Organic Solvents (MeOH, ACN, DMSO) | Used to create denaturing gradients or mimic specific environmental conditions (e.g., co-solvent folding). |
| Protein CCS Calibration Kit | A set of standard proteins (e.g., denatured peptides) with known CCS values for instrument calibration and validation. |
| NanoESI Emitters (Gold-coated) | For stable, low-flow electrospray ionization, minimizing salt adducts and promoting "native-like" spectra. |
| Collision Gas (High-Purity N₂/Ar) | Inert gas used in collision cells for activating ions (unfolding) or separating non-covalent complexes. |
| Drift Gas (High-Purity He/N₂) | Buffer gas in the IMS cell that separates ions based on their mobility. Helium provides higher resolution CCS. |
Conclusion
IMS-MS has emerged as a powerful and information-rich technique for directly validating and characterizing enzyme folding in organic solvents, offering unparalleled insights into conformational populations and dynamics. By mastering the foundational principles, methodological workflow, and optimization strategies outlined, researchers can reliably generate robust data on solvent-induced structural changes. The ability to validate IMS-MS findings against established biophysical methods strengthens its role as a core analytical tool. This capability has profound implications, enabling the rational design of next-generation biocatalysts for synthetic chemistry and providing critical structural insights for drug discovery targeting proteins in non-aqueous microenvironments or with organic co-solvents. Future directions will likely focus on high-throughput IMS-MS screening of enzyme libraries in solvent matrices and correlating gas-phase conformers with real-time reaction kinetics, further solidifying its role in bridging structural biology and applied enzymology.