Mastering CRISPRi for Metabolic Pathway Regulation: A Comprehensive Guide for Research & Therapeutic Development
This article provides a comprehensive overview of CRISPR interference (CRISPRi) as a powerful tool for precise metabolic pathway regulation.
Mastering CRISPRi for Metabolic Pathway Regulation: A Comprehensive Guide for Research & Therapeutic Development
Abstract
This article provides a comprehensive overview of CRISPR interference (CRISPRi) as a powerful tool for precise metabolic pathway regulation. It serves researchers, scientists, and drug development professionals by covering foundational principles, detailed methodological workflows for gene knockdown in metabolic networks, strategies for troubleshooting common experimental challenges, and frameworks for validating and comparing results against alternative technologies. The content synthesizes the latest research to equip the audience with practical knowledge for applying CRISPRi to optimize metabolic flux, engineer cell factories, and explore novel therapeutic targets.
What is CRISPRi and Why is it Revolutionary for Metabolic Engineering?
Application Note: CRISPRi for Targeted Metabolic Pathway Repression
This application note details the implementation of CRISPR interference (CRISPRi) for the systematic downregulation of genes within metabolic pathways, a core methodology for the thesis "CRISPRi-mediated Metabolic Flux Control for Bioproduction Optimization." Unlike CRISPR-Cas9 nuclease-based editing, CRISPRi utilizes a catalytically "dead" Cas9 (dCas9) fused to transcriptional repressor domains (e.g., KRAB) to bind DNA and block transcription initiation or elongation without cleaving the genome, enabling reversible, multiplexable, and high-throughput gene knockdown.
Quantitative Comparison: CRISPRi vs. CRISPR Knockout & RNAi Table 1: Key performance metrics for gene repression technologies.
| Parameter | CRISPRi (dCas9-KRAB) | CRISPR Knockout (Cas9) | RNA Interference (shRNA) |
|---|---|---|---|
| Mechanism | Transcriptional block | DNA double-strand break | mRNA degradation/silencing |
| Repression Efficiency | 70-99% (varies by sgRNA) | ~100% (frameshift) | 70-90% (off-target common) |
| Reversibility | Reversible | Irreversible | Partially reversible |
| Multiplexing Capacity | High (arrayed sgRNAs) | Moderate | Low |
| Off-Target Effects | Minimal (DNA binding) | Moderate (cleavage) | High (seed-based) |
| Primary Use Case | Tunable repression, essential genes, pathway tuning | Gene elimination, loss-of-function studies | Rapid knockdown, partial repression |
Protocol 1: Establishing a CRISPRi System in E. coli for Metabolic Flux Analysis
Objective: Repress a target gene (e.g., pykF) in the central carbon metabolism to redirect flux toward a desired product.
Materials: The Scientist's Toolkit Table 2: Essential research reagents for prokaryotic CRISPRi.
| Reagent / Solution | Function | Example (Source) |
|---|---|---|
| dCas9-KRAB Expression Vector | Constitutively expresses S. pyogenes dCas9 fused to KRAB repressor. | pNAD-dCas9 (Addgene #125614) |
| sgRNA Expression Plasmid | Contains target-specific sgRNA under inducible (aTc) promoter. | pNAD-sgRNA (Addgene #125615) |
| Chemically Competent Cells | Engineered host strain (e.g., BW25113 ΔrecA) for pathway studies. | Keio Collection derivatives |
| Anhydrotetracycline (aTc) | Inducer for sgRNA expression; enables tunable repression. | Sigma-Aldrich, 37919 |
| qPCR Primers | Quantify transcriptional knockdown of target gene versus control. | Designed via Primer-BLAST (NCBI) |
| LC-MS/MS Kit | Analyze metabolic flux changes (e.g., accumulation of pathway intermediates). | Agilent 6470B system with kit |
Workflow:
- sgRNA Design: Design a 20-nt guide sequence targeting the non-template strand within -50 to +300 bp relative to the Transcription Start Site (TSS) of pykF. Use validated design tools (e.g., CRISPick, CHOPCHOP).
- Cloning: Anneal oligonucleotides encoding the sgRNA and clone into the BsaI site of the pNAD-sgRNA plasmid. Transform into cloning strain, sequence-verify.
- System Assembly: Co-transform the verified sgRNA plasmid and the pNAD-dCas9 plasmid into the target E. coli production strain.
- Induction & Culture: Inoculate transformants in media ± 100 ng/mL aTc. Grow to mid-log phase.
- Validation:
- qPCR: Harvest cells, extract RNA, synthesize cDNA. Perform qPCR for pykF and a housekeeping gene (e.g., rpoD). Calculate fold repression.
- Phenotypic Assay: Measure growth (OD600) and product titer (e.g., succinate) via HPLC over 24h.
- Flux Analysis: Perform ¹³C-metabolic flux analysis on induced vs. uninduced cultures using LC-MS/MS data.
Protocol 2: Multiplexed CRISPRi Screening in Human Cells for Drug Target Identification
Objective: Identify genes in a cholesterol biosynthesis pathway whose repression sensitizes cells to a statin drug.
Materials:
- Lentiviral dCas9-KRAB Pool: HEK293T cells stably expressing dCas9-KRAB (Cell Line, Sigma CLL1147).
- sgRNA Library: Pooled lentiviral library targeting all genes in the mevalonate pathway with 5 sgRNAs/gene + non-targeting controls.
- Selection Agents: Puromycin (for sgRNA selection), Simvastatin (statin drug).
- NGS Reagents: Kit for sgRNA amplicon sequencing (Illumina, Nextera XT).
Workflow:
- Virus Production & Transduction: Produce lentivirus from the sgRNA library pool. Transduce dCas9-KRAB cells at low MOI (<0.3) to ensure single integration. Select with puromycin.
- Drug Challenge: Split cell population. Treat one arm with simvastatin (IC₂₀ dose) and maintain a DMSO control arm for 10-14 days.
- Genomic DNA Extraction & Sequencing: Harvest genomic DNA from both populations. PCR amplify integrated sgRNA cassettes, index, and sequence on an Illumina platform.
- Bioinformatic Analysis: Align reads to the sgRNA library reference. Use MAGeCK or similar tool to identify sgRNAs enriched or depleted in the drug-treated versus control condition. Genes with depleted sgRNAs represent candidate sensitizers.
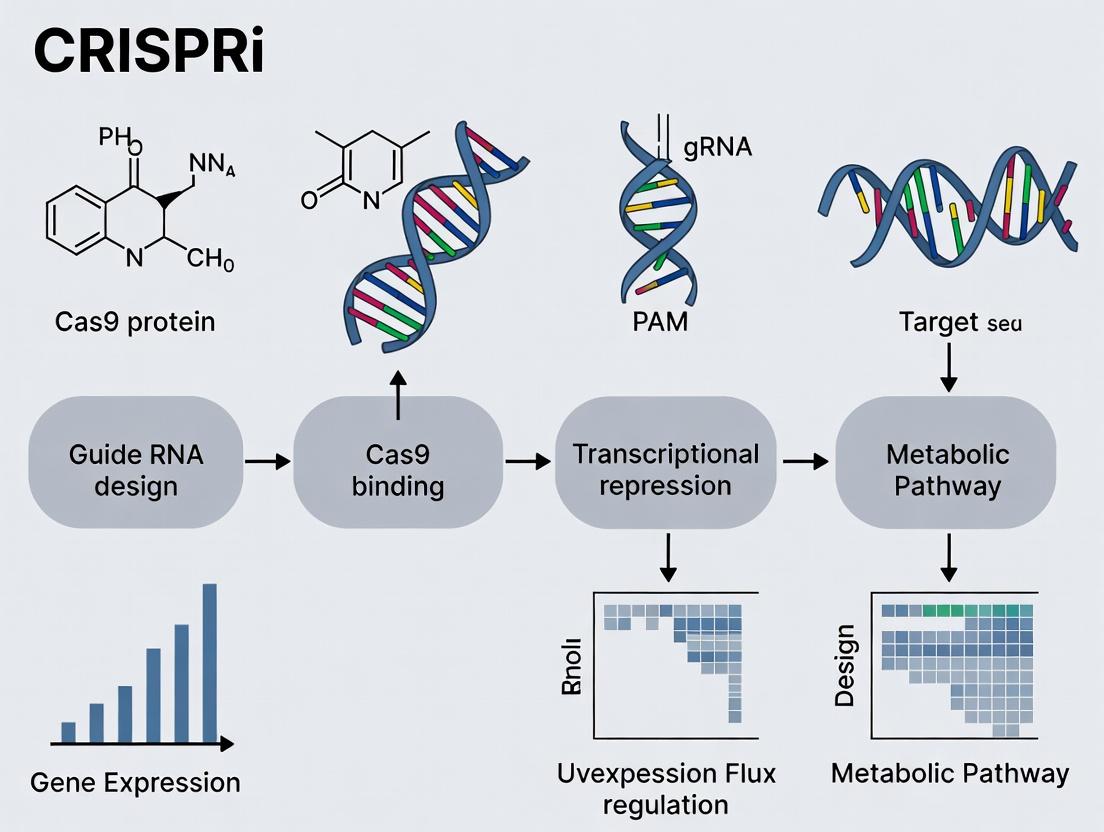
Workflow for a CRISPRi metabolic engineering experiment.
Molecular mechanism of CRISPRi repression at the promoter.
Within the broader thesis on CRISPR interference (CRISPRi) for metabolic pathway regulation research, this document details the core mechanisms and protocols for implementing targeted gene silencing. CRISPRi, utilizing a catalytically dead Cas9 (dCas9) fused to transcriptional repressors, offers a reversible, specific, and programmable method for downregulating gene expression without altering the DNA sequence. This is particularly valuable for probing metabolic network flux, identifying essential genes, and optimizing bioproduction in microbial and mammalian systems.
Core Components & Mechanism
dCas9 Fusion Proteins
The dCas9 protein (commonly derived from S. pyogenes) contains point mutations (D10A and H840A) that inactivate its nuclease activity while preserving its ability to bind DNA via guide RNA (gRNA) complementarity. For effective silencing, dCas9 is fused to transcriptional repression domains.
Key Fusion Partners:
- KRAB (Krüppel-Associated Box): A mammalian epigenetic repressor domain that recruits heterochromatin-forming complexes, leading to stable gene silencing.
- Mxi1: A mammalian transcriptional repression domain.
- ω-Subunit of E. coli RNA Polymerase: Used for bacterial CRISPRi, physically blocking transcription elongation.
Guide RNA (gRNA) Design Principles
gRNA specificity is paramount. The gRNA comprises a ~20 nucleotide spacer sequence complementary to the target DNA (protospacer) and a scaffold sequence that binds dCas9.
Design Rules:
- Target Strand: For bacterial CRISPRi, gRNAs targeting the template (non-coding) strand of the gene are significantly more effective at blocking RNA polymerase.
- Target Region: The optimal target is the 5' region of the gene open reading frame (ORF), specifically from the transcription start site (TSS) to ~100 bp downstream. Silencing efficiency drops sharply beyond -50 bp upstream of the TSS.
- Avoid Off-Targets: Perform BLAST searches to ensure minimal homology (especially in the 8-12 base "seed" region proximal to the PAM) to other genomic loci.
- PAM Sequence: For Sp-dCas9, the protospacer must be adjacent to a 5'-NGG-3' Protospacer Adjacent Motif (PAM). The PAM is on the non-target strand, 3' of the target sequence.
Table 1: Quantitative Metrics for gRNA Design Efficiency
| Design Parameter | Optimal Value/Range | Efficiency Impact |
|---|---|---|
| Target Region (from TSS) | +1 to +100 bp (ORF) | >90% silencing potential |
| Target Region (from TSS) | -50 to -1 bp (Promoter) | ~50% silencing potential |
| gRNA Length | 20 nt | Standard balance of specificity and efficacy |
| GC Content | 40-60% | Improves stability and reduces off-targets |
| Seed Region (bases 1-12) | High specificity mandatory | Primary determinant of on-target specificity |
Application Notes for Metabolic Pathway Regulation
CRISPRi enables multiplexed, tunable knockdowns to map metabolic flux and identify bottlenecks. A pooled library of gRNAs targeting all genes in a pathway can be transduced into a cell population expressing dCas9-KRAB (mammalian) or dCas9-ω (bacterial). Subsequent selection pressure (e.g., substrate shift, toxin production) enriches for gRNAs that confer a fitness advantage when their target gene is silenced, revealing key regulatory nodes.
Key Advantages for Metabolic Research:
- Reversibility: Unlike knockout, silencing is titratable and reversible, allowing study of essential genes.
- Multiplexing: Simultaneous knockdown of multiple pathway genes.
- Precision: Targets specific isoforms or operon genes without polar effects (if gRNAs are designed appropriately).
Detailed Protocols
Protocol 1: Design and Cloning of gRNA Expression Constructs for Bacterial CRISPRi
Objective: Clone a single gRNA targeting a metabolic gene into a plasmid co-expressing dCas9-ω. Materials: See "Scientist's Toolkit" below. Workflow:
- Identify Target Site: Using reference genome, locate the template strand within the first 100 bp of the target gene ORF, with an adjacent 5'-NGG-3' PAM.
- Design Oligonucleotides: Synthesize two complementary oligos (24-27 nt each) corresponding to the target sequence, with 5' overhangs compatible with your chosen cloning site (e.g., BsaI for Golden Gate assembly).
- Forward oligo: 5'-AAAC-[20-nt target sequence]-3'
- Reverse oligo: 5'-C-[reverse complement of target sequence]-AAA-3'
- Annealing & Phosphorylation: Mix 1 µL of each oligo (100 µM), 1 µL T4 Ligation Buffer, 0.5 µL T4 PNK, and 6.5 µL nuclease-free water. Incubate: 37°C for 30 min; 95°C for 5 min; ramp down to 25°C at 5°C/min.
- Digestion & Ligation (Golden Gate): Assemble 50 ng of destination plasmid, 1 µL diluted annealed oligo duplex, 1 µL BsaI-HFv2, 1 µL T4 DNA Ligase, 2 µL 10X T4 Ligase Buffer, and water to 20 µL. Cycle: (37°C for 5 min, 20°C for 5 min) x 25 cycles; then 50°C for 5 min, 80°C for 5 min.
- Transformation: Transform 2-5 µL reaction into competent E. coli, plate on selective agar, and sequence-validate colonies.
Protocol 2: Validation of Gene Silencing via RT-qPCR
Objective: Quantify knockdown efficiency of a target metabolic gene. Workflow:
- Sample Preparation: Transform validated gRNA plasmid + dCas9 plasmid (or single construct) into host cells. Include non-targeting gRNA control. Grow biological triplicates to mid-log phase.
- RNA Extraction & DNase Treatment: Use a commercial kit. Treat with RNase-free DNase.
- cDNA Synthesis: Use 1 µg total RNA with a reverse transcriptase kit and random hexamers.
- qPCR Setup: Prepare reactions with SYBR Green master mix, gene-specific primers, and cDNA template. Include a stably expressed housekeeping gene (e.g., rpoB for bacteria, GAPDH for mammals).
- Cycling: 95°C for 3 min; (95°C for 15 sec, 60°C for 30 sec, 72°C for 30 sec) x 40 cycles.
- Analysis: Calculate ∆∆Ct relative to the non-targeting gRNA control. Report silencing as percentage of control expression.
Visualizations
Title: CRISPRi Mechanism in Metabolic Pathway Context
Title: gRNA Design Decision Flowchart
The Scientist's Toolkit
Table 2: Essential Research Reagent Solutions for CRISPRi Implementation
| Item | Function/Benefit | Example/Catalog Consideration |
|---|---|---|
| dCas9-Repressor Plasmids | Stable expression of the silencing effector protein. | Addgene #110821 (pAC154-dCas9-ω for E. coli), #71237 (pHREd-iCas9-KRAB for mammalian). |
| gRNA Cloning Backbone | Vector for expressing custom gRNAs, often with antibiotic resistance. | Addgene #104174 (pCRISPRi), containing a BsaI site for Golden Gate assembly. |
| Golden Gate Assembly Kit | Efficient, one-pot digestion/ligation for gRNA insertion. | NEB Golden Gate Assembly Kit (BsaI-HFv2). |
| Competent Cells | For plasmid propagation and as eventual CRISPRi host. | High-efficiency cloning strains (NEB Stable), target organism strains. |
| RT-qPCR Kit | Gold-standard for quantifying mRNA knockdown levels. | SYBR Green-based 1-step or 2-step kits compatible with your organism. |
| Next-Gen Sequencing Library Prep Kit | For validating gRNA representation in pooled screens. | Kits for amplicon sequencing of the gRNA region (e.g., Illumina). |
| Validated Silencing Control gRNA | Positive control targeting a non-essential, highly expressed gene. | e.g., gRNA targeting lacZ in suitable strains. |
| Non-Targeting Scrambled gRNA | Critical negative control for assay normalization. | A gRNA with no significant genomic match. |
Application Notes
Metabolic engineering aims to rewire cellular metabolism for the efficient production of fuels, chemicals, and therapeutics. Traditional genetic knockouts are permanent and can burden cell growth. CRISPR interference (CRISPRi) offers a powerful, precise alternative for metabolic pathway regulation by using a catalytically dead Cas9 (dCas9) fused to a transcriptional repressor to downregulate target genes without altering the genome. Its core advantages are:
- Reversibility: Repression is titratable and can be lifted, allowing dynamic control and study of essential genes.
- Tunability: Repression strength can be modulated via guide RNA design, promoter engineering, or inducer concentration.
- Multiplexing Potential: Multiple genes can be targeted simultaneously by expressing arrays of guide RNAs, enabling coordinated pathway modulation.
These features make CRISPRi ideal for balancing flux, reducing toxic intermediate accumulation, and probing complex metabolic networks in real-time.
Table 1: Performance Metrics of CRISPRi vs. Traditional Knockouts in Metabolic Engineering
| Parameter | CRISPRi-based Repression | Traditional Gene Knockout | Notes / Source |
|---|---|---|---|
| Repression Efficiency | 70% - 99.5% | 100% (complete) | Efficiency depends on guide RNA position & strength of repressor domain (e.g., Mxi1, KRAB). |
| Reversal Timeframe | Hours to 1-2 generations | Permanent | Reversal by stopping inducer or expressing anti-sgRNAs. |
| Multiplexing Capacity | Up to 5-7 genes routinely; demonstrated >10 genes | Typically 1-3 genes (due to cumulative fitness cost) | Multiplexing limited by transformation efficiency and guide RNA expression stability. |
| Impact on Growth Rate | Often minimal to moderate | Can be severe, especially for essential pathways | CRISPRi's titratable nature allows fine-tuning to minimize burden. |
| Titratable Range (Fold-Change) | 1.5 to >1000-fold repression | Not applicable (all-or-nothing) | Achieved via promoter engineering of dCas9 or sgRNA, or using inducible systems. |
Table 2: Key CRISPRi System Components for Metabolic Regulation
| Component | Common Variants | Optimal Use Case in Metabolism |
|---|---|---|
| dCas9 Protein | dCas9 (S. pyogenes), dCas12 (Cpf1) | dCas9: Most common, extensive guide libraries. dCas12: Smaller size, different PAM for targeting AT-rich regions. |
| Repressor Domain | KRAB, Mxi1, SID4x | KRAB: Strong repression in mammalian cells. Mxi1: Effective in bacteria (E. coli). SID4x: Very strong repression in yeast. |
| sgRNA Scaffold | Wild-type, modified (e.g., tRNA-sgRNA) | Modified scaffolds enhance stability and multiplexing via processing systems. |
| Promoter for sgRNA | Constitutive (J23119), Inducible (araBAD, tet) | Inducible promoters enable temporal control and reversibility studies. |
| Delivery Method | Plasmid, Chromosomal Integration | Chromosomal integration of dCas9 ensures stability for long-term fermentation studies. |
Detailed Experimental Protocols
Protocol 1: Multiplexed CRISPRi Knockdown for Balancing a Branched Metabolic Pathway
Objective: To simultaneously repress 3 genes in a competitive branched pathway in E. coli to shift flux toward a desired product.
Materials:
- E. coli strain with integrated dCas9-Mxi1 under IPTG control.
- pCRISPRi-Array plasmid (contains a tRNA-flanked sgRNA expression array).
- Primers for cloning target-specific spacer sequences (20-nt).
- Product titer analysis kits (e.g., HPLC, GC-MS).
Procedure:
- sgRNA Array Design: Select 20-nt spacer sequences targeting the NGG PAM region near the transcription start site (-50 to +300) of genes geneA, geneB, and geneC. Design oligonucleotides with overhangs compatible with the BsaI Golden Gate cloning site in the pCRISPRi-Array plasmid, incorporating tRNA-Gly sequences between each spacer.
- Cloning: Assemble the sgRNA array via a one-pot Golden Gate reaction: Mix 50 ng linearized plasmid, 10 fmol of each annealed oligo duplex, 10 U BsaI-HFv2, 100 U T7 DNA ligase, 1x T4 DNA ligase buffer. Cycle: (37°C for 5 min, 16°C for 5 min) x 25 cycles; then 50°C for 5 min, 80°C for 5 min.
- Transformation: Transform assembled plasmid into the dCas9-expressing E. coli strain via electroporation. Select on appropriate antibiotic plates.
- Induction & Cultivation: Inoculate single colonies into media with antibiotic and 0.1 mM IPTG to induce dCas9 expression. Grow in deep-well plates for 48-72 hours.
- Validation & Analysis:
- qPCR: Harvest cells, extract RNA, and perform qPCR for geneA, geneB, and geneC to quantify transcript knockdown.
- Metabolite Analysis: Centrifuge culture broth, filter supernatant, and analyze product/intermediate concentrations via HPLC.
- Reversibility Test: Wash cells from an induced culture and resuspend in fresh media without IPTG. Monitor transcript recovery and metabolite profile over 4-6 hours.
Protocol 2: Titrating Repression Strength via sgRNA Promoter Engineering
Objective: To achieve fine-grained control of a single metabolic enzyme's activity by varying sgRNA transcription levels.
Materials:
- Library of constitutive promoters with known relative strengths (e.g., J23100 series).
- dCas9-expressing strain.
- Flow cytometer or plate reader (if using a fluorescent reporter).
Procedure:
- Promoter Library Cloning: Clone the same target-specific sgRNA spacer sequence downstream of a series of constitutive promoters (e.g., strong, medium, weak) into a single-copy vector.
- Strain Generation: Transform each promoter-sgRNA construct into the dCas9 host strain.
- Cultivation: Grow all strains in biological triplicate in 96-well plates.
- Phenotypic Assessment:
- Growth: Monitor OD600 over time. Repression of essential genes will show promoter strength-correlated growth defects.
- Reporter Readout: If targeting a gene in a pathway leading to/from a fluorescent product (e.g., carotenoid), measure fluorescence/OD.
- Enzyme Activity: Perform cell lysate-based enzymatic assays specific to the target protein.
- Correlation Analysis: Plot promoter strength (e.g., reference GFP unit) against growth rate, product titer, or enzyme activity to establish the titration curve.
Diagrams
Title: CRISPRi Multiplexing to Balance a Branched Metabolic Pathway
Title: Tunability via sgRNA Promoter Engineering for Metabolic Control
The Scientist's Toolkit
Table 3: Essential Research Reagent Solutions for CRISPRi Metabolic Studies
| Reagent / Material | Function & Role in Metabolic Regulation | Example Product/Catalog |
|---|---|---|
| dCas9-Repressor Plasmid/Strain | Provides the programmable DNA-binding and repression machinery. Foundation of the CRISPRi system. | Addgene #122196 (pCRISPRi-dCas9-Mxi1 for E. coli). Chromosomal dCas9 strains (e.g., E. coli ML406). |
| Golden Gate sgRNA Cloning Kit | Enables rapid, modular assembly of single or multiplexed sgRNA expression cassettes. Essential for high-throughput targeting. | Tool kits with BsaI sites (Addgene #1000000059) or commercial synthetic biology assembly kits. |
| Promoter Library for sgRNA | Set of well-characterized promoters of varying strengths to titrate sgRNA dosage and fine-tune repression levels. | Constitutive promoter libraries (J23100 series) or inducible promoter variants (Tet-On, AraBAD). |
| Metabolite Analysis Standards & Kits | Quantifies changes in metabolic flux and product yield—the ultimate readout for regulation success. | Certified analytical standards for target metabolites. HPLC/GC-MS sample prep kits. |
| RT-qPCR Master Mix with DNase | Validates transcriptional knockdown efficiency of targeted metabolic genes before phenotypic analysis. | One-step SYBR Green or probe-based kits with integrated genomic DNA removal. |
| Chromosomal Integration System | Stably incorporates the dCas9 gene into the host genome, removing plasmid burden and improving stability for fermentation. | Lambda Red recombineering kits or transposase-based integration systems (e.g., Tn7). |
| sgRNA Spacer Design Software | Identifies optimal, high-efficiency target sequences within metabolic genes while minimizing off-target effects. | CHOPCHOP, Benchling CRISPR design tools, or species-specific design algorithms. |
Application Notes: CRISPRi for Metabolic Flux Modulation
CRISPR interference (CRISPRi) enables precise, multiplexable, and titratable repression of target genes by utilizing a catalytically dead Cas9 (dCas9) fused to transcriptional repressor domains (e.g., KRAB, Mxi1). This technology is uniquely suited for reprogramming metabolic networks without permanently altering the genome, allowing for dynamic control from central carbon metabolism to the biosynthesis of high-value secondary metabolites.
Key Advantages for Metabolic Engineering:
- Multiplexing: Simultaneous repression of multiple pathway nodes to overcome regulatory complexity and redistribute metabolic flux.
- Tunability: Repression strength can be modulated via guide RNA design (targeting non-template strand for strongest repression) and promoter engineering.
- Reversibility: Unlike knockout strains, CRISPRi effects are reversible, enabling dynamic studies and condition-dependent pathway control.
- High-Throughput Screening: CRISPRi libraries facilitate genome-scale identification of gene knockdowns that enhance product titers.
Critical Quantitative Parameters for Effective CRISPRi Design:
| Parameter | Typical Target Range | Impact on Repression Efficiency |
|---|---|---|
| dCas9 Repressor Fusion | dCas9-KRAB, dCas9-Mxi1 | KRAB provides strong repression in eukaryotes; Mxi1 is effective in bacteria. |
| Guide RNA (gRNA) Length | 20-nt spacer sequence | Standard length; truncation (17-18nt) can reduce off-target effects with moderate activity loss. |
| Target Strand | Non-template (NT) strand | Targeting NT strand yields ~5-10 fold stronger repression than template strand targeting. |
| Target Region | -50 to +300 bp relative to TSS | Maximal repression when targeting -35 to -10 bp (promoter) or early coding sequence (≤+50 bp). |
| Promoter Strength (gRNA) | Medium strength (e.g., J23119 in E. coli) | Balances expression needs; very strong promoters may increase off-target binding. |
| Repression Efficiency | 70% - 99+% knockdown | Varies with target gene, gRNA efficiency, and cellular context. |
| Multiplex Capacity | 4-10 genes simultaneously | Limited by delivery vector size and potential gRNA crosstalk; use tRNA or ribozyme arrays. |
Protocols for CRISPRi-Mediated Metabolic Pathway Regulation
Protocol 2.1: Design and Assembly of a CRISPRi Module forE. coliCentral Carbon Metabolism
Objective: Construct a plasmid for tunable repression of the pfkA (phosphofructokinase) gene to shift flux from glycolysis to the pentose phosphate pathway.
Materials (Research Reagent Solutions):
| Item | Function & Key Consideration |
|---|---|
| dCas9 Expression Vector (e.g., pDCA109, Addgene #125182) | Source of dCas9-Mxi1 repressor under inducible control (e.g., aTc). |
| gRNA Cloning Vector (e.g., pCRISPomyces-2, Addgene #122267) | Backbone for expressing single or multiplexed gRNAs. |
| Q5 High-Fidelity DNA Polymerase (NEB) | For error-free PCR amplification of inserts and verification. |
| Golden Gate Assembly Mix (BsaI-HFv2, NEB) | Enables modular, scarless assembly of multiple gRNA expression units. |
| Chemically Competent E. coli DH5α | For plasmid cloning and propagation. |
| Analytical Grade Anhydrotetracycline (aTc) | Inducer for dCas9 expression; use at 100-200 ng/mL final concentration. |
| RT-qPCR Kit (e.g., Luna Universal, NEB) | To quantify mRNA knockdown levels. |
| Seahorse XFe96 Analyzer Flux Kit | To measure extracellular acidification rate (glycolysis) and oxygen consumption rate (OXPHOS). |
Procedure:
- gRNA Design: Using a design tool (e.g., CHOPCHOP), select two gRNAs targeting the non-template strand of pfkA within the -50 to +50 region relative to the TSS. Include BsaI-compatible overhangs for Golden Gate assembly.
- Oligo Annealing: Synthesize and anneal oligonucleotide pairs for each gRNA spacer to form double-stranded inserts.
- Golden Gate Assembly: Assemble the annealed oligos into the BsaI-digested gRNA vector backbone in a one-pot reaction (37°C for 1hr, then 50°C for 5min, 80°C for 5min).
- Transformation: Transform the assembled plasmid into competent E. coli DH5α, plate on selective agar, and incubate overnight.
- Validation: Isolate plasmid DNA from colonies and verify insert sequence by Sanger sequencing using a vector-specific primer.
- Co-transformation: Co-transform the validated gRNA plasmid and the dCas9 expression plasmid into your production E. coli strain (e.g., BL21(DE3)).
- Induction & Analysis: Grow cultures to mid-log phase, induce dCas9 expression with aTc (200 ng/mL). After 4 hours, harvest cells for RT-qPCR analysis of pfkA mRNA and measure metabolic flux shifts via Seahorse assay or targeted metabolomics (e.g., GC-MS for sugar phosphate intermediates).
Protocol 2.2: Multiplexed CRISPRi Screening for Secondary Metabolism Enhancement inS. cerevisiae
Objective: Identify gene knockdowns in competing pathways that enhance titers of the secondary metabolite amorphadiene (precursor to artemisinin).
Materials (Research Reagent Solutions):
| Item | Function & Key Consideration |
|---|---|
| Yeast dCas9-KRAB Strain (e.g., yMS strains, BY4741 background) | Engineered host with genomic integration of dCas9-KRAB under a GAL1 promoter. |
| CRISPRi Library Plasmid Pool | Pooled plasmids expressing gRNAs targeting ~100 genes in sterol, lipid, and competing isoprenoid pathways. |
| Frozen-EZ Yeast Transformation II Kit (Zymo Research) | For high-efficiency yeast transformation with plasmid libraries. |
| Synthetic Drop-out Media (-URA) | For selection of gRNA plasmid maintenance. |
| Galactose | Inducer for dCas9-KRAB expression (2% final concentration). |
| GC-MS System | For quantifying intracellular amorphadiene titers. |
| MiSeq System (Illumina) | For sequencing gRNA inserts from pooled populations pre- and post-selection. |
Procedure:
- Library Transformation: Transform the pooled CRISPRi gRNA library (~5,000 CFU per gRNA) into the yeast dCas9-KRAB strain using the high-efficiency protocol. Plate on -URA glucose media to select for transformants without inducing dCas9.
- Library Recovery & Induction: Pool all colonies, inoculate into liquid -URA media with 2% raffinose. At OD600 ~0.5, induce dCas9-KRAB by adding galactose (2% final) for 24 hours.
- Selection Pressure: Subculture induced cells into production medium (e.g., YPD) and continue cultivation for 72-96 hours to allow phenotypic divergence.
- Sample Collection & Analysis: Harvest cells at T0 (post-induction) and Tfinal. Extract genomic DNA from both pools for NGS library prep to track gRNA abundance. In parallel, extract and quantify amorphadiene from culture supernatants (Tfinal) via GC-MS.
- NGS & Hit Identification: Amplify the gRNA region from gDNA, sequence on MiSeq. Align reads to the library manifest. Enriched gRNAs in the Tfinal pool (statistical analysis, e.g., MAGeCK) represent knockdowns that enhance production.
- Validation: Clone individual hit gRNAs, transform into fresh host, and validate amorphadiene titer improvement in small-scale cultures.
Visualization: Pathways and Workflows
Diagram 1: CRISPRi-Mediated Flux Control in Central Carbon Metabolism
Diagram 2: CRISPRi Screening Workflow for Metabolic Engineering
Within the broader thesis on CRISPRi for metabolic pathway regulation research, this application note compares the strategic advantages of gene knockdown via CRISPR interference (CRISPRi) against traditional gene knockout methods. For metabolic engineering and drug target validation, the ability to precisely tune gene expression levels, rather than completely eliminate gene function, often provides superior insights into pathway dynamics and essential gene functions.
Comparative Analysis: CRISPRi vs. Traditional Knockout
Table 1: Key Methodological and Outcome Comparisons
| Feature | Traditional Gene Knockout (e.g., CRISPR-Cas9, Homologous Recombination) | CRISPRi (dCas9-based repression) |
|---|---|---|
| Primary Action | Permanent disruption of DNA sequence. | Reversible, transcription-level repression without altering DNA. |
| Expression Control | All-or-nothing (null allele). | Tunable knockdown (0-95% repression). |
| Multiplexing Ease | Moderate; requires multiple DSB repairs. | High; multiple sgRNAs can target many genes simultaneously. |
| Reversibility | Irreversible. | Reversible (via sgRNA withdrawal or inducer washout). |
| Off-Target Effects | Permanent indels at off-target sites. | Typically transient transcriptional misregulation. |
| Best Applications | Studying absolute gene essentiality, generating stable cell lines. | Studying dose-dependent gene effects, fine-tuning metabolic fluxes, essential gene interrogation. |
| Typical Repression/KO Efficiency | 70-100% frameshift indel rate. | 70-95% transcriptional repression, dependent on sgRNA design. |
Table 2: Impact on Metabolic Pathway Studies – Quantitative Outcomes
| Parameter | Traditional Knockout | CRISPRi Knockdown | Experimental Insight |
|---|---|---|---|
| Essential Gene Analysis | Lethal, precluding study. | Viable; allows titration to sub-lethal levels. | Enables study of gene function and bypass mechanisms. |
| Metabolite Titer Change | Often binary (zero or wild-type). | Continuous gradient correlating with knockdown level. | Identifies optimal expression windows for yield maximization. |
| Flux Control Coefficient | Cannot be calculated (zero flux). | Can be precisely measured at multiple flux levels. | Reveals true enzymatic control within network. |
| Adaptive Evolution | Frequent compensatory mutations. | Reduced selective pressure for suppressors. | More stable phenotype during long-term cultivation. |
Detailed Protocols
Protocol 1: CRISPRi Platform Setup for Metabolic Gene Repression
Objective: Establish a stable CRISPRi system in E. coli or mammalian cells for titratable gene repression.
Materials: See "Research Reagent Solutions" below.
Method:
- dCas9 Expression Vector Integration: Deliver a lentiviral (mammalian) or plasmid-based (bacterial) vector expressing a catalytically dead Cas9 (dCas9) fused to a transcriptional repressor domain (e.g., KRAB for mammalian cells, Mxi1 for bacteria). Select stable polyclonal or monoclonal cell lines/populations using appropriate antibiotics (e.g., puromycin, blasticidin).
- sgRNA Library/Cloning Design: Design 3-5 sgRNAs per metabolic gene target, focusing on the non-template DNA strand near the transcriptional start site (TSS) or within the promoter region (-50 to +300 bp relative to TSS). Clone sgRNA sequences into an appropriate expression vector (e.g., U6 promoter for mammalian systems).
- Inducible System Calibration: If using an inducible promoter (e.g., aTc-inducible) for sgRNA or dCas9 expression, perform a dose-response curve. Measure target mRNA levels (via qRT-PCR) 48-72 hours post-induction across inducer concentrations to establish a repression titration curve.
- Phenotypic Screening: Transfert/transform sgRNA vectors into the dCas9-expressing cell line. Assess metabolic phenotypes 96-120 hours later (e.g., via growth assays, HPLC for metabolite quantification, or flux analysis).
Protocol 2: Comparative Experiment: Knockout vs. Tuned Knockdown of an Enzyme in a Biosynthetic Pathway
Objective: Directly compare the metabolic consequences of complete knockout versus graded knockdown of a rate-limiting enzyme (e.g., AroF in tyrosine biosynthesis).
Method: A. Traditional Knockout Arm:
- Use standard CRISPR-Cas9 with a sgRNA designed to create a double-strand break in an early exon of the target gene.
- Co-transfect with a repair template containing a selective marker (if desired) or rely on NHEJ.
- Isolate clones and verify knockout by DNA sequencing and Western blot to confirm protein absence.
- Measure endpoint metabolite titers (e.g., tyrosine, upstream substrates) in defined medium after 24-48 hours of growth.
B. CRISPRi Knockdown Arm:
- Use the stable dCas9 cell line and introduce a panel of 3 different sgRNAs targeting the same gene's promoter.
- For each sgRNA, quantify mRNA knockdown efficiency via qRT-PCR (Target CT values normalized to housekeeping gene and a non-targeting sgRNA control).
- For the most effective sgRNA, establish a repression gradient using an inducible system (see Protocol 1, Step 3).
- At multiple, defined repression levels (e.g., 50%, 80%, 95% mRNA reduction), sample cells and measure the identical metabolic endpoints as in the KO arm.
- Data Integration: Plot metabolite titer (Y-axis) against % gene expression or protein activity (X-axis). The KO data point (0% expression) anchors one end of the curve, revealing non-linear relationships and potential optimal expression windows for production.
Visualizations
Title: Decision Workflow: Gene Knockout vs. Tune-Down
Title: Metabolic Pathway with CRISPRi and KO Intervention Points
The Scientist's Toolkit: Research Reagent Solutions
Table 3: Essential Materials for CRISPRi Metabolic Studies
| Reagent Solution | Function & Rationale |
|---|---|
| dCas9-Repressor Fusion Construct (e.g., dCas9-KRAB for mammalian cells, dCas9-Mxi1 for E. coli) | Engineered protein core of CRISPRi; dCas9 binds DNA without cutting, and the repressor domain silences local transcription. |
| sgRNA Expression Vector (with Polymerase III promoter, e.g., U6, J23100) | Delivers the target-specific guide RNA. Vector backbone determines delivery method (lentivirus, electroporation) and may include fluorescent markers or inducible elements. |
| Inducible System Components (e.g., aTc/Tet-On, Dox) | Allows temporal control over sgRNA or dCas9 expression, enabling precise titration of repression levels and study of kinetic effects. |
| NGS-Based sgRNA Library (Pooled or arrayed) | For genome-scale CRISPRi screens to identify metabolic gene vulnerabilities or pathway regulators. Enables parallel assessment of hundreds/thousands of gene knockdowns. |
| Rapid RNA Extraction & qRT-PCR Kit | For essential, rapid validation of target gene knockdown efficiency before lengthy phenotypic assays. |
| Metabolite Quantification Assays (e.g., HPLC, LC-MS, enzymatic assays) | To measure the quantitative output of the perturbed metabolic pathway (e.g., product titer, byproduct accumulation). |
| Flux Analysis Reagents (e.g., 13C-labeled substrates) | For determining changes in metabolic flux distributions resulting from graded gene knockdowns, providing mechanistic insight beyond static metabolite levels. |
Step-by-Step Guide: Designing and Implementing a CRISPRi System for Pathway Modulation
Within the framework of a thesis investigating CRISPR interference (CRISPRi) for dynamic metabolic pathway regulation, selecting the optimal repressive machinery is critical. This application note compares two core dCas9 variants derived from Streptococcus pyogenes (SpdCas9) and Staphylococcus aureus (SadCas9), fused to two distinct effector domains: Kruppel-associated box (KRAB) and Max-interacting protein 1 (Mxi1). The choice impacts targeting range, repression efficiency, and suitability for diverse genetic contexts in metabolic engineering and drug target validation.
Table 1: Comparison of dCas9 Variants for CRISPRi
| Feature | SpdCas9 | SadCas9 |
|---|---|---|
| Size (aa) | 1368 | 1053 |
| Protospacer Adjacent Motif (PAM) | 5'-NGG-3' | 5'-NNGRRT-3' (or 5'-NNGRR(N)-3') |
| Targeting Density (per kb)* | ~1 site / 16 bp | ~1 site / 64 bp |
| GC-content Sensitivity | Moderate (High GC can reduce efficacy) | Lower sensitivity |
| Common Delivery Method | Plasmid, Viral (Lentivirus) | Plasmid, AAV |
| Typical Repression Efficiency | 70-95% (strongly dependent on target) | 50-85% |
*Calculated based on PAM frequency in the human genome.
Table 2: Comparison of Effector Domains for Transcriptional Repression
| Effector Domain | Origin/Class | Primary Mechanism | Best For |
|---|---|---|---|
| KRAB (Krüppel-Associated Box) | Human Zinc Finger Protein | Recruits SETDB1, HP1, promotes H3K9me3 (heterochromatin) | Stable, long-term silencing; genomic loci with permissive chromatin. |
| Mxi1 | Human Mad/Max family | Recruits Sin3/HDAC complex, deacetylates histones (H3K27ac) | Potent repression in euchromatic regions; may offer faster onset. |
Table 3: System Selection Guide for Metabolic Pathway Regulation
| Research Goal | Recommended System | Rationale |
|---|---|---|
| High-Efficiency Knockdown in a Model Organism | SpdCas9-KRAB | Most validated; high repression levels; broad sgRNA design space. |
| Targeting AT-Rich Genomic Regions | SadCas9-KRAB/Mxi1 | SadCas9's PAM provides better access to AT-rich sequences. |
| Multi-Gene Repression with Size Constraints | SadCas9-Mxi1 | Smaller size beneficial for delivery (e.g., AAV packaging). |
| Fine-Tuning of Flux in a Biosynthetic Pathway | SpdCas9-Mxi1 or SadCas9-Mxi1 | May allow for more gradable repression; potentially less epigenetic memory. |
Protocols
Protocol 1: Cloning and Validation of dCas9-Effector Constructs
Objective: Assemble expression constructs for SpdCas9/SadCas9 fused to KRAB or Mxi1. Materials: Backbone vectors (e.g., pLV-dCas9), effector domain inserts, assembly master mix, competent E. coli.
- Modular Assembly: Using Gibson or Golden Gate assembly, clone the synthesized effector domain (KRAB or Mxi1) sequence downstream of the sequence-verified dCas9 (Sp or Sa) variant in the chosen mammalian expression vector.
- Transformation: Transform assembled reaction into high-efficiency Stbl3 competent cells. Plate on selective antibiotic agar.
- Colony Screening: Pick 5-10 colonies, perform colony PCR with primers flanking the insertion site.
- Sequence Verification: Sanger sequence positive clones across the junction and entire effector domain.
- Midiprep: Scale up a verified clone for high-purity plasmid preparation (endotoxin-free for mammalian transfection).
Protocol 2: Titration of dCas9-Effector for Optimal Repression
Objective: Determine the optimal plasmid amount for maximal knockdown with minimal toxicity. Materials: HEK293T cells, dCas9-effector plasmid, sgRNA expression plasmid, transfection reagent, qPCR reagents.
- Cell Seeding: Seed 2e5 cells/well in a 24-well plate 24h prior.
- Transfection Matrix: Co-transfect a fixed amount of sgRNA plasmid (targeting a housekeeping gene like PPIB) with a gradient of dCas9-effector plasmid (e.g., 50, 100, 250, 500, 750 ng). Keep total DNA constant with filler DNA.
- Harvest: 72h post-transfection, harvest cells for RNA extraction.
- Analysis: Perform RT-qPCR for the target gene. Normalize to a non-targeted control gene (e.g., GAPDH).
- Optimal Dose Selection: Identify the plasmid dose yielding >70% repression without affecting cell viability (as measured by parallel MTT assay).
Protocol 3: Metabolic Flux Assessment via CRISPRi Repression
Objective: Measure the impact of repressing a key enzyme (e.g., HMGCR in the cholesterol pathway) on metabolic output. Materials: Stable cell line expressing dCas9-KRAB, lentiviral sgRNA vectors, LC-MS/MS, cholesterol assay kit.
- Cell Line Generation: Generate a polyclonal cell line stably expressing SpdCas9-KRAB via lentiviral transduction and blasticidin selection.
- sgRNA Transduction: Transduce stable cells with lentiviral vectors encoding non-targeting (NT) or HMGCR-targeting sgRNAs. Select with puromycin.
- Sample Preparation: At day 5 post-selection, quench cell metabolism and extract metabolites (e.g., sterol intermediates).
- Quantification:
- Target Repression: Confirm HMGCR mRNA knockdown via qPCR.
- Metabolite Profiling: Analyze key pathway intermediates (e.g., mevalonate, desmosterol) by LC-MS/MS.
- Endpoint Assay: Quantify cellular cholesterol using a fluorometric assay.
- Data Interpretation: Correlate the degree of gene repression with the reduction in downstream metabolites and end-product.
The Scientist's Toolkit: Research Reagent Solutions
| Item | Function & Application |
|---|---|
| Lentiviral dCas9-Effector Particles | For stable, long-term expression of the CRISPRi machinery in hard-to-transfect primary or stem cells. |
| All-in-One sgRNA/dCas9 Expression Vectors | Simplified delivery for screening in easily transfected cell lines (e.g., HEK293T). |
| Ready-to-Use, Sequence-Verified sgRNA Libraries | Target entire metabolic pathways (e.g., glycolysis, TCA cycle) for systematic genetic perturbation screens. |
| Validated Antibodies for H3K9me3 & H3K27ac | Chromatin immunoprecipitation (ChIP) to confirm epigenetic repression mechanism of KRAB (H3K9me3↑) and Mxi1 (H3K27ac↓). |
| Metabolite Standard Kits for LC-MS | Essential for absolute quantification of pathway intermediates (e.g., acyl-CoAs, organic acids) in flux experiments. |
| dCas9-Blocking Peptide | Controls for off-target effects in immunofluorescence or western blot using anti-dCas9 antibodies. |
Visualizations
Decision Tree for CRISPRi System Selection
Mechanisms of KRAB vs. Mxi1 Repression
CRISPRi Metabolic Screening Workflow
Within the broader thesis on CRISPR interference (CRISPRi) for metabolic pathway regulation, a critical technical challenge is the design of specific guide RNAs (gRNAs) for metabolic genes. These genes often reside in or near repetitive genomic regions, such as paralogous gene families (e.g., cytochrome P450s) or promoter elements with common transcription factor binding sites. Off-target binding in these regions can lead to unintended repression, confounding metabolic flux analyses and hindering robust phenotype-genotype correlation. This Application Note provides updated protocols and strategic considerations for designing high-specificity gRNAs targeting metabolic genes, leveraging current bioinformatic tools and validation methodologies.
Strategic Considerations for gRNA Design
Target Selection and Repeat Analysis
The first step involves meticulous analysis of the target locus within the context of the whole genome.
- Identify Repetitive Elements: Use tools like UCSC Genome Browser's "RepeatMasker" track or Ensembl to visualize low-complexity sequences, segmental duplications, and gene families near your target.
- Define Specific Target Region: For CRISPRi, target the non-template strand within 50-100 bp downstream of the transcription start site (TSS) for optimal dCas9-mediated repression. Avoid the core promoter region if it is highly conserved across multiple gene promoters.
gRNA Candidate Generation and Off-Target Prediction
Current best practices utilize a combination of algorithms to predict and score off-target sites.
- Primary Design Tools: Use CRISPRko or CRISPick (Broad Institute) which incorporate the latest specificity scoring models (e.g., CFD score, MIT specificity score).
- Cross-Verification: Run candidate gRNA sequences through multiple independent predictors such as CHOPCHOP, Cas-OFFinder, or CRISPOR. These tools search for genomic sites with up to 4-5 mismatches, bulges, or alternative PAM sequences (for non-SpCas9 variants).
Table 1: Comparison of Key gRNA Design and Off-Target Prediction Tools (2024)
| Tool Name | Primary Function | Key Specificity Score | Handles Mismatches/Bulges | Live Database Updates |
|---|---|---|---|---|
| CRISPick (Broad) | gRNA design & ranking | MIT Specificity Score, CFD Score | Yes (CFD model) | Yes |
| CHOPCHOP v3 | Target design for multiple systems | MIT Score, Off-target count | Yes | Yes |
| Cas-OFFinder | Genome-wide off-target search | N/A (provides list) | Yes (user-defined) | Dependent on genome build |
| CRISPOR v4.2 | Design & off-target analysis | MIT, CFD, Doench '16 Score | Yes | Yes |
Specificity-First Filtering Protocol
- Generate Candidates: Input your target sequence (~200bp around TSS) into CRISPick. Select "CRISPRi" as the application and the correct organism. Generate a list of ~20 candidate gRNAs.
- Filter by On-Target Score: Retain candidates with an On-Target Activity Score (e.g., Rule Set 2 score) > 0.4.
- Stringent Off-Target Filter: Critical Step: Export the top 10 candidates and input their sequences into Cas-OFFinder.
- Set parameters: Reference genome, allow up to 3 mismatches, DNA bulge size 1, RNA bulge size 1.
- Discard any gRNA with any exact match or 1-mismatch hit elsewhere in the genome.
- For gRNAs with 2- or 3-mismatch off-targets, examine the location. Discard if the off-target site is:
- Within any annotated gene (especially metabolic paralogs).
- In a regulatory region (promoter, enhancer) of another metabolic gene.
- Final Selection: From the remaining gRNAs, select the 2-3 with the highest combination of on-target score and lowest aggregate off-target score (e.g., lowest MIT specificity score).
Experimental Validation Protocol: Off-Target Binding Assessment
Despite careful in silico design, empirical validation is essential. This protocol uses targeted next-generation sequencing (NGS) to assess off-target binding in repetitive regions.
Materials & Workflow
Research Reagent Solutions Toolkit
| Item | Function | Example (Supplier) |
|---|---|---|
| dCas9 Repressor Protein | CRISPRi effector domain; binds DNA but does not cut. | dCas9-KRAB (VectorBuilder) |
| Lentiviral gRNA Expression System | For stable, tunable gRNA delivery in hard-to-transfect cells (e.g., hepatocytes). | lentiGuide-Puro (Addgene #52963) |
| Next-Generation Sequencing Kit | For deep sequencing of predicted off-target loci. | Illumina DNA Prep Kit |
| PCR Amplification Primers | Designed to amplify ~250bp regions flanking each predicted off-target site and the on-target site. | Custom, HPLC-purified |
| Commercial Genomic DNA Kit | High-purity gDNA extraction for sensitive PCR. | DNeasy Blood & Tissue Kit (Qiagen) |
| Cellular Model with Repetitive Target | A relevant model containing the repetitive metabolic gene family. | HepG2 (human P450 genes), CHO-K1 (glycosylation genes) |
Detailed Methodology
Part A: Cell Line Generation and Treatment
- Clone gRNAs: Clone the 2-3 selected gRNA sequences into the lentiviral lentiGuide-Puro vector.
- Produce Virus & Transduce: Produce lentivirus and transduce your target cell line (e.g., HepG2) at a low MOI (<1) to ensure single integration. Include a non-targeting gRNA control.
- Select and Enrich: Select transduced cells with puromycin (1-2 µg/mL) for 7 days.
- Induce Repression: If using an inducible dCas9 system (e.g., dCas9-KRAB fused to ERT2), add tamoxifen (500 nM) for 96 hours to recruit the repressor.
Part B: Genomic DNA Harvest and Amplicon Sequencing
- Extract gDNA: Harvest 1x10^6 cells per sample (test gRNAs and control). Extract gDNA using the DNeasy kit. Quantify via fluorometry.
- Design Amplicon Primers: Design primers to amplify the on-target site and all predicted off-target sites (from Step 3 of the filtering protocol, including those with 2-3 mismatches). Add Illumina adapter overhangs.
- PCR Amplification: Perform two-step PCR. First, amplify each target individually with 25 ng gDNA. Pool equimolar amounts of first-stage products. Perform a second, limited-cycle PCR to add full Illumina indices and sequencing adapters.
- Sequencing: Purify the final library and sequence on an Illumina MiSeq or NextSeq platform (2x150 bp or 2x250 bp) to achieve high-depth (>50,000x) coverage per amplicon.
Part C: Data Analysis for Binding Evidence
- Alignment: Align reads to the reference genome using BWA or Bowtie2.
- Variant Calling: Use a sensitive variant caller (e.g., GATK HaplotypeCaller) around the gRNA target site (PAM + seed region) to detect low-frequency mutations. For CRISPRi, we do not expect indels. Instead, look for:
- Depletion of reads mapping to the on-target site versus control, indicative of dCas9 occupancy blocking polymerase.
- Depletion of reads at any off-target site, which is evidence of unintended binding/repression.
- Quantification: Calculate normalized read depth (reads per million) for each amplicon in test vs. control samples. A significant drop (>30%) in depth at any locus suggests dCas9 binding.
Table 2: Example Amplicon-Seq Results for gRNA Targeting CYP3A4
| gRNA ID | On-Target (CYP3A4) Read Depth (Norm.) | Off-Target 1 (CYP3A5) Read Depth (Norm.) | Off-Target 2 (Intergenic) Read Depth (Norm.) | Pass/Fail Specificity |
|---|---|---|---|---|
| NT Control | 1.00 | 1.00 | 1.00 | - |
| gRNA-A | 0.15 | 0.95 | 1.10 | Pass |
| gRNA-B | 0.22 | 0.35 | 0.98 | Fail |
Visualizations
gRNA Design & Validation Workflow
Amplicon-seq Off-Target Validation Protocol
Within the broader thesis on employing CRISPR interference (CRISPRi) for precise metabolic pathway regulation, the design and delivery of the effector construct are foundational. CRISPRi utilizes a catalytically "dead" Cas9 (dCas9) fused to transcriptional repressors (e.g., KRAB, Mxi1) to bind specific DNA sequences and block transcription. This application note details contemporary strategies for vector architecture and delivery, enabling tunable, multiplexed gene repression across model systems.
Key Considerations:
- System Choice: Microbial systems (bacteria, yeast) favor small, high-copy plasmids with constitutive promoters. Mammalian systems require viral or non-viral delivery with careful attention to immunogenicity and long-term expression.
- Multiplexing: For regulating multiple pathway genes, arrays of guide RNAs (gRNAs) expressed from a single Pol III promoter (e.g., tRNA-gRNA) or separate Pol III promoters are standard.
- Tunability: Inducible promoters (e.g., Tet-On/Off, ATc-inducible) and degron-tagged dCas9 allow dynamic control over repression timing and strength.
Table 1: Comparison of CRISPRi Delivery Vehicles for Mammalian Systems
| Delivery Method | Max. Payload Size | Typical Efficiency (In Vitro) | Integration Risk | Primary Use Case |
|---|---|---|---|---|
| Lentivirus (LV) | ~8 kb | 70-95% (transduction) | Yes (random) | Stable cell lines, in vivo delivery, difficult-to-transfect cells. |
| Adeno-Associated Virus (AAV) | ~4.7 kb | 40-80% (transduction) | Very Low | In vivo gene therapy, primary cells. |
| Adenovirus (AdV) | ~8-36 kb | 80-95% (transduction) | No | High-efficiency transient expression, organoids. |
| Lipid Nanoparticles (LNPs) | No strict limit | 50-90% (transfection) | No | Transient delivery, clinical therapeutics. |
| Electroporation | No strict limit | 40-80% (transfection) | No | Immune cells, stem cells, primary cells. |
Table 2: Standard CRISPRi Vector Components and Options
| Vector Module | Microbial Systems | Mammalian Systems |
|---|---|---|
| Origin of Replication | High-copy (ColE1), Low-copy (SC101) | Viral LTR/ITR (LV, AAV) or none for non-viral. |
| dCas9 Repressor | dCas9 alone (bacteria), dCas9-Mxi1 (yeast) | dCas9-KRAB (strong repression in eukaryotes). |
| dCas9 Promoter | Constitutive (J23100, tetO), Inducible (Ptrc, araBAD) | Constitutive (EF1α, CAG), Inducible (Tet-On, TRE3G). |
| gRNA Scaffold | S. pyogenes or species-optimized variant. | S. pyogenes with MS2 hairpins for effector recruitment. |
| gRNA Promoter | Constitutive (J23119), tRNA promoter for processing. | Pol III (U6, H1) or Pol II with ribozyme/snoRNA for processing. |
| Selection Marker | Antibiotic resistance (Amp⁺, Kan⁺), Metabolic. | Antibiotic (Puromycin, Blasticidin), Fluorescent (GFP, mCherry). |
Detailed Experimental Protocols
Protocol 1: Construction of a Multiplex gRNA Plasmid for E. coli Metabolic Engineering Aim: To repress three genes (aceA, ldhA, ptsG) in a central carbon pathway using a single plasmid. Materials: See "Research Reagent Solutions" below. Method:
- Design gRNAs: Using design software (e.g., CHOPCHOP), select 20-nt sequences 5' of the target gene's transcription start site (-35 to +1 region). Avoid off-targets with high homology.
- Oligo Annealing: For each gRNA, order forward and reverse oligos with 5' overhangs compatible with BsaI-HFv2. Anneal oligos in a thermocycler: 95°C for 5 min, ramp down to 25°C at 0.1°C/sec.
- Golden Gate Assembly: Set up a 20 µL reaction: 50 ng BsaI-digested pCRISPomyces-2 plasmid backbone, 1 µL of each annealed gRNA oligo pair (diluted 1:200), 1 µL T4 DNA Ligase, 1 µL BsaI-HFv2, 2 µL 10x T4 Ligase Buffer. Cycle: (37°C for 5 min, 20°C for 5 min) x 25 cycles, then 50°C for 5 min, 80°C for 5 min.
- Transformation: Transform 2 µL of assembly into chemically competent E. coli DH5α, plate on LB + Spec, incubate at 37°C overnight.
- Verification: Screen colonies by colony PCR and Sanger sequencing using a universal primer flanking the gRNA array insertion site.
Protocol 2: Lentiviral Production and Transduction for Stable CRISPRi in HEK293T Cells Aim: To generate a stable mammalian cell line with inducible dCas9-KRAB expression. Materials: See "Research Reagent Solutions" below. Method:
- Viral Packaging: Seed HEK293T cells in a 6-well plate (70% confluence). Co-transfect with 3 plasmids using PEIpro transfection reagent:
- 1.0 µg psPAX2 (packaging plasmid)
- 0.5 µg pMD2.G (VSV-G envelope plasmid)
- 1.5 µg lentiviral transfer plasmid (e.g., pLV hU6-sgRNA hUbC-dCas9-KRAB-T2A-PuroR)
- Media Change: Replace media with fresh DMEM + 10% FBS 6-8 hours post-transfection.
- Harvest Virus: Collect supernatant containing lentiviral particles at 48 and 72 hours post-transfection. Pool, filter through a 0.45 µm PVDF filter, and either use immediately or aliquot and store at -80°C.
- Cell Transduction: Plate target cells (e.g., HepG2). Add filtered viral supernatant plus polybrene (8 µg/mL final concentration). Spinoculate at 800 x g for 30 min at 32°C. Return to incubator.
- Selection: 48 hours post-transduction, begin selection with puromycin (1-3 µg/mL, titrated). Maintain selection for 5-7 days to establish a stable polyclonal pool.
- Induction: For inducible systems, add doxycycline (e.g., 1 µg/mL) to the culture medium to activate dCas9-KRAB expression.
Visualizations
Title: CRISPRi Plasmid Construction Workflow for Microbes
Title: Lentiviral CRISPRi Stable Cell Line Generation
The Scientist's Toolkit: Research Reagent Solutions
Table 3: Essential Materials for CRISPRi Integration Experiments
| Item (Supplier Examples) | Function & Critical Notes |
|---|---|
| dCas9 Expression Plasmids• pLenti-dCas9-KRAB (Addgene #99373)• pCRISPomyces-2 (Addgene #61737) | Backbone vectors providing the repressor fusion (dCas9-KRAB, dCas9-Mxi1) with appropriate promoters and selection markers for the target system. |
| gRNA Cloning Vectors• pU6-sgRNA (Addgene #53186)• pMK-RQ with tRNA array | Vectors optimized for efficient insertion and expression of single or multiplexed gRNA sequences. |
| Viral Packaging Plasmids• psPAX2 (Addgene #12260)• pMD2.G (Addgene #12259) | Second-generation lentiviral packaging mix for safe production of high-titer virus in HEK293T cells. |
| High-Efficiency Competent Cells• NEB Stable E. coli• Stbl3 E. coli | Essential for cloning repetitive gRNA arrays and lentiviral plasmids without recombination. |
| Transfection Reagents• PEIpro (Polyplus)• Lipofectamine 3000 (Thermo) | For plasmid delivery into mammalian packaging (PEIpro) or target cells. |
| Selection Antibiotics• Puromycin Dihydrochloride• Spectinomycin Dihydrochloride | For selecting and maintaining plasmids or stable integrants in mammalian and microbial cells, respectively. |
| Polybrene (Hexadimethrine Bromide) | A cationic polymer that enhances viral transduction efficiency by neutralizing charge repulsion. |
| BsaI-HFv2 Restriction Enzyme (NEB) | Type IIS enzyme for Golden Gate assembly, enabling scarless, ordered insertion of gRNA sequences. |
| Next-Generation Sequencing Kit• Illumina CRISPResso2 Library Prep | For deep sequencing validation of gRNA representation and on-target efficacy in pooled screens. |
This document, framed within a broader thesis on CRISPRi for metabolic pathway regulation, provides detailed application notes and protocols for multiplexed CRISPRi. The ability to simultaneously repress multiple genes within a pathway or network is crucial for deciphering complex metabolic interactions, identifying bottlenecks, and optimizing production strains in metabolic engineering and drug development.
Core Strategies for Multiplexed CRISPRi Design
gRNA Array Configuration
Multiplexing is achieved by expressing multiple guide RNAs (gRNAs) from a single construct. The primary configurations include:
- Tandem Polymerase III Promoters: Using individual U6 or 7SK promoters for each gRNA.
- tRNA-gRNA Arrays: Exploiting endogenous RNase P and Z processing to cleave gRNAs flanked by tRNA sequences.
- Ribozyme-gRNA Arrays: Utilizing self-cleaving hammerhead (HH) and hepatitis delta virus (HDV) ribozymes to flank each gRNA.
- Csy4-gRNA Arrays: Incorporating the Pseudomonas aeruginosa Csy4 endoribonuclease recognition sequence between gRNAs for precise cleavage.
Selection Criteria: The choice depends on the organism, required gRNA expression level, and cloning efficiency. tRNA and Csy4 systems often offer more consistent processing and expression across all gRNAs in the array.
dCas9 Variant and Effector Selection
The choice of repressor impacts the dynamic range and potential for orthogonal control.
- dCas9 (S. pyogenes): The standard, effective for most bacterial and eukaryotic applications.
- dCas9-Mxi1: A fusion to a mammalian chromatin remodeling domain, enhancing repression in human cells.
- dCas9-KRAB: A potent repressor in mammalian cells via Kruppel-associated box (KRAB) domain-mediated heterochromatin formation.
- Orthogonal dCas9s (e.g., dCas12a): Enables independent regulation of two pathways simultaneously by responding to distinct gRNAs.
Quantitative Design Parameters
Key quantitative parameters for designing effective multiplexed CRISPRi systems are summarized below.
Table 1: Quantitative Design Parameters for Multiplexed CRISPRi
| Parameter | Typical Optimal Range | Impact on Repression | Measurement Method |
|---|---|---|---|
| gRNA Length | 18-22 nt (spacer) | Shorter gRNAs may reduce off-targets but also on-target efficacy. | Fluorescence Reporter Assay |
| Genomic Target Site | -50 to +10 bp from TSS | Repression is strongest when targeting the template strand near the TSS. | RNA-seq, RT-qPCR |
| dCas9 Expression Level | Moderate (avoid toxicity) | Too high causes non-specific toxicity; too low reduces efficacy. | Western Blot, Flow Cytometry |
| gRNA Processing Efficiency | >80% per site (in array) | Inefficient processing leads to variable gRNA abundance. | Northern Blot, RNA-seq |
| Multiplexing Capacity | 4-10 gRNAs/array (common) | Higher numbers risk recombination and decreased transformation efficiency. | Colony PCR, Sequencing |
Detailed Experimental Protocols
Protocol 3.1: Construction of a tRNA-gRNA Array for Bacterial Metabolic Pathway Repression
Objective: Clone a 5-gRNA array targeting key enzymes in the central carbon metabolism of E. coli.
Materials: pCRISPathBrick plasmid (or similar tRNA-array backbone), oligonucleotides for gRNA spacers, BsaI-HFv2 restriction enzyme, T4 DNA Ligase, Gibson Assembly Master Mix, competent E. coli DH5α.
Procedure:
- Design: Design gRNA spacer sequences targeting the template strand within 50 bp upstream of the TSS for each gene of interest (GOI). Add 5' G if required for U6 promoter initiation in your system.
- Oligo Annealing: For each spacer, order forward and reverse oligonucleotides with 4-bp overhangs compatible with BsaI digestion of the acceptor vector. Anneal oligos to form double-stranded inserts.
- Golden Gate Assembly: a. Set up a reaction mix: 50 ng linearized vector, 0.5 pmol of each annealed spacer duplex, 1.5 µL BsaI-HFv2, 1 µL T4 DNA Ligase, 1x T4 Ligase Buffer, in a 20 µL total volume. b. Cycle: 30x (37°C for 2 min, 16°C for 5 min), then 50°C for 5 min, 80°C for 10 min.
- Transformation: Transform 2 µL of the assembly reaction into chemically competent E. coli DH5α. Plate on selective media.
- Screening: Screen colonies by colony PCR using primers flanking the array insertion site. Confirm the sequence of the entire array via Sanger sequencing.
- Delivery: Transform the verified array plasmid and a compatible dCas9 expression plasmid into your target production strain (e.g., E. coli MG1655).
Protocol 3.2: Assessing Multiplexed Repression Efficacy via RT-qPCR
Objective: Quantify the knockdown efficiency of each target gene in the pathway.
Materials: TRIzol reagent, DNase I, reverse transcription kit, SYBR Green qPCR master mix, gene-specific primer pairs.
Procedure:
- Culture: Grow strains (containing dCas9 + gRNA array, dCas9 only, and empty vector control) to mid-log phase. Induce dCas9/gRNA expression if using an inducible system.
- RNA Extraction: Harvest 1 mL of culture. Extract total RNA using TRIzol, following manufacturer's instructions. Treat with DNase I.
- cDNA Synthesis: Use 500 ng of purified RNA for reverse transcription with random hexamers.
- qPCR: Perform qPCR in triplicate for each target gene and 2-3 reference genes (e.g., rpoB, recA). Use a standard 2-step cycling protocol.
- Analysis: Calculate fold-change using the 2^(-ΔΔCt) method, normalizing to reference genes and the dCas9-only control strain.
Table 2: Example RT-qPCR Results for a 3-gRNA Array
| Target Gene | Function in Pathway | Fold-Repression (vs. dCas9 only) | Standard Error |
|---|---|---|---|
| pgi | Glycolysis | 12.5 | ± 1.2 |
| zwf | PPP Entry | 8.7 | ± 0.9 |
| pykF | Glycolysis Output | 15.3 | ± 1.5 |
The Scientist's Toolkit: Research Reagent Solutions
Table 3: Essential Reagents for Multiplexed CRISPRi Experiments
| Reagent/Kit | Function | Example Vendor/Part Number |
|---|---|---|
| CRISPathBrick or MoClo Toolkit Vectors | Modular plasmids for easy assembly of gRNA arrays via Golden Gate cloning. | Addgene (#1000000058) |
| dCas9 Expression Plasmid | Constitutively or inducibly expresses catalytically dead Cas9. | Addgene (#46569 for E. coli) |
| BsaI-HFv2 Restriction Enzyme | High-fidelity Type IIS enzyme for Golden Gate assembly, minimizes star activity. | NEB (#R3733) |
| Phusion High-Fidelity DNA Polymerase | For high-fidelity PCR of backbone fragments and screening. | Thermo Fisher (#F530L) |
| SYBR Green qPCR Master Mix | For sensitive and quantitative measurement of gene expression changes. | Bio-Rad (#1725121) |
| TRIzol/RNA Isolation Kit | For reliable total RNA extraction from bacterial or mammalian cells. | Invitrogen (#15596026) |
| Flow Cytometry Competent Cells | For high-efficiency transformation of large, repetitive array constructs. | Lucigen (#60210-2) |
| Next-Generation Sequencing Service | For deep sequencing to verify array integrity and assess potential off-target effects. | Illumina, Eurofins |
Visualizations
Multiplexed CRISPRi Experimental Workflow
CRISPRi Repression of Competing Pathways
Application Note: CRISPRi for Isobutanol Production inE. coli
Thesis Context: This study demonstrates the precision of CRISPRi for dynamic flux redistribution in central carbon metabolism, a core principle for optimizing biofuel pathways.
Objective: To enhance isobutanol yield in E. coli by repressing competing pathways (mixed-acid fermentation) without genetic knockouts, enabling dynamic control.
Key Quantitative Results:
Table 1: Impact of CRISPRi-mediated Gene Repression on Isobutanol Production in E. coli.
| Target Gene (Pathway) | Repression Efficiency (%) | Isobutanol Titer (g/L) | Yield (g/g Glucose) | Reference Strain Titer (g/L) |
|---|---|---|---|---|
| ldhA (Lactate) | 85 | 11.2 | 0.28 | 4.1 |
| frdB (Succinate) | 78 | 9.8 | 0.24 | 4.1 |
| pta (Acetate) | 92 | 13.5 | 0.33 | 4.1 |
| adhE (Ethanol) | 88 | 8.5 | 0.21 | 4.1 |
| pta + ldhA (Dual) | >90 (each) | 15.8 | 0.38 | 4.1 |
Experimental Protocol:
A. CRISPRi Strain Construction for E. coli:
- dCas9 Expression Cassette: Integrate a constitutive promoter (e.g., J23100) driving dCas9 (with a C-terminal SV40 NLS) and a downstream transcriptional terminator (e.g., BBa_B0015) into a neutral genomic site (e.g., attTn7) using λ-Red recombineering.
- sgRNA Clone Construction: a. Design 20-nt spacer sequences complementary to the non-template strand near the -10 or -35 region of the target gene's promoter or early coding sequence. b. Synthesize oligonucleotides, anneal, and clone into the BsaI site of a sgRNA expression plasmid (e.g., pTargetF derivative) containing a J23119 promoter and a E. coli optimized sgRNA scaffold.
- Transformation: Co-transform the dCas9-expressing strain with the sgRNA plasmid (or integrate sgRNA cassette chromosomally). Select on appropriate antibiotics (e.g., Kanamycin for genome, Spectinomycin for plasmid).
B. Fermentation and Analysis:
- Pre-culture: Inoculate single colonies in LB medium with antibiotics. Grow overnight at 37°C, 250 rpm.
- Main Culture: Dilute pre-culture 1:100 into defined M9 minimal medium with 2% glucose and antibiotics. Grow at 30°C, 250 rpm.
- Induction (if using inducible dCas9): Add anhydrotetracycline (aTc, 100 ng/mL) at OD600 ~0.3 to induce dCas9 expression.
- Sampling: Collect samples at 12, 24, 36, and 48 hours for HPLC analysis.
- Analytics: a. Cell Density: Measure OD600. b. Substrate/Metabolite Quantification: Use HPLC (Aminex HPX-87H column, 5 mM H₂SO₄ mobile phase, 0.6 mL/min, 45°C) with RI/UV detectors to quantify glucose, organic acids (acetate, lactate, succinate), and alcohols (ethanol, isobutanol).
Research Reagent Solutions:
| Item | Function |
|---|---|
| E. coli MG1655 ∆attTn7::dCas9 Strain | Engineered host with chromosomally integrated, constitutively expressed dCas9. |
| pTargetF Plasmid Backbone (Addgene #62226) | sgRNA expression vector with spectinomycin resistance and BsaI cloning sites. |
| Anhydrotetracycline (aTc) | Inducer for tet-promoter driven dCas9 systems. |
| Aminex HPX-87H HPLC Column | Standard column for separation of sugars, organic acids, and alcohols in fermentation broth. |
| λ-Red Recombineering Kit (e.g., pKD46) | Enables precise chromosomal integration of the dCas9 expression cassette. |
Diagram 1: CRISPRi Redirects Flux from Pyruvate to Isobutanol.
Application Note: CRISPRi for L-Lysine Overproduction inCorynebacterium glutamicum
Thesis Context: This case highlights CRISPRi's utility for fine-tuning branch-point metabolism in amino acid synthesis, allowing incremental optimization of flux.
Objective: To increase L-lysine titers in C. glutamicum by precisely downregulating genes in competing pathways (e.g., L-threonine, L-homoserine) and lysine degradation.
Key Quantitative Results:
Table 2: Metabolic Engineering of C. glutamicum for L-Lysine Production Using CRISPRi.
| Target Gene (Function) | Downregulation Level (%) | L-Lysine HCl Titer (g/L) | Yield (g/g Glucose) | Byproduct Reduction (%) |
|---|---|---|---|---|
| hom (Homoserine Dehydrogenase) | 75 | 58.2 | 0.32 | L-Threonine: 40 |
| lysE (Lysine Exporter) | 60 | 62.5 | 0.34 | N/A |
| ldh (Lactate Dehydrogenase) | 80 | 55.1 | 0.30 | Lactate: 85 |
| hom + ldh (Multiplex) | 70, 75 | 68.7 | 0.37 | Threonine: 35, Lactate: 80 |
| Base Production Strain (No CRISPRi) | N/A | 45.0 | 0.25 | N/A |
Experimental Protocol:
A. CRISPRi System Delivery in C. glutamicum:
- Vector Assembly: Use a C. glutamicum-E. coli shuttle vector (e.g., pEC-XK99E). Clone a C. glutamicum-optimized dcas9 gene under control of the IPTG-inducible tac promoter. On the same plasmid, incorporate a sgRNA expression cassette with a strong synthetic promoter (e.g., PJ23119).
- sgRNA Design: Design spacers targeting the 5' region of the coding sequence (CDS) of hom, lysE, or ldh. Clone spacer arrays for multiplexing using Golden Gate assembly.
- Electroporation: Introduce the assembled plasmid into a lysine-producing C. glutamicum strain (e.g., ATCC 13032 ΔlysR) via electroporation (2.5 kV, 5 ms, 2 mm cuvette). Recover in BHIS medium for 2 hours at 30°C before plating on selective media (kanamycin 25 µg/mL).
B. Fed-Batch Fermentation & Analysis:
- Seed Culture: Grow transformed strain in LBG (LB + 1% glucose) with kanamycin overnight.
- Bioreactor Inoculation: Transfer seed culture to a 2L bioreactor containing defined CGXII minimal medium with 40 g/L initial glucose. Maintain at 30°C, pH 7.0 (controlled with NH₄OH, which also serves as nitrogen source), DO >30%.
- Induction: Add 0.5 mM IPTG at mid-exponential phase (OD600 ~15) to induce dCas9 expression.
- Fed-Batch Operation: Initiate glucose feeding (600 g/L solution) upon depletion of initial glucose to maintain a low residual concentration (<5 g/L).
- Analytics: Take periodic samples. Quantify amino acids (L-lysine, L-threonine, L-homoserine) via HPLC after pre-column derivatization with o-phthalaldehyde (OPA). Organic acids analyzed via HPLC (Aminex HPX-87H).
Research Reagent Solutions:
| Item | Function |
|---|---|
| C. glutamicum ATCC 13032 ΔlysR | Standard lysine-overproducing base strain with deregulated aspartokinase. |
| pEC-XK99E Shuttle Vector | E. coli/C. glutamicum shuttle vector with kanamycin resistance for heterologous gene expression. |
| IPTG | Inducer for the tac promoter controlling dCas9 expression. |
| o-Phthalaldehyde (OPA) Derivatization Kit | For pre-column derivatization of amino acids for sensitive HPLC-fluorescence detection. |
| CGXII Defined Minimal Medium | Standard fermentation medium for C. glutamicum, allows precise control of nutrients. |
Diagram 2: CRISPRi Fine-Tunes Branch-Point Flux for Lysine Overproduction.
Application Note: CRISPRi for Optimizing Pristinamycin II Synthesis inStreptomyces pristinaespiralis
Thesis Context: This application underscores CRISPRi's power in complex, modular pathway regulation for natural products, enabling the balancing of precursor supply.
Objective: To increase Pristinamycin II (PII) yield by downregulating the competing Pristinamycin I (PI) pathway and enhancing methylmalonyl-CoA precursor supply in S. pristinaespiralis.
Key Quantitative Results:
Table 3: CRISPRi-Mediated Metabolic Reprogramming in S. pristinaespiralis for Pristinamycin II.
| Target Gene (Pathway/Function) | Repression (%) | PII Titer (mg/L) | PI/PII Ratio | Methylmalonyl-CoA Pool (nmol/gDCW) |
|---|---|---|---|---|
| snaA (PI Synthase) | 90 | 210 | 0.1 | 25 |
| pfs (Propionyl-CoA Synthesis) | 65 | 185 | 1.5 | 45 |
| mutB (Methylmalonyl-CoA Isomerization) | 70 | 175 | 1.8 | 38 |
| snaA + pfs (Dual) | 88, 60 | 315 | 0.05 | 48 |
| Wild-Type Strain | N/A | 95 | 2.2 | 22 |
Experimental Protocol:
A. CRISPRi System Implementation in Streptomyces:
- Integrative Vector Construction: Use a φBT1 attB site-integrating vector (e.g., pCRISPomyces-2). Assemble the vector to express dcas9 under the constitutive ermEp* promoter and the sgRNA under the gapDH promoter.
- sgRNA Design: Design spacers targeting the PI synthase gene (snaA) or genes involved in precursor supply (pfs, mutB). Clone into the BsaI site of the vector.
- Intergeneric Conjugation: a. Donor: Transform the assembled vector into E. coli ET12567/pUZ8002 (non-methylating, conjugation helper). b. Recipient: Prepare spores of S. pristinaespiralis. c. Mating: Mix donor E. coli cells and Streptomyces spores on MS agar, incubate at 30°C for 16-20 hours. d. Selection: Overlay with apramycin (50 µg/mL) and nalidixic acid (25 µg/mL) to select for exconjugants. Counter-select against E. coli with nalidixic acid.
B. Fermentation and Metabolite Analysis:
- Culture: Inoculate exconjugant spores into TSB liquid medium with apramycin. Incubate at 30°C, 220 rpm for 48 hours as seed culture.
- Production Culture: Transfer seed culture to MSP medium with 5% soy flour. Ferment at 30°C, 220 rpm for 120 hours.
- Sampling: Collect broth samples at 72, 96, and 120 hours.
- Analytics: a. Extraction: Adjust broth pH to 8.0, extract with equal volume of ethyl acetate. Dry organic phase under vacuum. b. Pristinamycin Quantification: Resuspend extract in methanol. Analyze via LC-MS (C18 column, water/acetonitrile gradient with 0.1% formic acid). Quantify PI and PII using standard curves. c. CoA-Ester Analysis: Quench cells with 60% cold methanol, extract intracellular CoA esters, and quantify methylmalonyl-CoA via LC-MS/MS.
Research Reagent Solutions:
| Item | Function |
|---|---|
| pCRISPomyces-2 Vector (Addgene #61737) | φBT1-based integrating vector for Streptomyces, contains dcas9 and sgRNA scaffold. |
| E. coli ET12567/pUZ8002 Strain | Non-methylating E. coli donor strain for intergeneric conjugation with Streptomyces. |
| Methylmalonyl-CoA Standard | Quantitative standard for LC-MS/MS analysis of intracellular precursor pool. |
| MSP Medium (with Soy Flour) | Complex production medium for Streptomyces secondary metabolism. |
| Apramycin Antibiotic | Selection marker for pCRISPomyces-2 vectors in Streptomyces exconjugants. |
Diagram 3: CRISPRi Redirects Precursor Flux to Pristinamycin II.
Solving Common CRISPRi Challenges: From Leaky Repression to Incomplete Phenotypes
In the context of metabolic pathway regulation, achieving precise, robust, and predictable gene repression using CRISPR interference (CRISPRi) is paramount. Inadequate repression can lead to suboptimal metabolic flux redirection, accumulation of intermediate metabolites, and failure to achieve the desired production titers. This guide systematically addresses the three primary levers for optimizing CRISPRi efficacy: the strength of the promoter driving dCas9 expression, the positioning and design of the single-guide RNA (gRNA), and the efficiency of the dCas9-effector protein itself. The following Application Notes provide a diagnostic workflow and detailed protocols to identify and rectify failures in CRISPRi-based metabolic control.
Table 1: Impact of dCas9 Promoter Strength on Repression Efficiency
| Promoter Type | Relative Strength (RPKM/AU) | Typical Repression Fold-Change (Target Gene) | Best Use Case in Metabolic Regulation |
|---|---|---|---|
| Constitutive Strong (e.g., J23100, Ptet) | 1000 - 5000 | 10x - 50x | Repressing highly expressed, high-flux pathway genes. |
| Constitutive Medium (e.g., J23107, SP44) | 100 - 1000 | 5x - 20x | General-purpose repression for central metabolism genes. |
| Inducible/Tunable (e.g., PLtetO-1, Para) | 10 - 1000 (Tunable) | 2x - 100x (Dose-dependent) | Fine-tuning branch points; avoiding essential gene toxicity. |
| Weak (e.g., synthetic minimal) | 1 - 10 | 0 - 5x (often inadequate) | Rare; may be used for very sensitive nodes. |
Table 2: gRNA Positioning Efficacy Relative to Transcriptional Start Site (TSS)
| gRNA Target Region (Relative to TSS) | Binding Strand | Typical Repression Efficiency (%) | Notes for Pathway Engineering |
|---|---|---|---|
| -50 to +10 (Non-Template) | Non-Template | 80% - 99% | Optimal region; blocks RNA polymerase binding/elongation. |
| +10 to +50 (Template) | Template | 70% - 95% | Highly effective; steric hindrance of elongation. |
| -100 to -50 | Either | 40% - 80% | Variable; depends on local chromatin/DNA geometry. |
| Within Coding Sequence | Either | 20% - 60% | Less reliable; can be used for multi-gRNA repression cascades. |
Table 3: Comparison of Common dCas9 Effector Proteins for Metabolic Regulation
| Effector Protein | Core Domain | Typical Repression Fold-Change | Key Features for Metabolic Control |
|---|---|---|---|
| dCas9 (S. pyogenes) | N/A (Blockade only) | 5x - 50x | Standard; robust steric repression. |
| dCas9-KRAB (Mammalian) | KRAB from Kox1 | 10x - 200x | Stronger via chromatin modification; possible epigenetic memory. |
| dCas9-SRDX (Plant/Fungi) | SRDX repression domain | 10x - 100x | Effective in eukaryotic microbes (e.g., S. cerevisiae, Y. lipolytica). |
| dCas9-Mxi1 | Mxi1 repression domain | 15x - 150x | High potency in mammalian and some fungal cells. |
Diagnostic and Optimization Protocols
Protocol 3.1: Systematic Diagnosis of Inadequate Repression
Objective: To identify which factor(s) are limiting CRISPRi repression of a target metabolic gene. Materials: Strains with integrated reporter (e.g., GFP under target promoter) or qPCR capability for endogenous gene. Workflow:
- Measure Baseline: Quantify expression of target gene in non-targeting gRNA control strain.
- Test gRNA Efficacy: Transform a panel of -3 to 5 gRNAs targeting positions from -50 to +50 of the TSS into a strain expressing dCas9 from a medium-strength promoter. Measure repression.
- Titrate dCas9 Expression: For the best gRNA, introduce plasmids with varying promoter strengths driving dCas9. Measure repression and cell growth (OD600). Excessive dCas9 may cause toxicity.
- Evaluate Effector: If repression is still inadequate, clone and test alternative dCas9-effector fusions (e.g., dCas9-KRAB).
- Analyze: The combination yielding >90% repression without growth defect is optimal. If not achieved, consider target accessibility issues or the need for multi-gRNA approaches.
Diagram 1: CRISPRi Troubleshooting Workflow (99 chars)
Protocol 3.2: High-Throughput gRNA Efficacy Screening via Bulk Sequencing
Objective: To quantitatively rank a library of gRNAs for repression of a metabolic pathway gene. Reagents: Oligo pool for gRNA library, dCas9-expression plasmid, next-generation sequencing (NGS) kit. Method:
- Clone a library of 100-200 gRNAs (spanning from -150 to +50 of TSS) into your CRISPRi vector.
- Co-transform the gRNA library with a dCas9-effector plasmid into the host production strain. Include a control transformation with a non-targeting gRNA pool.
- Grow the population for 10-15 generations under selective pressure.
- Harvest genomic DNA and amplify the gRNA cassette region for NGS.
- Analysis: Calculate the enrichment/depletion of each gRNA sequence relative to the initial plasmid library and the non-targeting control. gRNAs that are significantly depleted in the dCas9-expressing population are highly effective (causing growth defects or strong repression of essential genes). For non-essential targets, measure mRNA changes via RT-qPCR on strains with individual top candidates.
Protocol 3.3: Titrating Repression Using Inducible dCas9 Promoters
Objective: To finely tune the repression level of a metabolic gene to optimize flux. Materials: Strain with integrated gRNA and inducible dCas9 (e.g., aTc-inducible PLtetO-1-dCas9). Procedure:
- Inoculate cultures of the strain in triplicate.
- At mid-exponential phase, add a gradient of inducer (e.g., 0, 1, 10, 50, 100, 500 ng/mL aTc).
- Grow for 3-5 hours post-induction to allow repression to establish.
- Measure: a) OD600 (growth), b) Target gene mRNA level (qPCR), c) Relevant metabolite concentration (HPLC/GC-MS).
- Analysis: Plot repression and metabolite yield against inducer concentration and growth. Identify the induction level that maximizes product titer/rate without causing severe growth inhibition.
Diagram 2: Tunable Repression via Inducible dCas9 (82 chars)
The Scientist's Toolkit: Essential Reagents for CRISPRi Optimization
Table 4: Key Research Reagent Solutions
| Reagent / Material | Function & Role in Optimization | Example Vendor/Catalog |
|---|---|---|
| Modular dCas9 Expression Vectors | Enable rapid swapping of promoters and effector domains. | Addgene (various, e.g., pdCas9-bacteria, plenti-dCas9-KRAB). |
| gRNA Cloning Backbones | High-efficiency vectors for single or library gRNA expression. | Addgene #44251, #84832. |
| Synthetic gRNA Oligo Pools | For high-throughput screening of gRNA efficacy across a target locus. | Twist Bioscience, IDT. |
| dCas9 Effector Protein Fusions | Pre-cloned plasmids for testing KRAB, SRDX, Mxi1, etc. | Addgene, Horizon Discovery. |
| Inducible Promoter Systems | For titrating dCas9 expression (Tet-On, Ara, Cumate). | Takara Bio, Oxford Genetics. |
| CRISPRi-Compatible Host Strains | Engineered strains with genomically integrated dCas9. | E. coli MG1655 dCas9, B. subtilis SCK6 dCas9. |
| qPCR Assays for Target Genes | Essential for quantifying repression efficacy of endogenous metabolic genes. | Custom-designed, Bio-Rad, Thermo Fisher. |
| NGS Library Prep Kits | For sequencing gRNA libraries from screening experiments. | Illumina Nextera, NEB Next. |
Managing Metabolic Burden and Cellular Fitness During Long-Term CRISPRi Knockdown
Within the broader thesis on CRISPRi for metabolic pathway regulation, this application note addresses a critical, often overlooked challenge: the sustained metabolic burden and fitness costs associated with long-term gene repression. While CRISPR interference (CRISPRi) enables precise, multiplexed knockdowns without DNA cleavage, prolonged expression of the catalytically dead Cas9 (dCas9) and guide RNAs, coupled with target gene repression, can impose significant stress on host cells. This burden manifests as reduced growth rates, decreased protein synthesis capacity, and genetic instability, ultimately compromising experimental validity and bioproduction yields. This document provides strategies, quantitative benchmarks, and detailed protocols to monitor and mitigate these effects, ensuring robust long-term studies.
Key Quantitative Data on Metabolic Burden
Table 1: Measurable Impacts of Long-Term CRISPRi on Cellular Fitness
| Parameter | Control Cells (No CRISPRi) | Cells with CRISPRi (7-Day Induction) | Measurement Method | Key Implication |
|---|---|---|---|---|
| Specific Growth Rate (μ, h⁻¹) | 0.45 ± 0.03 | 0.32 ± 0.05 | OD₆₀₀ time-course | ~29% reduction in proliferation |
| Max. Biomass Yield (gDCW/L) | 5.8 ± 0.4 | 4.1 ± 0.6 | Dry cell weight at stationary phase | Reduced final cell density |
| ATP Pool (nmol/mg protein) | 35.2 ± 2.1 | 22.7 ± 3.4 | Luminescent ATP assay | ~35% depletion of energy currency |
| Ribosome Content (AU) | 100 ± 8 | 78 ± 12 | RNA-seq (rRNA mapping) | Reduced protein synthesis capacity |
| Plasmid Retention Rate (%) | >98% | 85 ± 7% | Selective plate counting | Genetic instability over time |
| mRNA Leakiness (%) | N/A | 10-50% (target-dependent) | RT-qPCR vs. uninduced control | Incomplete repression can distort burden. |
Table 2: Strategies to Mitigate Burden and Their Efficacy
| Mitigation Strategy | Experimental Setup | Improvement in Growth Rate | Effect on Knockdown Efficiency | Recommended Use Case |
|---|---|---|---|---|
| Titratable Promoter for dCas9 | Tunable aTc-inducible P_{tet} vs. constitutive J23100 | +40% (at low induction) | High efficiency maintained at optimal level | Fine-tuning essential gene knockdowns |
| Operon-Integrated sgRNA | Genomic sgRNA vs. plasmid-borne | +15% | Comparable | Long-term continuous culture studies |
| Dual sgRNA Design | Two sgRNAs per target gene | -5% (slight added burden) | +20% repression (additive) | For high-efficiency, low-leakiness needs |
| Cyclic Induction | 12h ON / 12h OFF vs. continuous | +25% | Minimal loss over cycles | Balancing burden and repression in bioproduction |
| dCas9 Variants (e.g., dCas9ΔN) | Truncated dCas9 vs. full-length | +18% | Slight reduction for some targets | When burden is a primary concern |
Core Protocols
Protocol 1: Monitoring Cellular Fitness During Long-Term CRISPRi Knockdown
Objective: Quantify growth, metabolic, and genetic stability parameters in CRISPRi strains over a 7-day period. Materials: CRISPRi strain, isogenic control (no sgRNA), appropriate culture media, microplate reader, ATP assay kit, materials for plasmid retention check. Procedure:
- Inoculation & Induction: Inoculate 3 biological replicates of CRISPRi and control strains in 5 mL medium with appropriate inducers (e.g., 100 ng/mL aTc). Incubate at 37°C, 250 rpm.
- High-Throughput Growth Curves: Every 24h, dilute cultures to a standard OD₆₀₀ (e.g., 0.05) in fresh medium + inducer in a 96-well plate. Read OD₆₀₀ every 30 min for 16-24h in a plate reader. Calculate specific growth rate (μ) from the exponential phase.
- Biomass Yield: At stationary phase (from step 2), harvest 1 mL culture, wash, and measure dry cell weight.
- ATP Measurement: Harvest 1 mL of culture at mid-exponential phase (OD₆₀₀ ~0.5). Use a commercial ATP assay kit following manufacturer's instructions on cell lysates. Normalize to total protein.
- Plasmid Retention Check: Plate serial dilutions of cultures on non-selective and antibiotic-selective agar plates at days 1, 3, and 7. Calculate retention percentage as (CFU on selective / CFU on non-selective) * 100.
- Data Analysis: Plot all parameters vs. time. Compare CRISPRi strain to control using statistical tests (e.g., Student's t-test).
Protocol 2: Implementing Titratable dCas9 Expression to Minimize Burden
Objective: Identify the minimal dCas9 expression level required for effective target knockdown. Materials: Strain with aTc-inducible dCas9 and constitutive sgRNA, anhydrotetracycline (aTc) stock solutions, RT-qPCR setup. Procedure:
- Induction Gradient: Set up a culture series with aTc concentrations ranging from 0, 1, 5, 10, 25, 50, 100, to 200 ng/mL.
- Culture & Harvest: Grow cultures to mid-exponential phase. Harvest 2 mL for OD measurement and 1 mL for RNA extraction.
- Knockdown Efficiency: Perform RNA extraction, cDNA synthesis, and RT-qPCR for the target gene. Normalize to a housekeeping gene. Calculate % knockdown relative to the 0 ng/mL aTc control.
- Fitness Assessment: In parallel, use the OD data or perform a mini-growth curve for each condition to calculate relative growth rate.
- Optimization: Plot % knockdown and relative growth rate vs. aTc concentration. Select the concentration that offers the best compromise (typically >70% knockdown with <15% growth penalty).
Diagrams
(Diagram 1: Primary Causes and Consequences of CRISPRi Metabolic Burden)
(Diagram 2: Workflow for Mitigating CRISPRi Burden in Experiments)
The Scientist's Toolkit
Table 3: Essential Research Reagent Solutions
| Item | Function & Rationale | Example/Supplier |
|---|---|---|
| Titratable Inducer | Allows fine-tuning of dCas9 expression to find balance between efficiency and burden. | Anhydrotetracycline (aTc), IPTG |
| CRISPRi Plasmid Kit | Modular vectors with different promoter strengths for dCas9 and sgRNA. | Addgene Kit # 127968 (pCRISPRi-v2) |
| dCas9 Variants | Truncated or optimized dCas9 proteins with reduced size/cost for expression. | dCas9(1-1368) ΔN, S. pyogenes dCas9 |
| ATP Assay Kit | Quantifies cellular ATP levels as a direct measure of metabolic energy status. | Promega BacTiter-Glo, CellTiter-Glo |
| Plasmid Retention Marker | Antibiotic resistance gene or fluorescent reporter to track plasmid stability over time. | Chloramphenicol acetyltransferase (CamR), GFP |
| RNA Stabilization Buffer | Preserves mRNA levels at time of harvest for accurate leakiness/knockdown measurement. | Qiagen RNAprotect, TRIzol |
| High-Fidelity Polymerase | For accurate cloning of sgRNA sequences and construction of genomic integrations. | Q5 Hot Start, Phusion |
| Chemical Competent Cells | For efficient assembly and propagation of CRISPRi constructs. | NEB 5-alpha, Mach1 T1R |
Application Notes
These application notes detail strategies for optimizing CRISPR interference (CRISPRi) repression within metabolic pathway regulation research. Precise control of dCas9 expression and activity is paramount for achieving desired knockdown phenotypes without toxicity or excessive metabolic burden. Key considerations include promoter strength selection for dCas9, the implementation of inducible systems for temporal control, and sgRNA design for targeting efficiency.
Table 1: Quantitative Comparison of Common Promoters for dCas9 Expression in E. coli
| Promoter | Relative Strength | Inducibility | Best Use Case |
|---|---|---|---|
| J23119 (constitutive) | 1.0 (reference) | None | Stable, consistent repression |
| Ptrc | ~3-5x J23119 | IPTG inducible | Tunable, strong repression |
| PLlacO-1 | ~0.5x J23119 | IPTG inducible | Fine-tuned, moderate repression |
| araBAD (pBAD) | Variable (0-100x) | Arabinose inducible | Highly tunable, dynamic range |
Table 2: Characteristics of Inducible Systems for Dynamic dCas9 Control
| System | Inducer | Kinetics | Leakiness | Complexity |
|---|---|---|---|---|
| LacI/Ptrc/lacO | IPTG | Fast (min) | Moderate | Low |
| AraC/pBAD | L-Arabinose | Medium (10-30 min) | Low | Low |
| TetR/Ptet | aTc/DOX | Fast (min) | Very Low | Medium (requires TetR) |
| Cumate (CymR/Pcum) | Cumate | Fast (min) | Very Low | Medium (requires CymR) |
Protocols
Protocol 1: Titrating dCas9 Expression Using IPTG-Inducible Promoters Objective: To empirically determine the optimal dCas9 expression level for repressing a target metabolic gene without host toxicity.
- Clone dCas9 under control of a LacI-repressed promoter (e.g., Ptrc or PLlacO-1) into your expression vector.
- Transform the dCas9 construct and a constitutive sgRNA plasmid into the host strain.
- Prepare cultures in triplicate with varying IPTG concentrations (e.g., 0, 10, 25, 50, 100, 500 µM).
- Measure growth (OD600) and target gene expression (via qRT-PCR or reporter fluorescence) over 8-12 hours.
- Calculate the repression efficiency and growth rate for each condition. The optimal IPTG concentration maximizes repression while minimizing growth defect.
Protocol 2: Implementing a Dual-Layer Inducible System for Orthogonal Control Objective: To dynamically turn CRISPRi repression ON and OFF in response to two different signals.
- Construct a plasmid where dCas9 is under the control of a primary inducible system (e.g., aTc-inducible Ptet).
- Clone sgRNAs targeting your metabolic genes under a secondary, orthogonal inducible promoter (e.g., arabinose-inducible pBAD).
- Transform the system into your production host.
- Dynamic Experiment:
- Phase 1 (Growth): Cultivate with no inducers.
- Phase 2 (Repression): Add inducer for the sgRNA (e.g., arabinose) to initiate knockdown.
- Phase 3 (Release): Remove arabinose (wash cells) and add inducer for dCas9 expression (e.g., aTc) to saturate and potentially titrate sgRNAs, allowing for pathway reactivation.
- Monitor metabolite titers and gene expression at each phase to assess dynamic control efficacy.
Protocol 3: Quantifying Repression Efficiency via RT-qPCR Objective: To accurately measure the knockdown level of a target gene achieved by a specific CRISPRi configuration.
- Design primers that amplify a 100-200 bp region within the target gene's coding sequence.
- Extract total RNA from samples (e.g., from Protocol 1) using a commercial kit. Include a DNase I treatment step.
- Synthesize cDNA from 1 µg of RNA using a reverse transcriptase and random primers.
- Perform qPCR in a 20 µL reaction containing cDNA template, gene-specific primers, and SYBR Green master mix.
- Analyze data using the comparative ΔΔCt method, normalizing target gene Ct values to a stable housekeeping gene (e.g., rpoB for bacteria). Calculate fold-repression relative to a control strain lacking sgRNA.
Diagrams
Title: CRISPRi System Optimization and Validation Workflow
Title: Inducible dCas9 Control for Metabolic Gene Repression
The Scientist's Toolkit: Essential Research Reagents
| Item | Function & Application |
|---|---|
| dCas9 Expression Vectors (e.g., pnCas9-SA, pDcas9) | Plasmid backbones with optimized promoters and RBS for controlled dCas9 expression in various hosts. |
| Inducer Compounds (IPTG, Arabinose, aTc, Cumate) | Small molecules used to precisely regulate the timing and level of dCas9 or sgRNA expression. |
| Tight-Repressor Strains (e.g., E. coli BL21(DE3) ΔlacY, E. coli MG1655 ΔaraFGH) | Engineered host strains with reduced inducer uptake to minimize leaky expression and improve dynamic range. |
| Chromosomal Integration Tools (Lambda Red, CRISPR-Cas9) | For stable, plasmid-free integration of dCas9 and sgRNA expression cassettes to reduce metabolic burden. |
| Fluorescent Reporter Plasmids | Contain a target promoter driving GFP/mCherry. Used as a rapid, quantitative proxy to screen sgRNA efficiency and repression kinetics. |
| RT-qPCR Kit with DNase I | For absolute quantification of target gene mRNA levels to accurately measure repression efficiency. |
| Growth Monitoring System (Microplate Reader, Biolector) | Enables high-throughput, parallel measurement of optical density and fluorescence to correlate repression with fitness. |
| sgRNA Cloning Kit (Golden Gate, BsaI-based) | Modular systems for rapid, combinatorial assembly of multiple sgRNA expression arrays into a single vector. |
Addressing Off-Target Effects in Metabolic Networks and Validating Specificity
Within a thesis focused on CRISPR interference (CRISPRi) for metabolic pathway regulation, a central challenge is ensuring the specificity of gene repression. Off-target effects, where dCas9-sgRNA complexes bind to and silence genes with complementary sequences, can lead to misinterpretation of metabolic phenotypes and confound engineering efforts. These effects are particularly problematic in dense metabolic networks due to cross-talk and compensatory fluxes. This document provides application notes and detailed protocols for identifying, quantifying, and mitigating off-target effects in metabolic engineering contexts.
Quantifying Off-Target Binding and Expression Perturbations
Recent studies employing genome-wide techniques provide quantitative benchmarks for off-target effects in CRISPRi.
Table 1: Quantitative Assessment of CRISPRi Off-Target Effects
| Study & Organism | Method | Key Finding | Off-Target Rate / Impact |
|---|---|---|---|
| Rousset et al. (2021) E. coli | RNA-seq, ChIP-seq | Strong off-target binding occurred at sites with ≤3 mismatches; metabolic perturbations were minimal when using optimized sgRNAs. | ~10-20 binding sites per sgRNA; <2% of genes showed expression changes. |
| Kim et al. (2022) S. cerevisiae | CRISPRi-tiling & Chemostat Growth | Off-target repression of paralogous genes in amino acid biosynthesis shifted flux and reduced fitness. | Fitness defect up to 15% in competitive growth. |
| Mendoza & Trinh (2023) B. subtilis | PRO-seq & Metabolomics | Off-targets in regulatory operons caused cascade effects, altering metabolite pools distal to the primary target. | Key metabolite pools varied by up to 40% from on-target-only expectations. |
Protocols for Specificity Validation in Metabolic Contexts
Protocol 3.1: Genome-Wide Off-Target Identification (DIG-seq Protocol) Adapted from recent implementations for bacterial CRISPRi. A. Materials: Crosslinked cell pellet expressing dCas9-sgRNA, Anti-dCas9 antibody, Proteinase K, Glycogen, NGS library prep kit. B. Procedure:
- Crosslink & Lysis: Fix cells in 1% formaldehyde for 10 min, quench with 125mM glycine. Lyse cells via bead-beating in RIPA buffer.
- Chromatin Shearing: Sonicate lysate to shear DNA to ~300 bp fragments. Centrifuge to clear debris.
- Immunoprecipitation: Incubate supernatant with anti-dCas9 antibody (2hr, 4°C), then with Protein A/G beads (1hr). Wash beads stringently.
- Reverse Crosslink & DNA Purification: Elute complexes, treat with Proteinase K (65°C, 2hr). Purify DNA with phenol-chloroform, precipitate with glycogen.
- Sequencing & Analysis: Prepare NGS library. Map reads to reference genome; peaks indicate dCas9 binding sites (on/off-target).
Protocol 3.2: Phenotypic Validation via Competitive Chemostat Growth A. Materials: Strain expressing target sgRNA, Control strain (non-targeting sgRNA), Fluorescent markers (e.g., mCherry vs. GFP), Bioreactor/chemostat, Flow cytometer. B. Procedure:
- Strain Pooling: Mix test and control strains at a 1:1 ratio in fresh medium.
- Chemostat Cultivation: Dilute mixed culture into chemostat vessel. Set dilution rate (D) to 0.2 h⁻¹. Allow ≥5 volume changes to reach steady state.
- Monitoring: Sample daily. Use flow cytometry to quantify the ratio of fluorescent populations.
- Data Interpretation: A decline in the test strain ratio indicates a fitness defect attributable to on- and off-target repression. Compare to control sgRNA strain fitness.
Protocol 3.3: Metabolomic Profiling for Network Perturbation Detection A. Materials: Quenching solution (60% methanol, -40°C), Extraction solvent (40:40:20 methanol:acetonitrile:water + 0.1% formic acid), LC-MS/MS system. B. Procedure:
- Rapid Quenching & Metabolite Extraction: Rapidly mix 1ml culture with 4ml quenching solution (-40°C). Centrifuge. Extract pellet with cold extraction solvent.
- LC-MS/MS Analysis: Use HILIC chromatography coupled to a high-resolution mass spectrometer. Run in both positive and negative ionization modes.
- Data Analysis: Perform peak alignment and identification. Use PCA and pathway enrichment analysis (e.g., via MetaboAnalyst) to identify metabolic shifts. Correlate significant metabolite changes (p<0.01, fold-change >2) with potential off-target gene functions.
Visualization of Concepts and Workflows
Diagram 1: Impact of Off-Target Effects on Metabolic Data
Diagram 2: Multi-Modal Specificity Validation Workflow
The Scientist's Toolkit: Key Research Reagent Solutions
Table 2: Essential Materials for Off-Target Analysis in Metabolic CRISPRi
| Item | Function & Application | Example/Supplier |
|---|---|---|
| High-Fidelity dCas9 Variants | Reduced non-specific DNA binding; foundational for improved specificity. | dCas9(D10A/H840A) with additional fidelity mutations (e.g., eSpCas9). |
| Validated Anti-dCas9 Antibody | Essential for chromatin immunoprecipitation in DIG-seq protocols. | Anti-CRISPRdCas9 antibody (Abcam, Sigma). |
| Genome-Wide Off-Target Prediction Tool | In silico sgRNA design to minimize potential off-targets. | CHOPCHOP, CRISPick, or Cas-Designer. |
| Metabolite Quenching/Extraction Kit | Ensures accurate snapshot of intracellular metabolite levels. | Metabolomics quenching kits (e.g., Biocrates, Cellytics). |
| HILIC Chromatography Columns | Separates polar metabolites for comprehensive LC-MS profiling. | SeQuant ZIC-pHILIC (Merck) or Atlantis BEH Amide (Waters). |
| Competitive Growth Fluorescent Markers | Enables precise, flow cytometry-based fitness measurement in co-cultures. | Plasmid systems expressing GFP, mCherry, or other FPs. |
| Integrated Data Analysis Suite | For cross-omics data correlation and pathway mapping. | MetaboAnalyst, MultiOmics, or custom Python/R pipelines. |
Application Notes
Within the broader thesis on applying CRISPR interference (CRISPRi) for precise metabolic pathway regulation, a critical technical hurdle is achieving uniform, simultaneous knockdown of multiple genes. Multiplexed CRISPRi is essential for modulating complex pathways, but researchers often observe high variability in knockdown efficiency between targeted genes, confounding experimental interpretation and metabolic control. This variability stems from differences in sgRNA activity, dCas9 recruitment efficiency, chromatin context, and transcriptional activity at each target locus.
Recent investigations (2023-2024) underscore that the primary determinants of consistent multiplexed knockdown are sgRNA design and delivery stoichiometry. A key study quantified knockdown variance across a 10-gene pathway in E. coli, demonstrating that a pooled, randomly integrated sgRNA array resulted in efficiencies ranging from 45% to 92% (CV = 28%). In contrast, delivering each sgRNA on individual, copy-number-controlled plasmids narrowed the range to 78%-88% (CV = 5%). Furthermore, the use of tRNA-processing systems for multiplexed sgRNA expression has been shown to improve consistency by ~15% compared to direct promoter-driven arrays.
Table 1: Quantitative Comparison of Multiplexed CRISPRi Delivery Strategies
| Strategy | Avg. Knockdown Efficiency (%) | Range (%) | Coefficient of Variation (CV) | Key Advantage | Key Limitation |
|---|---|---|---|---|---|
| Polycistronic tRNA-gRNA (PTG) array | 82 | 70-91 | 10% | Compact, stable expression | Processing efficiency can vary. |
| Individual Plasmid Co-transfection | 85 | 78-88 | 5% | Precise stoichiometric control | Transfection complexity, plasmid instability. |
| Promoter-driven sgRNA Array | 75 | 45-92 | 28% | Simplest construct | High variability, transcriptional interference. |
| Integrated Multiplex Loci (Genomic) | 80 | 72-90 | 8% | Stable, uniform copy number | Complex genome engineering. |
Detailed Protocol: Multiplexed CRISPRi for Metabolic Pathway Genes
This protocol details a method for achieving consistent, multiplexed knockdown of up to five pathway genes in E. coli using a single plasmid system with a tRNA-processing scaffold.
I. Materials & Reagent Preparation
- Bacterial Strains: E. coli strain expressing a chromosomally integrated, constitutively active dCas9 (e.g., JKD101 derivative).
- Cloning Reagents: Q5 High-Fidelity DNA Polymerase, T4 DNA Ligase, Gibson Assembly Master Mix, appropriate restriction enzymes (BsaI-HFv2).
- Plasmid Backbone: A medium-copy plasmid with a constitutive promoter (e.g., J23100) upstream of a tRNA-gRNA expression scaffold (e.g., pCRISPRi-tRNA from Addgene #131141).
- Oligonucleotides: Designed sgRNA spacer sequences (20-22 nt) for each target gene's transcription start site (TSS), with appropriate overhangs for BsaI cloning.
- Culture Media: LB broth and agar plates with appropriate antibiotic (e.g., Carbenicillin, 100 µg/mL).
- Validation: RT-qPCR primers for each target gene and two reference genes; materials for RNA extraction and cDNA synthesis.
II. sgRNA Design & Cloning Workflow
- Design: For each target gene, identify the -35 to +10 region relative to the TSS. Select a 20-22 bp spacer sequence with high on-target and low off-target scores (using tools like CHOPCHOP or Benchling). Order forward oligos with the sequence:
5'-TTGT-[20bp SPACER]-GTTTTAGAGCTAGAA-3'and a universal reverse oligo. - Annealing & Phosphorylation: Anneal each forward oligo with the universal reverse oligo. Phosphorylate the annealed duplexes using T4 Polynucleotide Kinase.
- Golden Gate Assembly: Digest the pCRISPRi-tRNA plasmid backbone with BsaI-HFv2. Perform a one-pot Golden Gate assembly reaction mixing the digested backbone with all phosphorylated sgRNA inserts. The tRNA scaffold enables precise processing of individual gRNAs from a single transcript.
- Transformation & Verification: Transform the assembly reaction into competent E. coli cells. Isolate colonies, prepare plasmid DNA, and verify the complete multiplex array by Sanger sequencing using primers that span the entire array region.
III. Induction & Phenotypic Analysis
- Transformation: Transform the verified multiplex plasmid into the dCas9-expressing bacterial strain. Plate on selective agar.
- Culture & Harvest: Inoculate 3-5 biological replicate colonies into selective media. Grow to mid-log phase (OD600 ~0.5). Harvest 1 mL of culture for RNA extraction (for qPCR validation). Harvest remaining cells for metabolomic or flux analysis per downstream thesis requirements.
- Validation by RT-qPCR:
- Extract total RNA, treat with DNase I, and synthesize cDNA.
- Perform qPCR for each target gene and two reference genes (e.g., recA, rpoB) using SYBR Green chemistry.
- Calculate knockdown efficiency for gene n as: %KD = (1 - 2^(-ΔΔCt)) * 100, where ΔΔCt = (Cttarget - Ctref)sgRNA - (Cttarget - Ctref)control.
The Scientist's Toolkit: Research Reagent Solutions
| Item | Function in Experiment |
|---|---|
| dCas9-expressing E. coli Strain (e.g., JKD101) | Provides the catalytically dead Cas9 protein required for CRISPRi-mediated transcriptional repression. |
| pCRISPRi-tRNA Plasmid Backbone | Vector containing the tRNA-gRNA expression scaffold for reliable, multiplexed sgRNA production from a single transcript. |
| BsaI-HFv2 Restriction Enzyme | A high-fidelity Type IIS enzyme used in Golden Gate assembly to clone sgRNA spacers into the backbone without introducing scars. |
| Gibson Assembly Master Mix | Enables seamless, isothermal assembly of multiple DNA fragments, useful for constructing complex arrays or integrating cassettes. |
| RT-qPCR Kit with SYBR Green | For precise, quantitative validation of mRNA knockdown levels across all targeted pathway genes. |
Visualizations
Benchmarking CRISPRi Performance: Validation Strategies and Comparison to Competing Technologies
Application Notes & Protocols
Thesis Context: These techniques form the critical, multi-omics validation cascade for CRISPRi-mediated metabolic pathway regulation. RT-qPCR verifies transcriptional knockdown, proteomics confirms functional protein-level changes, and flux analysis quantifies the ultimate metabolic phenotype.
RT-qPCR for Transcriptional Validation of CRISPRi Knockdown
Application Note: Following CRISPRi-mediated gene repression, RT-qPCR is the first-line validation to quantify changes in target mRNA transcript levels. It provides rapid, sensitive, and specific confirmation of knockdown efficiency before investing in downstream protein and metabolic assays.
Protocol: One-Step SYBR Green RT-qPCR for CRISPRi-Treated Cell Lysates
Research Reagent Solutions:
- CRISPRi sgRNA & dCas9 Expression Vectors: For targeted gene repression.
- Cell Lysis Buffer (e.g., TRIzol): For simultaneous cell lysis and RNA stabilization.
- One-Step RT-qPCR Master Mix: Contains reverse transcriptase, Hot Start DNA polymerase, SYBR Green dye, dNTPs, and optimized buffer.
- Gene-Specific Primers: Validated primer pairs for target genes and housekeeping controls (e.g., GAPDH, ACTB).
- Nuclease-Free Water: For reaction setup.
- qPCR Instrument: e.g., Applied Biosystems QuantStudio, Bio-Rad CFX384.
Methodology:
- Cell Culture & Transfection: Seed target cells (e.g., HEK293T, HepG2) and transfect with CRISPRi constructs (dCas9-repressor + target-specific sgRNA). Include non-targeting sgRNA control.
- Harvest & Lysis: At 48-72h post-transfection, aspirate medium and directly lyse cells in culture plate using TRIzol reagent (e.g., 500 µL per well of a 24-well plate).
- RNA Isolation: Perform phase separation with chloroform, precipitate RNA with isopropanol, wash with 75% ethanol, and resuspend in nuclease-free water. Quantify RNA concentration via Nanodrop.
- qPCR Plate Setup: Prepare reactions on ice in a 384-well plate. For each sample (in triplicate), mix:
- 5 µL One-Step Master Mix
- 0.5 µL Forward Primer (10 µM)
- 0.5 µL Reverse Primer (10 µM)
- 2 µL RNA template (50 ng total)
- 2 µL Nuclease-Free Water
- Total Volume: 10 µL
- Run qPCR Program: Use the following thermocycling conditions:
- Reverse Transcription: 50°C for 10-15 min.
- Initial Denaturation: 95°C for 2 min.
- 40 Cycles:
- Denature: 95°C for 15 sec.
- Anneal/Extend: 60°C for 1 min (acquire SYBR Green signal).
- Data Analysis: Calculate ∆∆Ct values using housekeeping gene for normalization and the non-targeting sgRNA control as the calibrator. Percent knockdown is calculated as (1 - 2^(-∆∆Ct)) * 100%.
Table 1: Representative RT-qPCR Data for CRISPRi Targeting Glycolytic Genes
| Target Gene (Pathway) | sgRNA Type | Mean ∆Ct (vs. GAPDH) | ∆∆Ct (vs. Control) | Fold Change | % Knockdown |
|---|---|---|---|---|---|
| HK2 (Glycolysis) | Non-targeting Control | 5.2 | 0.0 | 1.00 | 0% |
| HK2 (Glycolysis) | Gene-Specific #1 | 8.1 | 2.9 | 0.13 | 87% |
| PFKP (Glycolysis) | Non-targeting Control | 6.8 | 0.0 | 1.00 | 0% |
| PFKP (Glycolysis) | Gene-Specific #1 | 9.5 | 2.7 | 0.15 | 85% |
Proteomics for Validation of Protein Abundance Changes
Application Note: Transcript knockdown does not always correlate linearly with protein abundance. Tandem Mass Tag (TMT)-based quantitative proteomics is used to confirm changes in target protein levels and identify off-target or compensatory pathway alterations post-CRISPRi.
Protocol: TMT-LC-MS/MS for Global Proteomic Profiling
Research Reagent Solutions:
- RIPA Lysis Buffer (with Protease Inhibitors): For efficient protein extraction.
- BCA Assay Kit: For protein quantification.
- TMTpro 16plex Reagent Set: Isobaric labels for multiplexing up to 16 samples.
- High-pH Reversed-Phase Fractionation Kit: For peptide fractionation to increase depth.
- LC-MS/MS System: e.g., Orbitrap Eclipse Tribrid Mass Spectrometer coupled to a nanoLC.
- Proteomics Software: e.g., Proteome Discoverer, MaxQuant.
Methodology:
- Sample Preparation: Lyse CRISPRi-treated and control cells in RIPA buffer. Reduce, alkylate, and digest proteins with trypsin/Lys-C overnight.
- TMT Labeling: Desalt peptides. Label 50 µg of peptide from each sample with a unique TMTpro channel reagent. Quench reaction, then combine all labeled samples into a single pool.
- High-pH Fractionation: Fractionate the pooled sample using a high-pH reversed-phase spin column into 8-12 fractions to reduce complexity.
- LC-MS/MS Analysis: Reconstitute fractions and analyze via nanoLC-MS/MS. Use a 2-hour gradient. MS1 spectra are acquired in the Orbitrap (120,000 resolution). MS2 (for quantification) is acquired in the Orbitrap (50,000 resolution) following higher-energy collisional dissociation (HCD).
- Data Processing: Search data against a human UniProt database. Apply reporter ion S/N thresholds for quantification. Normalize data based on total peptide amount. Only consider proteins with ≥2 unique peptides and a p-value <0.05 (ANOVA) as significantly changed.
Table 2: Key Proteomics Findings After CRISPRi of ACLY (ATP-Citrate Lyase)
| Protein | Gene | TMT Ratio (CRISPRi/Control) | p-value | Function | Implication |
|---|---|---|---|---|---|
| ATP-citrate synthase | ACLY | 0.25 | 1.2E-08 | Lipogenesis | Target validation |
| Acetyl-CoA carboxylase 1 | ACACA | 0.65 | 0.003 | Lipogenesis | Pathway co-regulation |
| AMP-activated protein kinase | PRKAA1 | 1.80 | 0.001 | Energy sensor | Compensatory upregulation |
| Pyruvate dehydrogenase | PDHA1 | 1.40 | 0.02 | Oxidative metabolism | Metabolic rewiring |
Metabolite Flux Analysis (13C-Glucose Tracing)
Application Note: To functionally validate the metabolic consequences of CRISPRi, 13C-glucose tracing via GC-MS quantifies changes in pathway fluxes (e.g., glycolysis, TCA cycle, PPP), providing the definitive phenotypic readout.
Protocol: [U-13C6]-Glucose Tracing and GC-MS Analysis
Research Reagent Solutions:
- [U-13C6]-Glucose: Tracer for central carbon metabolism.
- Glucose/Serum-Free DMEM: For tracer incubation.
- Methanol:Water:Chloroform (40:20:40) Extraction Solvent: For quenching metabolism and extracting polar metabolites.
- MSTFA (N-Methyl-N-(trimethylsilyl)trifluoroacetamide): Derivatization agent for GC-MS.
- GC-MS System: e.g., Agilent 8890 GC/5977B MS with a DB-5MS column.
Methodology:
- Tracer Experiment: Culture CRISPRi and control cells to ~80% confluence. Wash cells twice with warm, tracer-free medium. Incubate with medium containing 10 mM [U-13C6]-glucose for a defined time (e.g., 1h for glycolytic intermediates, 6-24h for TCA cycle metabolites).
- Metabolite Extraction: Quickly aspirate medium and quench cells with -20°C extraction solvent. Scrape cells, vortex, and centrifuge. Collect the aqueous (polar) layer and dry under a vacuum concentrator.
- Derivatization: Add 20 µL of methoxyamine (15 mg/mL in pyridine) to dried extracts and incubate at 70°C for 1h. Then add 30 µL MSTFA and incubate at 70°C for 30 min.
- GC-MS Analysis: Inject 1 µL of sample in splitless mode. Use a temperature gradient (60°C to 325°C). Operate MS in electron impact (EI) mode with scanning from m/z 50-600.
- Flux Data Analysis: Use software (e.g., Agilent MassHunter, SIMCA) to integrate peak areas. Correct for natural isotope abundance. Calculate % labeling (M+0, M+1, M+2, etc.) and fractional enrichment for key metabolites (e.g., lactate, alanine, citrate, succinate).
Table 3: 13C-Enrichment in Key Metabolites After CRISPRi Targeting PDH Kinase 1 (PDK1)
| Metabolite | M+0 (Control) | M+0 (CRISPRi) | M+2 Fraction (Control) | M+2 Fraction (CRISPRi) | Interpretation |
|---|---|---|---|---|---|
| Lactate | 35% | 55% | 65% | 45% | Reduced glycolytic flux? |
| Alanine | 40% | 60% | 60% | 40% | Reduced glycolytic flux? |
| Citrate (M+2) | 15% | 45% | - | - | Increased PDH flux into TCA |
| Succinate (M+2) | 12% | 38% | - | - | Increased PDH flux into TCA |
Visualizations
CRISPRi Validation Cascade
RT-qPCR Protocol Workflow
TMT Proteomics Workflow
13C-Glucose Tracing in Central Metabolism
Quantifying Knockdown Efficiency and Its Direct Impact on Metabolic Flux
Within the broader thesis on employing CRISPR interference (CRISPRi) for precise metabolic pathway regulation, this application note addresses a critical, quantitative gap: establishing a direct, causal link between gene knockdown efficiency and resulting metabolic flux alterations. The foundational principle is that dCas9-mediated transcriptional repression creates a tunable metabolic control knob. However, the relationship between target mRNA reduction (knockdown efficiency) and the downstream rerouting of metabolites (flux impact) is often nonlinear and pathway-specific. This document provides a consolidated framework for measuring both variables and modeling their interaction, essential for predictive metabolic engineering and understanding cellular homeostasis.
Table 1: Comparative Analysis of Common Methods for Quantifying Knockdown Efficiency
| Method | Target | Throughput | Quantitative Precision | Key Advantage | Key Limitation |
|---|---|---|---|---|---|
| qRT-PCR | mRNA | Medium | High (Absolute or relative) | Gold standard for transcript level; high sensitivity. | Destructive; does not measure protein or function. |
| RNA-Seq | Transcriptome | High | High (Absolute counts) | Unbiased, genome-wide context. | Cost; complex data analysis; destructive. |
| Flow Cytometry (Reporter GFP) | Protein-level activity | Very High | Medium (Population metrics) | Single-cell resolution; live-cell tracking. | Requires genetic reporter insertion. |
| Western Blot | Protein | Low | Medium-Semi (Relative abundance) | Direct protein measurement. | Low throughput; semi-quantitative; destructive. |
| Nucleofection & ELISA | Secreted Protein | Medium | High (Absolute concentration) | Functional protein output. | Applicable only for secreted factors. |
Table 2: Expected Flux Impact vs. Knockdown Efficiency for Different Metabolic Node Types
| Metabolic Node Type | Example Enzyme | Low KD (50%) Flux Impact | High KD (90%) Flux Impact | Rationale & Nonlinearity Threshold |
|---|---|---|---|---|
| Flux-Controlling (Rate-Limiting) | Phosphofructokinase (Glycolysis) | High (40-60% reduction) | Very High (>80% reduction) | Low enzyme reserve; flux is highly sensitive to small expression changes. Threshold: ~20-30% KD. |
| Redundant/Isozyme | Hexokinase (HK I, II, III) | Low (<10% reduction) | Moderate (20-40% reduction) | Genetic or functional redundancy buffers flux impact until KD exceeds compensation capacity. |
| Branch-Point Director | G6PDH (PPP entry) | Moderate (Directional shift) | High (Complete branch redirection) | Flux is diverted to alternative branch; impact is on distribution, not total throughput. |
| Synthetic Pathway Enzyme | Heterologous Tryptophan Synthase | Linear correlation | Linear correlation | In engineered pathways with no native redundancy, flux often responds linearly to enzyme level. |
Experimental Protocols
Protocol 3.1: Integrated Workflow for Coupled KD Efficiency and Flux Analysis
Objective: To concurrently measure CRISPRi-mediated mRNA knockdown and its immediate effect on central carbon metabolism flux in E. coli or mammalian cell models.
Part A: CRISPRi Strain/Cell Line Preparation & Validation
- Design and clone sgRNAs: Target the promoter or 5' coding sequence of your metabolic gene of interest (e.g., PDHA1 for pyruvate dehydrogenase). Clone into a CRISPRi vector containing a dCas9 repressor (e.g., dCas9-KRAB for mammalian cells).
- Generate stable cell lines: Deliver the CRISPRi construct via lentiviral transduction (mammalian) or chromosomal integration (bacteria). Apply selection pressure (e.g., puromycin) for 7-10 days to establish a polyclonal population.
- Baseline validation: Confirm dCas9 expression via Western blot (anti-Cas9 antibody) in the integrated line versus wild-type control.
Part B: Quantifying Knockdown Efficiency (qRT-PCR Method)
- Sample Harvest: 72 hours post-induction of sgRNA expression (if inducible) or at confluency for constitutive systems, lyse cells directly in TRIzol reagent. Include a non-targeting sgRNA control.
- RNA Isolation & cDNA Synthesis: Isolate total RNA following TRIzol manufacturer's protocol. Treat with DNase I. Synthesize cDNA using a high-capacity reverse transcription kit with random hexamers.
- Quantitative PCR: Perform triplicate qPCR reactions for the target gene and at least two stable reference genes (e.g., GAPDH, ACTB). Use a SYBR Green master mix.
- Calculation: Analyze using the comparative ΔΔCt method. Knockdown Efficiency (%) = (1 - 2^(-ΔΔCt)) * 100.
Part C: Measuring Metabolic Flux Impact (Seahorse XF Analyzer - Glycolytic Rate Assay) Note: This protocol is for real-time extracellular flux analysis of glycolytic function in adherent mammalian cells.
- Day Prior: Seed optimal cell density (e.g., 20,000-40,000 cells/well) in a Seahorse XF cell culture microplate in growth medium. Incubate overnight.
- Assay Day:
- Replace medium with Seahorse XF DMEM base medium, pH 7.4, supplemented with 10 mM glucose, 2 mM glutamine, and 1 mM pyruvate. Incubate at 37°C, non-CO₂ for 1 hour.
- Load the sensor cartridge, calibrated overnight, with compounds: Port A: 1.5 μM Rotenone & Antimycin A (mitochondrial inhibitors); Port B: 50 mM 2-Deoxy-D-glucose (2-DG, glycolytic inhibitor).
- Run the "Glycolytic Rate Assay" on the Seahorse XF Analyzer. The assay sequentially measures: (1) Basal metabolism, (2) Post-Rotenone/Antimycin A acidification (glycolytic proton efflux rate, or glycoPER), (3) Post-2-DG background measurement.
- Data Analysis: Normalize glycoPER values to total protein per well (from a post-assay BCA assay). Compare glycoPER between targeting and non-targeting sgRNA cell lines. A significant change indicates direct flux impact from the gene knockdown.
Protocol 3.2: Absolute Flux Determination via 13C-Metabolic Flux Analysis (13C-MFA)
Objective: To quantify absolute intracellular metabolic fluxes in response to gene knockdown.
- 13C-Tracer Experiment: Culture your CRISPRi and control cells in a defined medium where a key carbon source (e.g., [1,2-13C]glucose or [U-13C]glutamine) is replaced with its 13C-labeled equivalent. Achieve metabolic steady-state (typically 3-5 generations for microbes, 24-48h for mammalian cells).
- Quenching & Metabolite Extraction: Rapidly quench metabolism (e.g., cold methanol), extract intracellular metabolites, and derivatize for GC-MS analysis.
- Mass Spectrometry & Modeling: Measure mass isotopomer distributions (MIDs) of proteinogenic amino acids or central metabolites via GC-MS. Input MIDs and extracellular flux rates into dedicated software (e.g., INCA, 13CFLUX2).
- Flux Calculation: The software performs an iterative computational fit to estimate the network flux map that best explains the experimental 13C-labeling data. Compare flux distributions between KD and control conditions.
Diagrams & Visualization
Diagram 1 Title: Integrated Workflow for KD-Flux Analysis
Diagram 2 Title: Causal Logic from Knockdown to Flux Shift
The Scientist's Toolkit: Research Reagent Solutions
Table 3: Essential Materials for CRISPRi Metabolic Flux Studies
| Item | Example Product/Catalog # | Function in Context |
|---|---|---|
| dCas9 Repressor Plasmids | Addgene #71237 (pLV hU6-sgRNA hUbC-dCas9-KRAB), Addgene #85400 (pdCas9-bacteria) | Provides the catalytically dead Cas9 fused to a transcriptional repressor domain (e.g., KRAB) for programmable gene silencing. |
| sgRNA Cloning Kit | Addgene #52961 (sgRNA Oligo Duplex Annealing Protocol), Commercial Golden Gate Assembly Kits | Streamlines the insertion of target-specific 20nt guide sequences into the CRISPRi expression vector backbone. |
| Lentiviral Packaging Mix | Lenti-X Packaging Single Shots (Takara) | For safe and efficient production of lentivirus to create stable mammalian CRISPRi cell lines. |
| Seahorse XF Glycolytic Rate Assay Kit | Agilent 103344-100 | Contains optimized media and inhibitors (Rotenone/Antimycin A, 2-DG) for real-time measurement of glycolytic proton efflux. |
| 13C-Labeled Substrates | Cambridge Isotope CLM-1396 ([U-13C]Glucose), CLM-1822 ([U-13C]Glutamine) | Essential tracers for performing 13C-Metabolic Flux Analysis (13C-MFA) to quantify absolute intracellular reaction rates. |
| Metabolite Extraction Solvents | 80% Methanol/H₂O (-80°C, for quenching), Chloroform (for biphasic extraction) | Used to rapidly halt metabolism and extract polar and non-polar intracellular metabolites for LC-MS or GC-MS analysis. |
| Flux Analysis Software | INCA (Metabolic Flux Analysis), 13CFLUX2, Scipy (Python) | Computational platforms used to model metabolic networks and calculate flux distributions from 13C-labeling data. |
| High-Sensitivity RNA Kit | RNeasy Mini Kit (Qiagen) with on-column DNase digest | Ensures pure, genomic DNA-free total RNA for accurate downstream qRT-PCR quantification of knockdown efficiency. |
This application note, framed within a broader thesis on CRISPRi for metabolic pathway regulation research, delineates the strategic selection between CRISPR interference (CRISPRi) and CRISPR knockout (CRISPRko) for engineering biological pathways. The choice hinges on the research goal: permanent, complete gene inactivation (CRISPRko) versus reversible, tunable transcriptional repression (CRISPRi). This guide provides comparative data, detailed protocols, and decision frameworks to optimize metabolic engineering and functional genomics studies.
Comparative Analysis: Key Parameters
Table 1: Core Feature Comparison
| Parameter | CRISPR Knockout (CRISPRko) | CRISPR Interference (CRISPRi) |
|---|---|---|
| Mechanism | Nuclease-induced double-strand breaks (DSBs) leading to frameshift mutations via NHEJ. | Catalytically dead Cas9 (dCas9) binds to DNA to block transcription initiation or elongation. |
| Genetic Change | Permanent, irreversible genomic deletion/insertion. | Reversible, no DNA sequence alteration. |
| Efficiency | High (70-95% indels possible). Varies by target. | High (>90% repression possible). Dependent on sgRNA design and target location. |
| Tunability | Binary (on/off). Limited to heterozygous vs. homozygous effects. | Graded repression possible via sgRNA dosage, promoter strength, or fused repressor domains (e.g., KRAB). |
| Multiplexing | Possible but can be limited by efficiency and complex genotype analysis. | Highly amenable for simultaneous repression of multiple genes. |
| Off-Target Effects | Off-target DSBs can cause genomic instability. | Typically fewer concerns; off-target binding usually leads to transient repression without DNA damage. |
| Primary Application | Essential gene analysis, complete pathway inactivation, generating stable cell lines. | Fine-tuning pathway fluxes, knockdown of essential genes, dynamic regulation studies, functional genomics screens. |
| Best for Pathway Engineering | Eliminating competing or redundant pathways. | Optimizing precursor flux by titrating expression of bottleneck enzymes. |
Table 2: Quantitative Performance Metrics inE. coli& Mammalian Cells
| Metric | CRISPRko (using SpCas9) | CRISPRi (using dCas9-KRAB in HEK293) |
|---|---|---|
| Typical Knockdown/Knockout Efficiency | 80-95% indel formation (NGS measurement). | 70-95% mRNA reduction (qPCR measurement). |
| Time to Phenotype | Days to weeks (requires cell division and fixation of mutations). | Hours to days (rapid transcriptional repression). |
| Multiplexing Scale (Typical) | Up to ~10 genes concurrently. | Up to dozens of genes in pooled screens. |
| Cell Viability Impact (Essential Genes) | Lethal. | Growth defect or attenuation, enabling study. |
Decision Framework: When to Use Each Technology
The following diagram illustrates the decision logic for selecting CRISPRi or CRISPRko in a pathway engineering context.
Diagram Title: Decision Logic for CRISPRi vs CRISPRko Selection
Detailed Experimental Protocols
Protocol 1: CRISPRko for Eliminating a Competing Metabolic Pathway
Objective: To generate a stable monoclonal cell line with a permanent knockout of a gene in a competing pathway (e.g., ldhA in E. coli to reduce lactate byproduct). Materials: See "Scientist's Toolkit" below. Procedure:
- sgRNA Design & Cloning: Design two sgRNAs flanking the critical exon of the target gene (~100-500bp apart). Clone expression cassettes for SpCas9 and the sgRNAs into a single plasmid (or two compatible plasmids) using Golden Gate assembly.
- Delivery: Transform the plasmid(s) into competent E. coli via heat shock. For mammalian cells, transfect using a suitable reagent (e.g., Lipofectamine 3000).
- Selection & Clonal Isolation: Apply appropriate antibiotic selection for 48-72 hours. For mammalian cells, single-cell sort or perform limiting dilution into 96-well plates. Expand clones for 2-3 weeks.
- Genotyping:
- Extract genomic DNA from candidate clones.
- Perform PCR amplification of the target locus (~600-1000bp amplicon).
- Analyze products by agarose gel electrophoresis (deletion will cause a size shift).
- Confirm by Sanger sequencing of the PCR product.
- Phenotypic Validation: Measure the accumulation of the target byproduct (e.g., lactate) and the desired product in the growth medium via HPLC or enzymatic assays.
Protocol 2: CRISPRi for Titrating Expression of a Bottleneck Enzyme
Objective: To fine-tune the expression of a rate-limiting enzyme (aroF in E. coli tyrosine pathway) using a graded CRISPRi library. Materials: See "Scientist's Toolkit" below. Procedure:
- sgRNA Library Design: Design 5-10 sgRNAs targeting the promoter region or early coding sequence (CDS) of the gene. Vary the spacer sequence and position to achieve a range of repression strengths.
- Library Cloning: Clone the sgRNA library into a dCas9 expression plasmid (e.g., pdCas9-KRAB for mammalian cells, pCRISPRi for E. coli) via BsaI restriction sites.
- Pooled or Arrayed Delivery: For screening, transform the pooled plasmid library into your production strain. For systematic analysis, transform individual sgRNA plasmids in an arrayed format.
- Induction & Repression: Induce dCas9 expression with a titratable inducer (e.g., aTc, IPTG). Use different inducer concentrations to add a second layer of control.
- Quantitative Phenotyping: In a microplate fermenter, measure growth (OD600) and product titer (e.g., tyrosine via HPLC) over time for each strain/condition.
- Validation: Perform RT-qPCR on samples from key strains to correlate mRNA levels with sgRNA identity and final product titer. Identify the optimal repression level for maximum flux.
Pathway Engineering Workflow
The following diagram outlines a generalized workflow integrating CRISPRi and CRISPRko for metabolic pathway optimization.
Diagram Title: Integrated CRISPRi and CRISPRko Engineering Workflow
The Scientist's Toolkit: Key Reagent Solutions
| Reagent / Material | Function in Experiment | Example Product/Catalog |
|---|---|---|
| SpCas9 Nuclease Expression Plasmid | Provides the active nuclease for CRISPRko to create DSBs. | Addgene #62988 (pSpCas9(BB)-2A-Puro). |
| dCas9 Repressor Fusion Plasmid | Provides the catalytically dead Cas9 fused to a repressor domain (e.g., KRAB) for CRISPRi. | Addgene #71237 (pdCas9-KRAB) for mammalian cells; pCRISPRi (Addgene #84832) for E. coli. |
| sgRNA Cloning Vector | Backbone for efficient synthesis and cloning of target-specific guide RNAs. | Addgene #52961 (pU6-gRNA). |
| HDR Donor Template | For precise knock-in alongside CRISPRko (optional). | Single-stranded DNA oligo or double-stranded DNA plasmid. |
| NGS-based Off-Target Assay Kit | To validate specificity of CRISPRko edits. | Illumina TruSeq, GUIDE-seq reagents. |
| RT-qPCR Kit | To quantify mRNA knockdown levels in CRISPRi experiments. | TaqMan RNA-to-Ct, SYBR Green kits. |
| Cell Line-Specific Transfection Reagent | For delivering CRISPR constructs into mammalian cells. | Lipofectamine 3000, Fugene HD. |
| Clonal Isolation Medium | For isolating single-cell clones after CRISPRko. | 96-well plates with conditioned medium for mammalian cells. |
| Genomic DNA Extraction Kit | To purify DNA for genotyping edited clones. | DNeasy Blood & Tissue Kit (Qiagen). |
| ddPCR Mutation Detection Kit | For sensitive quantification of indel efficiency in pooled populations. | Bio-Rad ddPCR CRISPR Mutation Detection Kit. |
Within the context of metabolic pathway regulation research, precise and durable gene silencing is paramount. CRISPR interference (CRISPRi), RNA interference (RNAi), and antisense oligonucleotides (ASOs) represent three primary technologies for targeted gene knockdown. This application note provides a comparative analysis of their specificity, durability, and workflow, supplemented by detailed protocols for implementing CRISPRi in metabolic engineering studies.
Quantitative Comparison of Key Parameters
Table 1: Core Technology Comparison
| Parameter | CRISPRi | RNAi (siRNA/shRNA) | Antisense Oligonucleotides (ASOs) |
|---|---|---|---|
| Mechanism | dCas9 blocks transcription initiation/elongation | RISC-mediated mRNA cleavage or translational repression | RNase H-mediated mRNA degradation or steric blockade |
| Target Site | DNA (promoter/gene body) | Cytoplasmic mRNA | Nuclear/Cytoplasmic mRNA/pre-mRNA |
| Specificity (Off-target Potential) | High (defined by sgRNA sequence) | Moderate (seed-region mediated off-targets) | High (chemical modifications improve specificity) |
| Durability of Effect | Long-term (days to weeks, stable expression) | Transient (siRNA: days; shRNA: can be stable) | Moderate (weeks, depends on pharmacokinetics) |
| Typical Knockdown Efficiency | 70-95% | 70-90% | 60-85% (highly variable by design) |
| Primary Application Context | Stable cell lines, functional genomics, multiplexing | Transient knockdowns, drug target validation | Therapeutics, splice modulation, in vivo applications |
| Key Advantages | High specificity, programmability, multiplexible, reversible | Rapid deployment, well-established protocols | Can target splice variants, in vivo efficacy |
| Key Limitations | Requires delivery of large dCas9 protein, possible CRISPRi saturation | Off-target effects, saturation of endogenous machinery | Costly synthesis, potential for immune activation |
Table 2: Workflow and Practical Considerations
| Aspect | CRISPRi Workflow | RNAi Workflow | ASO Workflow |
|---|---|---|---|
| Design Tool | sgRNA design algorithms (e.g., CRISPick) | siRNA design tools (e.g., Dharmacon) | Sophisticated algorithms for gapmer/steric blocking |
| Reagent Format | Plasmid or viral vector for dCas9 + sgRNA | Synthetic siRNA or shRNA expression vector | Chemically modified single-stranded DNA |
| Delivery Method | Lentivirus, electroporation, transfection | Lipofection, electroporation | Gymnotic delivery, lipofection, conjugation |
| Time to Result | Slower (requires stable line generation) | Fast (knockdown in 24-72h) | Medium (hours to days for effect) |
| Multiplexing Capacity | High (multiple sgRNAs) | Limited (competition for RISC) | Limited (empirical combination testing) |
| Cost per Gene Target | Medium-High (initial setup) | Low (transient) | Very High (synthesis) |
Detailed Protocols
Protocol 1: CRISPRi for Repression of a Metabolic Pathway Gene in Mammalian Cells
Objective: Establish a stable CRISPRi cell line for long-term repression of a target enzyme in a biosynthetic pathway.
Materials (Research Reagent Solutions):
- dCas9-KRAB Expression Plasmid: Source of deactivated Cas9 fused to transcriptional repression domain KRAB.
- Lentiviral sgRNA Expression Vector (e.g., pLV-sgRNA): For stable integration and expression of target-specific sgRNA.
- HEK293T or Target Cell Line: Cultured in appropriate medium (e.g., DMEM + 10% FBS).
- Lentiviral Packaging Plasmids (psPAX2, pMD2.G): For production of VSV-G pseudotyped lentivirus.
- Polybrene (Hexadimethrine bromide): Enhances viral transduction efficiency.
- Puromycin or appropriate antibiotic: For selection of transduced cells.
- Lipofection Reagent (e.g., Lipofectamine 3000): For plasmid transfection.
- qPCR Reagents: For quantifying mRNA knockdown (e.g., SYBR Green).
- Western Blot Reagents: For quantifying protein knockdown (SDS-PAGE gel, antibodies, etc.).
Method:
- sgRNA Design: Using a tool like CRISPick, design a 20-nt sgRNA sequence targeting the transcriptional start site (TSS) or early exon of your target metabolic gene. Clone this into the BsmBI site of your lentiviral sgRNA vector.
- Lentivirus Production:
- In a 6-well plate, co-transfect HEK293T cells with the sgRNA vector, psPAX2, and pMD2.G using Lipofectamine 3000.
- Replace medium after 6-8 hours.
- Harvest virus-containing supernatant at 48 and 72 hours post-transfection. Filter through a 0.45µm filter.
- Cell Line Generation:
- Ensure your target cell line stably expresses dCas9-KRAB (generate or obtain separately).
- Transduce dCas9-expressing cells with the harvested lentivirus in the presence of 8µg/mL Polybrene.
- 48 hours post-transduction, begin selection with puromycin (concentration determined by kill curve).
- Maintain selected cells for ≥7 days to form a stable polyclonal pool.
- Validation of Knockdown:
- Extract total RNA from the stable pool and control cells.
- Perform reverse transcription and qPCR using primers flanking the target site. Normalize to housekeeping genes (e.g., GAPDH). Expect 70-95% mRNA reduction.
- Validate at protein level via Western blot for the target enzyme.
- Metabolic Phenotyping: Assay the desired metabolic output (e.g., metabolite concentration via LC-MS, flux analysis) to confirm functional repression.
Protocol 2: Comparative Transient Knockdown Using siRNA
Objective: Achieve rapid, transient knockdown of the same metabolic gene for comparison.
Materials:
- Validated siRNA Pool: Targeting your gene of interest and a non-targeting control.
- Lipofection Reagent (e.g., RNAiMAX): Optimized for siRNA delivery.
- Opti-MEM Reduced Serum Medium: For complex formation.
- Target Cell Line.
Method:
- Reverse Transfection: Dilute siRNA (final concentration 10-50nM) in Opti-MEM. Add RNAiMAX, mix, and incubate 5-20 min at RT.
- Cell Seeding: Trypsinize and resuspend target cells in complete medium without antibiotics. Add cell suspension directly to the siRNA-lipid complexes in a culture plate.
- Incubation: Assay knockdown 48-72 hours post-transfection.
- Validation: Perform qPCR and/or Western blot as in Protocol 1, Step 4.
Visualizations
Diagram Title: CRISPRi Stable Cell Line Generation Workflow
Diagram Title: Gene Silencing Mechanisms Comparison
Diagram Title: Key Factors Influencing Specificity
The Scientist's Toolkit: Essential Reagents for CRISPRi Metabolic Research
Table 3: Key Research Reagent Solutions
| Reagent/Material | Function in CRISPRi Experiments |
|---|---|
| dCas9-KRAB Expression System | Provides the core silencing machinery. KRAB domain recruits repressive chromatin modifiers. |
| Lentiviral sgRNA Backbone | Enables stable genomic integration and long-term, inducible (if desired) sgRNA expression. |
| Next-Generation Sequencing Kits | For verifying genomic target occupancy (ChIP-seq) and assessing transcriptome-wide specificity (RNA-seq). |
| Metabolite Assay Kits (e.g., LC-MS/MS) | To quantitatively measure changes in pathway intermediates and products following gene repression. |
| Antibiotics for Selection | (e.g., Puromycin, Blasticidin). Critical for generating stable, homogeneous cell pools. |
| Lipofection/Electroporation Reagents | For efficient delivery of CRISPRi plasmids or ribonucleoproteins (RNPs) into hard-to-transfect primary cells. |
| Validated qPCR Assays | For rapid, quantitative assessment of transcriptional knockdown of target and potential off-target genes. |
| dCas9-Specific Antibodies | For verifying dCas9-KRAB protein expression levels via Western blot or immunofluorescence. |
Application Notes
This document, framed within a thesis on CRISPRi for metabolic pathway regulation, compares two primary methods for gene and protein function modulation in industrial biotechnology and drug development: CRISPR interference (CRISPRi) and small molecule inhibitors. The choice between these technologies impacts experimental design, timelines, and economic feasibility for scaling.
Precision & Specificity: CRISPRi offers unparalleled DNA-level specificity by using a catalytically dead Cas9 (dCas9) fused to a transcriptional repressor (e.g., KRAB) to bind specific genomic loci via a guide RNA (gRNA). This prevents off-target transcriptional activation but can have guide RNA-mediated off-target DNA binding. Small molecule inhibitors bind to defined pockets on proteins, but cross-reactivity with structurally similar proteins in proteomes is a common cause of off-target effects.
Cost & Development Time: Small molecule discovery is a high-cost, lengthy process involving high-throughput screening, lead optimization, and extensive toxicity studies. CRISPRi system development is faster and cheaper once genomic targets are identified, involving gRNA design and vector construction. However, delivery (especially in vivo) and stable cell line generation can add significant cost and time.
Scalability for Industrial Applications: For metabolic engineering in microbial fermentation, CRISPRi enables multiplexed, tunable knockdown of competing pathways without genomic DNA cleavage, allowing dynamic control of flux. Scaling requires robust delivery and stable integration. Small molecule inhibitors are easily scalable for additive-based processes (e.g., in bioreactors) but incur recurring material costs and potential environmental removal challenges.
Regulatory & Practical Considerations: Small molecule inhibitors are well-understood by regulators but require full toxicological profiling. CRISPRi-based therapies or production organisms may face more complex regulatory pathways due to genetic modification concerns.
Comparative Data Tables
Table 1: Core Characteristics Comparison
| Parameter | CRISPRi | Small Molecule Inhibitor |
|---|---|---|
| Target | DNA (gene transcription) | Protein (active/allosteric site) |
| Specificity Mechanism | Watson-Crick base pairing (gRNA:DNA) | 3D structural complementarity |
| Typical Development Timeline | 2-6 months (for new construct) | 3-10 years (for new clinical candidate) |
| Typical R&D Cost per Target | $500 - $5,000 (reagents, design) | $1M - $100M+ (screening, optimization) |
| Ease of Scalability (Process) | Moderate-High (requires stable line) | High (additive to media) |
| Reversibility | Reversible (inducible systems) | Often reversible (competitive/non-competitive) |
| Major Risk | Off-target binding, delivery efficiency | Off-target protein binding, toxicity |
Table 2: Metabolic Pathway Regulation inE. coli(Example: Succinate Production)
| Strategy | Target Gene | Modality | Titer Increase | Key Cost Factor |
|---|---|---|---|---|
| CRISPRi knockdown | ldhA, ackA | dCas9-KRAB + gRNAs | 45% vs. wild type | Stable line generation & IP |
| Small Molecule Inhibition | Lactate Dehydrogenase | e.g., Oxamate (inhibitor) | 22% vs. wild type | Recurring inhibitor purchase |
| Combined Approach | ldhA (CRISPRi) + LDH (Inhibitor) | Dual repression | 58% vs. wild type | Combined material costs |
Experimental Protocols
Protocol 1: CRISPRi Knockdown for Metabolic Flux Analysis inE. coli
Objective: To repress a competing pathway gene (ldhA) in a succinate-overproducing E. coli strain and measure metabolite flux changes.
Key Research Reagent Solutions:
| Item | Function |
|---|---|
| dCas9-KRAB Expression Plasmid | Constitutive expression of the silencing protein. |
| gRNA Expression Vector (Targeting ldhA) | Contains scaffold and target-specific 20nt spacer. |
| Chemically Competent E. coli Production Strain | Host for genetic modification. |
| LB Medium + Appropriate Antibiotics | For selection and maintenance of plasmids. |
| M9 Minimal Media with Glucose | Defined medium for fermentation experiments. |
| RNAprotect Bacteria Reagent | Stabilizes RNA for transcriptional analysis. |
| qPCR Kit with SYBR Green | Quantifies ldhA mRNA knockdown efficiency. |
| HPLC System with RI/UV Detector | Quantifies extracellular metabolites (succinate, lactate, acetate). |
Methodology:
- gRNA Design & Cloning: Design a 20nt spacer sequence complementary to the non-template strand of the ldhA promoter or early coding sequence using a validated algorithm (e.g., CHOPCHOP). Clone spacer into the gRNA expression vector via BsaI Golden Gate assembly.
- Co-transformation: Co-transform the dCas9-KRAB plasmid and the ldhA-targeting gRNA plasmid (or a single plasmid encoding both) into the production strain. Select on double-antibiotic plates.
- Validation of Knockdown: Inoculate single colonies in liquid media with antibiotics. At mid-log phase, harvest cells for RNA extraction. Perform qPCR to assess ldhA transcript levels relative to a control strain with non-targeting gRNA.
- Batch Fermentation: Inoculate 50mL of M9 minimal media in a baffled flask. Cultivate at 37°C, 250 rpm. Take samples every 2-3 hours for OD600 measurement and HPLC analysis of culture supernatant.
- Data Analysis: Calculate specific glucose consumption rate and succinate/lactate/acetate production rates. Compare fluxes between CRISPRi strain and control.
Protocol 2: Dose-Response Profiling of a Small Molecule Inhibitor in a Cell-Based Assay
Objective: To determine the potency (IC50) and cytotoxicity of a candidate small molecule inhibitor on a target enzyme's cellular activity.
Key Research Reagent Solutions:
| Item | Function |
|---|---|
| Target Cell Line | Cells expressing the protein target of interest. |
| Small Molecule Inhibitor (Lyophilized) | The compound for testing. |
| DMSO (Cell Culture Grade) | Solvent for compound reconstitution and dilution. |
| Cell Viability/Cytotoxicity Assay Kit (e.g., MTT, CellTiter-Glo) | Measures metabolic activity as a proxy for cell health. |
| Target-Specific Activity Assay Kit (e.g., Phospho-antibody ELISA) | Quantifies direct downstream effect of target inhibition. |
| Black-walled, Clear-bottom 96-well Plates | For cell culture and fluorescence/luminescence reading. |
| Multi-channel Pipette | For efficient reagent dispensing across plates. |
Methodology:
- Compound Preparation: Reconstitute lyophilized compound in DMSO to create a 10 mM master stock. Perform serial dilutions in DMSO to create a 100x working stock series (e.g., from 10 µM to 100 µM).
- Cell Seeding: Seed target cells in 96-well plates at optimal density (e.g., 5,000 cells/well in 90 µL medium). Incubate overnight.
- Compound Treatment: Add 1 µL of each 100x compound working stock to respective wells (final DMSO concentration 1%). Include vehicle-only (DMSO) and positive control (e.g., known inhibitor) wells. Perform in triplicate.
- Incubation: Incubate plates for 72 hours under standard cell culture conditions.
- Dual-Endpoint Assay: a) Viability Assay: Add 10 µL of CellTiter-Glo reagent per well, shake, incubate for 10 min, and record luminescence. b) Target Engagement Assay: For a different plate treated in parallel, lyse cells and use a phospho-specific ELISA to measure inhibition of the target signaling pathway.
- Data Analysis: Normalize luminescence/fluorescence values to vehicle control. Plot dose-response curves. Use non-linear regression to calculate IC50 for viability and target inhibition.
Visualizations
Diagram Title: CRISPRi Experimental Workflow for Metabolic Engineering
Diagram Title: Mechanism of Action: Small Molecule vs. CRISPRi
Conclusion
CRISPRi has emerged as an indispensable, precise, and flexible tool for metabolic pathway regulation, enabling fine-tuning of gene expression that is often unattainable with traditional knockout methods. By mastering its foundational principles, rigorous application methodology, systematic troubleshooting, and comparative validation, researchers can reliably engineer metabolic networks for enhanced bioproduction and target discovery. The future of CRISPRi lies in developing more sophisticated orthogonal systems, integrating dynamic sensors for closed-loop metabolic control, and translating these approaches into human cell therapies for metabolic disorders. As the field progresses, CRISPRi is poised to become a cornerstone technology in both industrial biotechnology and next-generation therapeutic development.