Preventing Data Loss: A Comprehensive Guide to Cross-Contamination Control in High-Density Microwell Arrays for Drug Discovery
This article provides a comprehensive guide for researchers and drug development professionals on managing cross-contamination in high-density microwell arrays, a critical yet often overlooked challenge in high-throughput screening (HTS).
Preventing Data Loss: A Comprehensive Guide to Cross-Contamination Control in High-Density Microwell Arrays for Drug Discovery
Abstract
This article provides a comprehensive guide for researchers and drug development professionals on managing cross-contamination in high-density microwell arrays, a critical yet often overlooked challenge in high-throughput screening (HTS). We explore the fundamental sources and impacts of contamination in 384-well, 1536-well, and emerging ultra-high-density plates. The guide details current best practices and methodologies for preventing liquid transfer artifacts, cell migration, and aerosol dispersion. It further presents a systematic troubleshooting framework for identifying contamination sources, optimizing assay design and liquid handling protocols, and validating results through robust controls and data analysis. By synthesizing foundational knowledge with practical application and validation strategies, this article aims to enhance data integrity, reproducibility, and confidence in critical screening workflows.
Understanding the Enemy: Defining Cross-Contamination Sources and Impacts in Microwell Arrays
What is Cross-Contamination? Operational Definitions for HTS and Cell-Based Assays
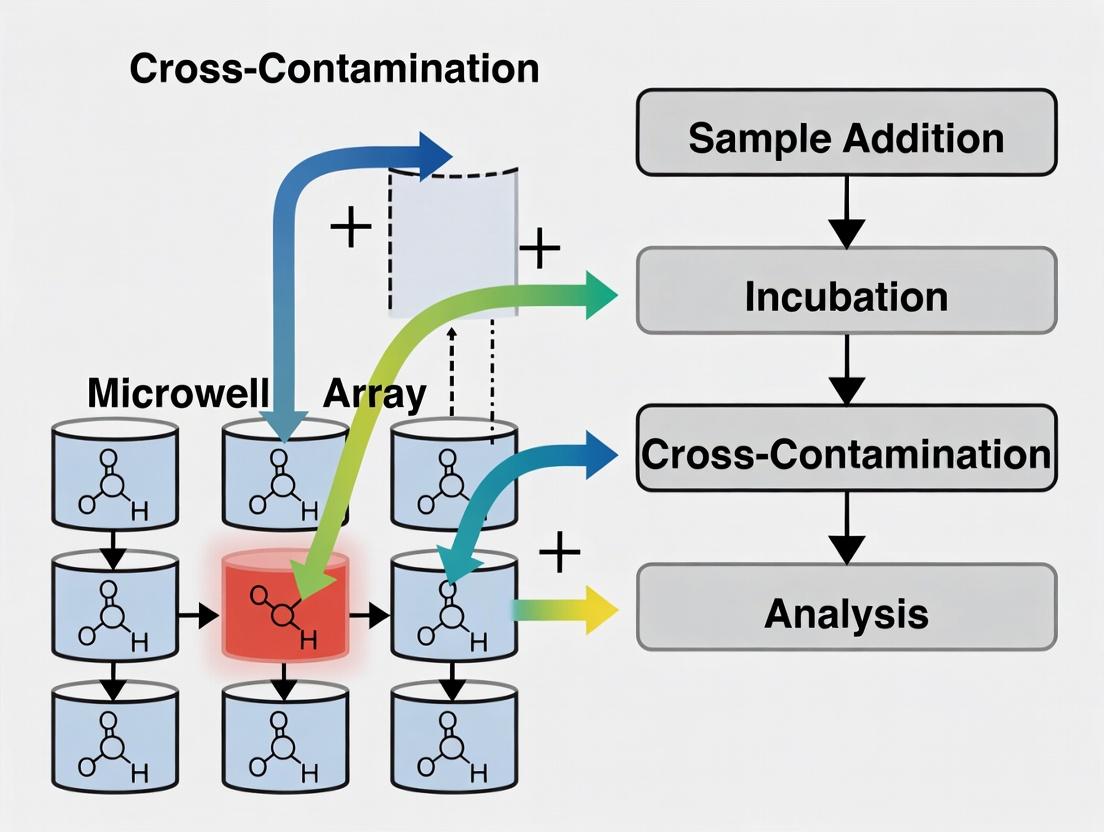
Cross-contamination in High-Throughput Screening (HTS) and cell-based assays refers to the unintended transfer of biological material, chemical compounds, or other agents between wells, samples, or experiments. This compromises data integrity by causing false positives, false negatives, or misleading dose-response signals. In high-density microwell arrays (e.g., 384, 1536-well), the primary mechanisms are liquid aerosol generation during pipetting, capillary action via tips, and spillage or "splash-over" events.
Technical Support Center
Troubleshooting Guides & FAQs
Q1: We observe a consistent "edge effect" in our 384-well cell viability assay, where outer wells show increased cytotoxicity. Is this cross-contamination? A: This is likely environmental cross-contamination due to evaporation in peripheral wells, leading to compound concentration and osmolality shifts. It can be mistaken for compound splash-over.
- Solution: Use a microplate sealer designed for long-term incubation. Employ plate humidifiers or stack plates to minimize evaporation gradients. Consider using internal edge wells for controls only.
Q2: Our HTS fluorescent readout shows a repeating pattern of high signal every 4th column. What could cause this? A: This is a classic symptom of tip-based carryover contamination from a multi-channel pipettor or liquid handler.
- Solution:
- Implement a robust liquid handler washing protocol between compound additions. Use a wash solution compatible with your compounds (e.g., DMSO wash for compound libraries).
- Perform a "carryover test": Dispense a high-concentration fluorescent tracer into column 1, then run your protocol across the plate. Measure residual signal in subsequent wells to quantify and troubleshoot carryover.
- Consider using disposable tips for critical transfer steps.
Q3: In our co-culture assay, we detect markers from one cell type in wells seeded only with the other type. What are the likely sources? A: This indicates biological cross-contamination, likely from aerosol generation during medium aspiration or cell seeding.
- Solution:
- Change pipette tips after every aspiration step, even within the same well.
- Use individual reagent reservoirs for different cell lines; do not share bottles.
- Maintain physical separation in the biosafety cabinet when working with multiple cell lines simultaneously. Work from clean to potentially contaminated materials.
Q4: Our dose-response curves are irreproducible, with high variability in IC50 values between runs. Could cross-contamination be a factor? A: Yes. Low-level compound carryover can significantly alter apparent potency, especially in sensitive assays.
- Protocol for Diagnosing Compound Carryover:
- Prepare a "donor" plate with a high-concentration (e.g., 10 mM) of a visible or easily detectable compound in a checkerboard pattern.
- Run your standard liquid transfer protocol to an "acceptor" assay plate containing buffer or cells.
- Use a relevant detection method (UV absorbance, LC-MS, or a sensitive functional assay) to measure transfer into the acceptor wells.
- Calculate the percentage carryover. Industry standards for acceptable carryover are typically <0.1%.
Table 1: Common Cross-Contamination Sources & Mitigation Efficacy
| Source Mechanism | Typical Artifact | Mitigation Strategy | % Reduction in Incident (Data Range) |
|---|---|---|---|
| Aerosolization (Pipetting) | Random false positives | Use filter tips; slow pipetting speed | 85-95% |
| Capillary Tip Carryover | Patterned false signals (column/row) | Automated tip wash (DMSO/PBS); disposable tips | 95-99.5% |
| Spillage/Splash-Over | High signal in adjacent wells | Reduce dispense height; use low-splash liquids | 70-90% |
| Evaporation (Edge Effects) | Peripheral well signal drift | Plate sealing, humidified incubation | 90-99% |
| Cell Detachment/Transfer | Mixed phenotype in wells | Careful aspiration; physical workspace separation | 80-95% |
Table 2: Acceptable Carryover Thresholds by Assay Type
| Assay Type | Maximum Tolerable Carryover | Typical Detection Method for Testing |
|---|---|---|
| High-Potency Compound Screening (nM IC50) | < 0.01% | LC-MS/MS, Radioactive Tracer |
| Cell-Based Viability/Proliferation | < 0.1% | Fluorescent Dye (e.g., AlamarBlue) |
| Biochemical Enzyme Assay | < 0.5% | UV/Vis Absorbance |
| Genomic/PCR-Based Assay | < 0.001% | qPCR for Contaminant DNA/RNA |
Experimental Protocols
Protocol 1: Quantitative Liquid Handler Carryover Assessment Objective: To measure the percentage of compound transferred between wells by an automated liquid handler. Materials: Liquid handler, source compound (10 mM in DMSO, with tracer), acceptor plate (buffer), detection system. Steps:
- Fill specified wells in a source plate with the high-concentration compound solution.
- Program the liquid handler to perform the transfer from the source plate to the acceptor plate, mimicking the screening protocol.
- Crucially, immediately after this transfer, program the instrument to perform the same transfer sequence from a clean source plate to a fresh acceptor plate. This second transfer measures residual carryover in the tips or probes.
- Measure the signal in both acceptor plates.
- Calculation: % Carryover = (Signal in 2nd Acceptor Plate / Signal in 1st Acceptor Plate) * 100.
Protocol 2: Cell Line Cross-Contamination Check via STR Profiling Objective: To confirm the genetic identity of cell lines used in an assay series. Materials: Cell pellets, STR profiling kit, PCR machine, capillary sequencer. Steps:
- Extract genomic DNA from cell pellets of each stock and from a representative assay plate well.
- Amplify a standardized panel of Short Tandem Repeat (STR) loci via PCR.
- Separate and size the PCR fragments using capillary electrophoresis.
- Compare the resulting STR profile to known reference profiles (e.g., ATCC database). A match of ≥80% is typically required for identity confirmation. Discrepancies indicate cross-contamination.
Visualizations
Title: Cross-Contamination Points & Mitigation in Assay Workflow
Title: Cross-Contamination Mechanisms and Assay Artifacts
The Scientist's Toolkit: Research Reagent Solutions
Table 3: Essential Materials for Preventing Cross-Contamination
| Item | Function | Key Consideration |
|---|---|---|
| Low-Adhesion/Filter Pipette Tips | Prevents aerosol and liquid retention in the tip barrel, reducing carryover. | Use for all compound and cell culture reagent transfers. |
| Plate Sealers (Foil/Pierceable) | Creates a vapor barrier to prevent evaporation and well-to-well aerosol migration. | Ensure compatibility with incubation temperatures and detector. |
| Dedicated Reagent Reservoirs | Prevents liquid-level cross-contact between different reagents or conditions. | Use disposable reservoirs or implement strict decontamination protocols. |
| Liquid Handler Wash Solvent | Flushes probes/dispensers between additions to remove residual compound. | Solvent must be compatible with compounds (e.g., DMSO for libraries) and system components. |
| Fluorescent/Colored Tracers | Used in diagnostic tests to visualize and quantify droplet formation and carryover. | Choose a tracer detectable by your plate reader that does not interfere with assays. |
| STR Profiling Kit | Gold-standard for authenticating cell lines and detecting biological contamination. | Perform regularly on frozen stocks and after long-term culture. |
Troubleshooting Guides & FAQs
Section 1: Liquid Handling Artifacts
Q1: We observe inconsistent cell viability and growth patterns across our 384-well plate after seeding. Could this be due to liquid handling? A: Yes. Inconsistent tip wetting, variable dispensing speed, and droplet retention can lead to uneven cell distribution. Implement a "prime tips" step with media before dispensing cells and calibrate your liquid handler for low-volume (<10 µL) accuracy. Use a fluorescent dye to validate dispensing uniformity across the plate.
Q2: Our assay controls show cross-talk between adjacent wells in high-density arrays. What is the most likely artifact and solution? A: This is often due to droplet ejection or "saucer" formation during high-speed pipetting. Solutions:
- Reduce pipetting speed, especially during aspiration.
- Use low-retention, filter-equipped tips to prevent aerosol generation.
- Employ a "touch-off" step against the well wall.
- Consider acoustic liquid handling for non-contact dispensing, which eliminates this risk.
Protocol: Fluorescent Dye Uniformity Test
- Objective: Quantify liquid handling precision.
- Materials: 1X PBS, 10 µM fluorescein solution, target 384-well plate, microplate reader.
- Steps:
- Program your liquid handler to dispense 5 µL of fluorescein solution into all wells of the plate.
- Run the program. Include a "prime tips" step if available.
- Read fluorescence (Ex/Em ~485/535 nm) on a plate reader.
- Calculate the coefficient of variation (CV%) for the entire plate and by sector.
- Acceptance Criteria: CV% < 10% for robust assays; <15% may be acceptable for some screens.
Section 2: Aerosol Contamination
Q3: After running a long-term co-culture experiment, we detected the target gene of Well A1 in Well H12 via qPCR. How did this happen? A: This is a classic sign of aerosol contamination during plate manipulation, likely from repeated lid removal or vigorous mixing. Airborne droplets can travel significant distances across a plate. Always use a plate seal during incubation and vortexing. Perform PCR setup in a physically separate location from post-assay plate processing.
Q4: How can we definitively trace and confirm aerosol contamination? A: Implement an "aerosol sentinel" assay.
- Protocol:
- Fill alternating columns of a 384-well plate with a medium containing a non-pathogenic tracer (e.g., GFP-labeled E. coli at low concentration, or a unique, inert DNA plasmid).
- Fill the remaining columns with sterile medium only.
- Subject the plate to your standard experimental workflow (lid on/off, shaking, handling).
- Incubate and then assay all wells for the tracer (via fluorescence or qPCR for the plasmid).
- Map positive wells to visualize aerosol drift patterns.
Section 3: Cell Migration Pathways
Q5: In a migration/invasion assay, we see cells appearing in supposedly empty control wells. Is this migration or contamination? A: This could be physical migration via micro-scratches or under the plate septum in some transwell systems, or it could be cell carryover during media changes. Distinguish by:
- Microscopy: Check for migratory tracks.
- End-point Genotyping: If the cells are isogenic, it's likely migration. If genetically distinct, it's likely carryover contamination.
- Prevention: For migration, ensure a clear, consistent gap in scratch assays and check transwell membrane integrity. For carryover, change tips for every well during media changes, even when using a multichannel pipette.
Q6: What is the best practice for media changes in long-term cultures to prevent cross-well cell migration? A: Use "tip-one-well" policy for all media changes in migration-sensitive studies. Never use the same tip for more than one well, even on a multichannel. Tilt the plate during aspiration to pool fluid away from cells. Consider using semi-porous membrane seals that allow gas exchange but physically block aerosols and migrating cells.
Data Presentation
Table 1: Cross-Contamination Incident Root Cause Analysis
| Contaminant Detected | Source Well | Recipient Well | Likely Culprit | Corrective Action | Post-Action CV% |
|---|---|---|---|---|---|
| GFP Signal (Microbeads) | A1 (High Conc.) | B1, A2 | Liquid Handling: Droplet Ejection | Reduced pipette speed; Low-retention tips | 8.5% |
| Unique DNA Plasmid | Column 1 | Columns 2-4 (Gradient) | Aerosol: Lid Removal & Vortexing | Use of pierceable sealing film; Separate vortex area | N/A (Qualitative) |
| MCF-7 Cells (Human) | Well D5 | Well D6 | Cell Migration: Micro-scratch gap < 50µm | Standardized scratch tool; Pre-coat with inhibitory agent | N/A (Visual Confirm) |
| HeLa Cell RNA | Multiple | Random Wells | Liquid Handling: Tip Aerosol Carryover | Implemented filter tips; Mandatory tip change between wells | 12.1% -> 4.7% |
Table 2: Key Research Reagent Solutions & Materials
| Item | Function / Rationale |
|---|---|
| Low-Retention, Filtered Pipette Tips | Minimizes droplet retention and prevents aerosol from entering the pipette shaft, reducing liquid handling artifacts and aerosol contamination. |
| Pierceable, Optically Clear Plate Seals | Allows gas exchange while creating a physical barrier against aerosols and maintaining sterility during shaking and incubation. |
| Fluorescent Tracers (e.g., Fluorescein, GFP-plasmid) | Enables quantitative validation of liquid handling precision and qualitative mapping of aerosol drift pathways. |
| Extracellular Matrix (ECM) Inhibitors (e.g., Anti-integrin antibodies) | Coated around well edges or in control wells to inhibit aberrant cell migration pathways. |
| Acoustic Liquid Handler | Non-contact dispensing eliminates the primary causes of droplet-based cross-contamination, ideal for assay miniaturization. |
| Automated Plate Washer with Independent Nozzles | Prevents cross-well aspirate stream contact, crucial for washing steps post-migration/invasion assays. |
Mandatory Visualizations
Technical Support Center
Troubleshooting Guide: Assay Performance Issues
Issue 1: Deteriorating Z'-factor in High-Throughput Screening (HTS)
- Symptom: Z'-factor, a statistical measure of assay robustness, drops below 0.5, indicating a poor separation band between high and low controls.
- Potential Cause (Contamination-Related): Residual compounds, solvents, or biomolecules from previous experiments in the microwell array are causing elevated background signal or interfering with the target reaction.
- Diagnostic Steps:
- Run control wells (positive, negative, blank) in a checkerboard pattern across the plate. A non-uniform signal pattern often indicates localized contamination.
- Compare the standard deviation (SD) of high and low controls. A disproportionate increase in SD of the low control suggests contaminant-induced signal amplification.
- Perform a plate reader pre-scan (e.g., fluorescence top read before adding reagents) to detect fluorescent contaminant residues.
Issue 2: Inconsistent or Skewed Dose-Response Curves
- Symptom: Replicate dose-response curves show poor reproducibility, shifted IC50/EC50 values, or altered Hill slopes.
- Potential Cause (Contamination-Related): Carryover of a high-concentration compound from one well to an adjacent well during liquid handling, or enzymatic/ cellular residue altering compound bioavailability.
- Diagnostic Steps:
- Test a known standard compound in a fresh, meticulously cleaned plate versus a plate used in previous cycles. A significant shift in potency indicates systemic contamination.
- Run a "mock" dose-response with compound diluent only to check for background trends.
- Inspect curves for "hook effects" or non-monotonic behavior at high doses, which can signal compound aggregation or interference from contaminants.
Frequently Asked Questions (FAQs)
Q1: How can I quickly diagnose if my assay's poor Z'-factor is due to cross-contamination versus a failed reagent batch? A: Perform a simple two-part test. First, run your standard assay protocol on a brand new, certified clean plate. Second, run the same protocol on your routinely washed/reused plate stack. Compare the Z'-factors. If the new plate shows a significantly better Z'-factor (e.g., >0.7 vs. <0.5), cross-contamination from inadequate washing is the likely culprit. If both are poor, investigate reagent integrity and preparation.
Q2: What is the most common source of contamination in dose-response experiments using acoustic droplet ejection (ADE) or pin tools? A: Aerosol generation is a primary risk. For ADE, satellite droplets or acoustic energy can create a fine mist. For pin tools, splashing or incomplete solvent evaporation between transfers can lead to nanoliter-scale carryover. This is critical in high-density arrays (1536-well) where well spacing is minimal. Implementing a "dry" dwell time for pins and using optimized acoustic parameters are essential.
Q3: Our lab reuses polypropylene microwell plates. What is the most effective washing protocol to prevent compound carryover? A: A sequential wash with three solvents is recommended for small molecule decontamination: 1) DMSO to dissolve and flush residual compound, 2) Water to remove DMSO and salts, 3) Ethanol (70-100%) to disinfect, remove lipids, and promote rapid drying. Always include a final validation step using a sensitive fluorescence-based assay to detect any residual contaminants. See protocol table below.
Experimental Protocols for Decontamination & Validation
Protocol 1: Rigorous Microwell Array Decontamination
- Purpose: To eliminate small molecule and proteinaceous contaminants from reused polypropylene plates.
- Materials: Plate washer (or manual multichannel pipette), DMSO, deionized water, 100% ethanol, vacuum aspirator, nitrogen blow-down station.
- Method:
- Aspirate any residual liquid from the plate.
- Fill all wells with 100% DMSO. Let stand for 5 minutes with gentle agitation.
- Completely aspirate DMSO.
- Fill all wells with deionized water. Agitate for 2 minutes. Aspirate completely. Repeat this water wash a total of three times.
- Fill all wells with 100% ethanol. Agitate for 2 minutes. Aspirate completely.
- Dry plates thoroughly under a stream of filtered nitrogen for at least 30 minutes or in a vacuum desiccator for 1 hour.
- Critical Note: For cell-based assays, ensure plates are sterilized under UV light after drying.
Protocol 2: Validation of Washing Efficacy via Tracer Compound
- Purpose: To quantitatively measure residual compound carryover after a washing cycle.
- Materials: A fluorescent tracer compound (e.g., fluorescein, ~500 Da), clean destination plate, plate-reading fluorometer.
- Method:
- Prepare a source plate with tracer compound at a high concentration (e.g., 10 mM in DMSO) in a defined pattern (e.g., every other column).
- Using your standard liquid transfer method, transfer compound from the source plate to an intermediate "test" plate.
- Subject the intermediate plate to the washing protocol being validated.
- After washing/drying, add assay buffer to all wells of the intermediate plate.
- Perform a second transfer from the intermediate plate to a fresh, clean destination plate.
- Measure fluorescence in the destination plate. Any signal above background indicates carryover from the washed plate.
- Calculate the percentage carryover.
Table 1: Impact of Contaminant Type on Assay Parameters
| Contaminant Class | Primary Effect on Dose-Response | Typical Impact on Z'-factor | Example Source |
|---|---|---|---|
| Residual Solvent (DMSO) | Alters compound solubility & apparent potency. | Moderate decrease (increases SD of controls). | Incomplete washing, evaporation. |
| Enzyme/Protein Residue | Can consume substrate or cofactor, skewing kinetics. | Severe decrease (alters dynamic range). | Adsorption to plastic, insufficient washing. |
| Detergent Carryover | Disrupts cell membranes or protein interactions. | Severe decrease (can abolish signal). | Automated washer line contamination. |
| Small Molecule (High Conc.) | Causes false positives/negatives in adjacent wells. | Variable, but can be severe. | Aerosol or droplet carryover. |
Table 2: Comparison of Washing Protocol Efficacy
| Protocol Steps | Average % Carryover (Fluorescein) | Resulting Z'-factor (Model Assay) | Total Processing Time |
|---|---|---|---|
| Water Only (3x) | 1.5% | 0.32 | 15 min |
| DMSO → Water (3x) | 0.8% | 0.45 | 25 min |
| DMSO → Water (3x) → Ethanol | 0.05% | 0.78 | 35 min |
| Single-Use Plate (Baseline) | 0.001% | 0.85 | N/A |
Visualizations
The Scientist's Toolkit: Key Research Reagent Solutions
| Item | Primary Function | Relevance to Contamination Control |
|---|---|---|
| Fluorescent Tracer Compounds (e.g., Fluorescein, Coumarin) | High-sensitivity detection of liquid carryover. | Used to validate washing protocols and liquid handler precision by quantifying % carryover. |
| Low-Adsorption Polypropylene Plates | Minimize non-specific binding of compounds and biomolecules. | Reduces the source of residual contaminants that can desorb in subsequent assays. |
| DMSO (Cell Culture Grade, Sterile-Filtered) | Universal solvent for compound libraries. | High-quality DMSO with low volatility helps prevent precipitate formation, a source of heterogeneous contamination. |
| Plate-Sealing Films (Non-Fluorescent) | Prevent evaporation and aerosol escape during incubation. | Critical for containing compounds within wells, especially in high-density shaking incubators. |
| Automated Microplate Washer with Solvent Lines | High-throughput, consistent washing. | Allows sequential solvent cycles (DMSO/Water/Ethanol) for efficient decontamination of reused plates. |
| Liquid Handler with Tip Washing Station | Precision liquid transfer. | Integrated washing stations for tips/patches between transfers prevent cross-well contamination. |
Troubleshooting Guides & FAQs
Edge Effects
Q1: Our cell viability or assay signal is consistently lower in the peripheral wells of our 96-well or 384-well plate. What is causing this and how can we fix it? A: This is a classic edge effect, primarily caused by differential evaporation. Edge wells lose more volume, leading to increased concentration of reagents, osmolality changes, and thermal transfer differences compared to the inner wells.
- Solution:
- Use a plate sealer or sealing tape: Apply a high-quality, optically clear seal after pipetting.
- Employ a humidity chamber: Place plates in a humidified incubator or tray during incubation steps.
- Utilize a "guard row" of buffer: Fill the outermost perimeter wells with sterile PBS or culture medium to create a uniform evaporation buffer zone.
- Pre-equilibrate plates: Allow plates to warm to incubation temperature in a humid environment before adding cells or reagents.
Q2: Are there specific plate types or designs that minimize edge effects? A: Yes. Manufacturers offer plates with enhanced evaporation control.
- Solution: Consider using:
- Advanced Seal Plates: Plates with specially designed rims for superior seal contact.
- Cyclo-olefin or Polycarbonate Plates: These materials have lower water vapor transmission rates than standard polystyrene.
- "Chimney Well" or "Half-Area" Plates: Designs that reduce the air space above the liquid, thereby reducing evaporation-driven convection.
Well-to-Well Proximity & Cross-Contamination
Q3: We observe crosstalk between adjacent wells in our fluorescence or luminescence assays. What are the likely culprits? A: Optical crosstalk (also called optical bleed-through) occurs when signal from a well is detected by the sensor reading an adjacent well. This is common in high-density plates (384, 1536) and with high-intensity signals.
- Solution:
- Optical Validation: Use a black-walled, clear-bottom plate. Black walls absorb stray light.
- Reader Configuration: Adjust the read height (e.g., use a bottom read) and reduce the aperture/diameter of the read head if your plate reader allows.
- Experimental Design: Leave empty wells or negative control wells between high-signal samples.
- Data Correction: Some plate reader software includes crosstalk correction algorithms; ensure they are enabled.
Q4: We suspect aerosol or liquid transfer between wells during pipetting or plate shaking. How can we prevent this? A: This is a direct physical cross-contamination risk.
- Solution:
- Pipetting Technique: Use low-retention, filter tips. Avoid creating aerosols by pipetting gently along the sidewall and not expelling the final drop aggressively.
- Lid Use: Always replace the lid during shaking steps.
- Shaker Speed: Reduce orbital shaking speed to prevent vortexing and droplet formation.
- Workflow Design: Do not move multi-channel pipettes directly over filled wells. Use a staggered layout where high-concentration samples are not directly adjacent to sensitive low-concentration samples.
Evaporation & Concentration Gradients
Q5: Despite sealing the plate, we see inconsistent results. Could evaporation still be happening unevenly? A: Yes, especially during long-term incubations (e.g., cell culture over days). Evaporation can create concentration gradients of non-volatile components.
- Solution:
- Volume Verification: Periodically check well volumes gravimetrically (weigh the plate).
- Osmolality Check: Measure osmolality in edge vs. center wells at the end of an experiment.
- Environmental Control: Ensure your incubator has well-humidified air and minimal fan-forced air directly on plates.
- Automated Liquid Handling: For assay setup, use automated systems for superior speed and consistency, reducing the time plates are open.
Q6: What is the best practice for storing assay plates before reading? A: Store them sealed, protected from light, and on a level, thermally stable surface. Avoid placing them near vents, doorways, or other sources of air currents or temperature fluctuations which can induce condensation/evaporation cycles.
Data Presentation: Evaporation Rate Comparison
Table 1: Evaporation-Induced Volume Loss in Different Plate Types Over 72 Hours (37°C, <50% RH)
| Plate Type (96-well) | Sealing Method | Avg. Volume Loss (Center Wells) | Avg. Volume Loss (Edge Wells) | % CV Across Full Plate |
|---|---|---|---|---|
| Standard Polystyrene | No Seal | 25% | 45% | 38% |
| Standard Polystyrene | Adhesive Foil Seal | 5% | 15% | 18% |
| Polycarbonate, Low-Evaporation | Adhesive Foil Seal | 2% | 7% | 8% |
| Polycarbonate, Low-Evaporation | Heat Seal Film | <1% | <2% | <3% |
Table 2: Optical Crosstalk Signal Interference in 384-Well Plates
| Assay Type | Plate Wall Color | Well-to-Well Distance | Signal Bleed (Adjacent Well) | Signal Bleed (2 Wells Away) |
|---|---|---|---|---|
| Bright Luminescence | White | 2.25 mm | 0.8 - 1.5% | <0.1% |
| Bright Luminescence | Black | 2.25 mm | 0.1 - 0.3% | <0.01% |
| Fluorescence (FITC) | White | 2.25 mm | 2.1% | 0.4% |
| Fluorescence (FITC) | Black | 2.25 mm | 0.4% | 0.05% |
Experimental Protocols
Protocol 1: Validating and Correcting for Edge Effects
Title: Gravimetric and Osmolality-Based Edge Effect Assessment Objective: To quantify evaporation-induced concentration changes across a microplate. Materials: 96-well plate, high-precision balance (±0.001g), plate sealer, sterile PBS, osmometer. Procedure:
- Fill all wells of the plate with 100 µL of sterile PBS using an automated liquid handler.
- Weigh the entire plate immediately (Time 0).
- Apply the test sealing method (none, adhesive seal, heat seal).
- Incubate the plate under standard assay conditions (e.g., 37°C, 5% CO2) for the desired duration (e.g., 24, 48, 72h).
- Re-weigh the plate at each time point. Calculate volume loss per well position.
- At the final time point, carefully sample 10 µL from 4 edge wells and 4 center wells. Measure osmolality for each sample.
- Analysis: Plot volume loss and osmolality as a function of well position (e.g., row and column). Calculate the coefficient of variation (CV) for the entire plate.
Protocol 2: Testing for Well-to-Well Cross-Contamination
Title: Dye-Based Aerosol Cross-Contamination Assay Objective: To visualize and quantify physical transfer between wells during pipetting or shaking. Materials: 384-well plate, concentrated dye solution (e.g., 1% Tartrazine), multi-channel pipette, plate shaker, microplate reader. Procedure:
- Fill alternating columns of the plate with 50 µL of clear buffer.
- In the columns between them, fill with 50 µL of the concentrated dye solution.
- Test Condition A (Pipetting): Using a multi-channel pipette, repeatedly aspirate and dispense 45 µL over the dye columns, then immediately move to perform the same action over the clear buffer columns. Simulate a rushed workflow.
- Test Condition B (Shaking): Seal the plate with a standard lid. Shake at high speed (e.g., 1000 rpm) for 10 minutes.
- Measure absorbance in all wells at the dye's peak wavelength (e.g., ~430 nm for Tartrazine).
- Analysis: Compare absorbance in the clear wells adjacent to dye wells vs. those farther away. A significant increase indicates cross-contamination.
Mandatory Visualizations
Diagram Title: Causes and Mitigation of Microplate Edge Effects
Diagram Title: Cross-Contamination Mechanisms and Prevention
The Scientist's Toolkit
Table 3: Essential Research Reagent Solutions for Contamination Control
| Item | Function & Rationale |
|---|---|
| Black-Walled, Clear-Bottom Microplates | Minimizes optical crosstalk (signal bleed) between adjacent wells in fluorescence/luminescence assays by absorbing stray light. |
| Low-Evaporation / Cyclo-olefin Plates | Engineered plastic with lower water vapor transmission rate to reduce evaporation gradients, crucial for long-term cell culture or incubation. |
| Optically Clear, Adhesive Plate Seals (Polyester Foil) | Provides a robust vapor barrier to prevent evaporation. Must be compatible with plate readers (optical clarity) and incubator temperatures. |
| Heat Seal Films & Applicator | Creates a hermetic, puncturable seal superior to adhesive foils for absolute evaporation prevention, especially for long-term storage or sensitive assays. |
| Automated Liquid Handling System | Ensures speed, precision, and reproducibility in reagent dispensing, reducing plate-open time and operator-induced variability/aerosols. |
| Low-Retention, Filtered Pipette Tips | Reduces liquid retention on tip walls (improving accuracy) and includes a filter to prevent aerosol/pipette contamination. |
| Sterile PBS or Medium for Guard Rings | Liquid used to fill perimeter wells to create a uniform thermal and evaporative environment for the experimental wells, normalizing edge effects. |
| Osmometer | Instrument to measure solution osmolality. Critical for quantifying the concentration gradient caused by evaporation across a plate. |
Technical Support Center
This support center is designed to assist researchers in troubleshooting experimental issues related to microplate coatings and hydrophobicity within the context of reducing cross-contamination in high-density microwell arrays. The guidance is framed to support a thesis focused on improving data integrity in multiplexed assays.
Frequently Asked Questions (FAQs) & Troubleshooting
Q1: We observe inconsistent cell adhesion and spreading across our 384-well plate. What could be the cause? A: Inconsistent adhesion is frequently caused by variability in the coating thickness or uniformity. High-density plates are susceptible to "edge effects" and evaporative gradients during the coating process. Ensure the plate is level during coating incubation and that the coating solution is dispensed using a calibrated liquid handler. Consider using plates with a known, validated coating process from the manufacturer.
Q2: Our assay shows high well-to-well variability in signal, suggesting possible aerosol cross-contamination. How can plate hydrophobicity contribute? A: Plate hydrophobicity directly influences droplet formation and splash risk. A highly hydrophobic surface (high water contact angle) causes aqueous droplets to bead up, increasing their surface tension and making them more likely to "jump" or form aerosols during pipetting, especially with high-speed dispensers. This aerosolized material can land in adjacent wells. Switching to a plate with a more hydrophilic (or specifically engineered low-splash) rim and well top can mitigate this.
Q3: How do we quantitatively test the hydrophobicity of a new plate lot before committing to a large-scale experiment? A: Perform a simple static water contact angle measurement on the plate's well surface or representative coupon.
- Protocol: Use a contact angle goniometer. Place a 1 µL droplet of purified water on the dry, clean well surface. Capture an image and use the instrument's software to measure the angle at the water-solid interface. Perform this in triplicate across the plate (center and edges).
- Data Interpretation: A contact angle >90° indicates hydrophobicity, which may increase splash risk. An angle <90° indicates hydrophilicity, which promotes wetting and can contain spills.
Q4: What is the best way to validate that our chosen plate coating effectively prevents non-specific binding (NSB) of our target analyte? A: Conduct a non-specific binding (NSB) validation assay.
- Protocol:
- Coat wells as per your standard protocol.
- Prepare a solution containing a high concentration of your target analyte (or a relevant protein) in your assay buffer.
- Add this solution to coated wells and also to uncoated control wells (if available) or wells coated with a non-specific protein like BSA.
- Incubate for your standard assay time.
- Wash stringently.
- Use a sensitive detection method (e.g., fluorescent antibody, ELISA) to measure any remaining bound material.
- Interpretation: Signal in the specifically coated wells should be significantly lower (e.g., >90% reduction) compared to the non-specific control wells, confirming the coating's effectiveness.
Q5: We are transitioning from a 96-well to a 1536-well format. What new risks should we consider regarding coatings and hydrophobicity? A: The risks are amplified due to decreased well spacing and volumes.
- Capillary Action: Liquid can wick up the side of the well and across the inter-well spacer if the plate's surface chemistry is not carefully controlled, leading to direct cross-talk.
- Evaporation: Higher surface-area-to-volume ratio increases evaporation, which can alter coating integrity and reagent concentration, causing edge effects.
- Solution: Seek plates with hydrophilic well bottoms for uniform liquid distribution and hydrophobic well walls/barriers to confine liquids. Use plates with an active evaporation control system (e.g., a lid with a sealed humidifying chamber).
Data Presentation: Key Parameters for Plate Selection
Table 1: Comparison of Common Microplate Surface Treatments
| Surface Coating/Treatment | Primary Function | Typical Contact Angle | Key Risk for Cross-Contamination | Best for Assay Type |
|---|---|---|---|---|
| Untreated (Native) Polystyrene | Passive, low-cost substrate | ~80-95° (Mod. Hydrophobic) | High splash risk, high NSB | Non-critical storage, simple sample prep |
| Gas Plasma Treatment | Creates temporary hydrophilic surface | <40° (Hydrophilic) | Effectiveness decays over time/shelf life | Cell culture, coating immediately after treatment |
| Covalent Hydrophilic Polymer Graft | Permanent, stable hydrophilic layer | <30° (Highly Hydrophilic) | Low; promotes wetting and confines liquid | High-speed dispensing, low-volume assays |
| Poly-D-Lysine (PDL) | Promotes cell attachment via charge | Variable; surface becomes hydrophilic | Coating variability can cause uneven cell layers | Adherent cell-based assays |
| PEG (Polyethylene Glycol) Silane | Creates anti-fouling, low-binding surface | ~40-60° | Low NSB risk, but can be sensitive to oxidation | Biomolecule binding assays (e.g., kinetic studies) |
| Hydrophobic Well Rims/Walls | Physically contains liquids | >100° (Highly Hydrophobic) | High risk if droplet forms on rim; can aerosolize | Used in conjunction with hydrophilic well bottoms |
Table 2: Troubleshooting Matrix for Cross-Contamination Symptoms
| Observed Problem | Possible Cause Related to Plate/Coating | Recommended Diagnostic Experiment | Potential Solution |
|---|---|---|---|
| High CVs in edge wells | Evaporation altering coating or reagent concentration | Run an evaporation-sensitive dye assay across the plate. | Use a plate sealer, humidity chambers, or plates designed for evaporation control. |
| Positive signal in negative control wells | Aerosol transfer during pipetting | Run assay with alternating positive/negative wells in a checkerboard pattern. | Switch to a low-splash plate with hydrophilic rims, reduce pipetting speed, use conductive tips. |
| Non-linear standard curve | Non-specific binding depleting low-concentration analytes | Perform the NSB validation assay (see Q4). | Implement a more effective blocking step or switch to a low-binding plate coating (e.g., PEG). |
| Cell clustering in center of well | Inconsistent or hydrophobic coating causing poor wetting | Measure contact angle across the plate (see Q3). | Vortex coating solution, ensure plate is level during coating, use plates with factory-applied coatings. |
Experimental Protocols
Protocol 1: Assessing Well Hydrophobicity via Contact Angle Objective: Quantify the wettability of a microwell surface. Materials: Microplate of interest, contact angle goniometer, ultrapure water (Type I), precision syringe. Method:
- Ensure the plate is clean, dry, and free of dust.
- Program the goniometer for a static sessile drop measurement.
- Using the syringe, carefully dispense a 1.0 µL droplet of water onto the bottom surface of a well.
- Immediately capture a high-resolution side-view image of the droplet.
- Use the instrument's software to fit the droplet shape (typically using the Young-Laplace method) and calculate the left and right contact angles. Record the average.
- Repeat steps 3-5 for at least n=5 wells per plate region (e.g., corners, edges, center).
- Calculate the mean and standard deviation for the plate lot.
Protocol 2: Splash/Risk Simulation Test using Dyed Solution Objective: Visually assess the potential for aerosol or droplet cross-contamination during pipetting. Materials: Test microplate, reference plate (known low-splash), multichannel pipette, aqueous solution with a visible dye (e.g., 0.1% Coomassie Blue), clear plate seal. Method:
- Fill alternating columns of the test plate with 50 µL of dyed solution and 50 µL of clear buffer (simulating samples and blanks).
- Using a multichannel pipette set to a high but typical speed (e.g., "fast" dispensing), repeatedly aspirate and dispense the entire volume (e.g., 10 cycles) in the dyed wells.
- Seal the plate and visually inspect (or use a plate reader for absorbance) the clear buffer wells for any trace of dye.
- Compare the intensity of contamination to that observed in a reference plate tested under identical conditions. A plate with better splash resistance will show less dye transfer.
Visualizations
Title: Cross-Contamination Risk Diagnostic Workflow
Title: How Plate Properties Create Cross-Contamination Risk
The Scientist's Toolkit: Essential Research Reagent Solutions
| Item | Function/Description | Key Consideration for Risk Mitigation |
|---|---|---|
| Low-Binding, Hydrophilic-Coated Plates | Plates with a permanent grafted hydrophilic polymer coating. | Minimizes droplet beading and splash; ideal for high-throughput screening with nanoliter dispensers. |
| Conductive Pipette Tips | Tips that dissipate static charge. | Prevents static-driven attraction of aerosols between tip and plate, reducing droplet deflection. |
| Plate Sealers (PCR-style, pierceable) | Adhesive seals that create a vapor barrier. | Drastically reduces evaporation-induced edge effects and physically contains aerosols. |
| Non-ionic Surfactant (e.g., Pluronic F-68) | Added to assay buffers (0.01-0.1%). | Reduces surface tension, promoting uniform wetting of wells and minimizing droplet formation. |
| Dynamic Contact Angle Test Fluids | Standardized liquids with known surface tension. | Used in addition to water for a more complete surface energy characterization of the plate. |
| Fluorescent Tracer Dye (e.g., Fluorescein) | Highly sensitive, detectable marker. | Used in splash simulation tests at low concentration to visualize minute cross-contamination. |
| Validated, Ready-to-Use Coating Kits | Pre-optimized, QC-tested coating solutions (e.g., collagen, fibronectin). | Ensures batch-to-batch consistency in coating performance, reducing experimental variability. |
Building a Robust Defense: Methodologies and Best Practices for Contamination Prevention
Troubleshooting Guides & FAQs
FAQ 1: How do I optimize aspirate and dispense speeds to minimize cross-contamination in 1536-well plates?
Answer: For dense arrays, slower aspirate speeds and faster dispense speeds are generally recommended to reduce aerosol formation and droplet retention. Use the following table as a starting guideline. Always validate with a dye test.
Optimized Pipetting Parameters for High-Density Arrays
| Well Density | Recommended Aspirate Speed (µL/s) | Recommended Dispense Speed (µL/s) | Blow-Out Volume (µL) | Post-Dispense Delay (ms) |
|---|---|---|---|---|
| 384-well | 5 - 10 | 10 - 20 | 2 - 5 | 20 - 50 |
| 1536-well | 2 - 5 | 15 - 30 | 3 - 7 | 50 - 100 |
| 3456-well | 1 - 3 | 20 - 40 | 5 - 10 | 100 - 200 |
Experimental Protocol for Speed Optimization Validation:
- Reagent Prep: Prepare a source solution with a visible dye (e.g., Tartrazine) at a high concentration.
- Aspiration: Program the liquid handler to aspirate a target volume (e.g., 2 µL for 1536-well) from the dyed source using the test aspirate speed.
- Dispensing: Dispense the volume into a column of destination wells filled with clear buffer.
- Cross-Contamination Check: Skip 1-5 wells after the dyed dispense, then continue dispensing the same tip into subsequent wells filled with clear buffer.
- Analysis: Measure the absorbance in the "skip" wells to quantify carryover. The speed combination yielding the lowest carryover is optimal.
FAQ 2: What is the optimal "Tip Touch" procedure to reduce droplet retention and well-to-well contamination?
Answer: A consistent, shallow tip touch to the inner wall of the well after dispensing is critical. The goal is to wick away the hanging droplet without touching the liquid meniscus in the well.
Troubleshooting Tip Touch Issues:
| Problem | Likely Cause | Solution |
|---|---|---|
| Droplet remains on tip | Tip not touching wall, or speed is too fast. | Program a deliberate lateral move post-dispense to contact the wall at 1-2 mm from the tip end. |
| Liquid is wicked from the well | Tip touching the liquid meniscus. | Adjust the tip touch depth to be more shallow (e.g., 0.5 mm into the well). Use capacitive liquid level detection if available. |
| Inconsistent touch leading to splashing | Poor plate alignment or gripper issues. | Calibrate plate grippers and ensure tip height calibration is precise for the specific plate type. |
Protocol for Tip Touch Optimization:
- Using water containing a surfactant (0.01% Tween-20), dispense 1 µL into a dry 1536-well plate.
- Vary the tip touch depth parameter (e.g., 0.2 mm, 0.5 mm, 1.0 mm).
- Visually inspect under a magnifier or use a plate reader to measure residual volume in the tip via a second aspiration into a dry well. The shallowest depth that removes the hanging drop is optimal.
FAQ 3: My positive controls are showing contamination in adjacent negative wells. What systematic checks should I perform?
Answer: Follow this logical troubleshooting pathway to isolate the contamination source.
Title: Systematic Cross-Contamination Troubleshooting Path
Dye Test Protocol (Definitive Check):
- Fill an entire source plate with a colored solution (e.g., 0.1% Tartrazine).
- Program the liquid handler to transfer from this source to the first column of a clean destination plate.
- Continue using the same set of tips to transfer water from a separate source to all subsequent columns.
- Visually inspect or read the absorbance of the destination plate. Any color gradient beyond column 1 indicates liquid handler-derived carryover.
The Scientist's Toolkit: Research Reagent Solutions
| Item | Function in Dense Array Pipetting Optimization |
|---|---|
| Tartrazine Dye (1% Solution) | Visible tracer for qualitative and quantitative (A415nm) assessment of liquid carryover and droplet retention. |
| Fluorescein Dye (100 µM Solution) | High-sensitivity tracer (detection via fluorescence plate reader) for quantifying minute levels of aerosol or droplet contamination. |
| Surfactant (e.g., 0.01% Tween-20) | Added to aqueous solutions to reduce surface tension, mimicking biological buffers and improving wetting for more realistic speed testing. |
| Precision Volume Verification Kit (e.g., Artel PCS) | Uses dual-dye photometry to absolutely quantify the accuracy and precision of nanoliter-volume dispenses in destination plates. |
| Dimethyl Sulfoxide (DMSO) | High-viscosity, hygroscopic solvent commonly used in compound libraries. Must be used for speed optimization tests if it is part of the experimental workflow, as it behaves differently from water. |
| Conductive Tips (when available) | Used with capacitive liquid level detection systems to precisely find the meniscus and enable ultra-shallow tip touch without plunging into the well contents. |
Troubleshooting Guides & FAQs
Q1: We are observing intermittent high CVs in our 384-well qPCR assay. Could this be due to tip quality or contamination from fixed tips? A1: Yes. Intermittent high coefficients of variation (CVs) often point to liquid handling inconsistency or cross-contamination. For high-density assays like qPCR in 384-well plates, disposable filter tips are strongly recommended to prevent aerosol carryover. Fixed tips, even with rigorous washing, can retain residues in internal mechanisms. First, switch to high-quality, low-retention disposable tips with a certified CV for volume accuracy <2%. If you must use fixed tips, implement the following wash protocol between reagent transfers: 1) Aspirate 10% bleach solution, 2) Perform three cycles of deionized water rinses, 3) Air dry completely. Re-run your assay and compare plate uniformity.
Q2: After switching to disposable tips to reduce cost, our ELISA background signal increased significantly. What went wrong? A2: This is a common issue when moving to lower-quality disposable tips. The plastic polymer may contain surfactants or contaminants that leach into sensitive assay reagents like conjugated antibodies or substrates. The table below compares tip properties:
| Tip Property | High-Quality Disposable | Low-Cost Disposable | Fixed Tip (PEEK) |
|---|---|---|---|
| Polymer Consistency | Medical-grade, low-binding polypropylene | Industrial-grade polypropylene | Chemically inert PEEK or stainless steel |
| Certified RNase/DNase Free | Yes | Not always | After proper decontamination |
| Risk of Leachates | Very Low | High | Very Low |
| Best For | Sensitive molecular assays (PCR, NGS) | Non-critical reagent transfers | Repetitive transfers of non-sensitive, viscous reagents |
Solution: Revert to a premium brand of disposable tips certified for ELISA and low protein binding. Always include a "tip-only" negative control in your plate layout to diagnose this issue.
Q3: What is the most reliable wash protocol for fixed tips when handling different reagent types in a single workflow (e.g., cells, cDNA, enzymes)? A3: A cascading wash protocol is essential. The key is order of operations: always wash from the least to the most contaminating reagent. See the workflow below.
Workflow for Fixed Tip Decontamination
Protocol Details:
- 10% Bleach Wash: Aspirate and dispense 3 full tip volumes of fresh 10% sodium hypochlorite (bleach). Contact time >30 seconds.
- Nuclease-Free Water Rinse: Aspirate and dispense 5 full tip volumes of nuclease-free water to remove all bleach residue.
- Reagent Priming (Conditional): If the next reagent is not incompatible (e.g., not an organic solvent), aspirate and dispense 3 volumes of that reagent to equilibrate the tip.
- Drying: Allow tips to air dry in a clean environment for 30-60 seconds or use a lint-free wipe on the external surface to prevent droplet carryover.
Q4: How do we validate that our wash protocol for fixed tips is effectively preventing cross-contamination in a high-density cell-based screen? A4: Perform a mock transfer validation experiment.
Validation Protocol:
- Prepare Source Plates:
- Plate A (Donor): Seed 5 μM fluorescent dye (e.g., Calcein AM) in alternating columns of a 384-well plate. Use buffer in alternating columns.
- Plate B (Receiver): Fill all wells with clear buffer.
- Liquid Handling:
- Using your fixed tips and standard wash protocol, transfer 10 μL from every well of Plate A to the corresponding well of Plate B.
- Detection & Analysis:
- Measure fluorescence in Plate B. Use a plate reader with appropriate excitation/emission filters.
- Quantitative Analysis: Calculate the signal in the receiver wells that originated from donor buffer wells. The signal should be at background level. A threshold of >3 standard deviations above the mean background indicates wash failure.
- Iterate: If contamination is detected, strengthen the wash protocol (increase cycles, change detergent) and re-test.
The Scientist's Toolkit: Key Research Reagent Solutions
| Item | Function in Cross-Contamination Control |
|---|---|
| Premium Low-Retention Filter Tips | Creates a physical barrier against aerosols and prevents reagent aspiration into pipette shaft. Low-retention surface ensures complete sample delivery. |
| PCR-Clean Disposable Reservoirs | Single-use liquid containers prevent batch contamination of bulk reagents during plate filling operations. |
| Molecular Biology Grade Bleach (10% v/v) | Effective decontaminant for degrading nucleic acids (DNA/RNA) and nucleases on fixed tip surfaces. |
| Nuclease-Free Water | Critical rinse agent to remove all traces of bleach or detergents without introducing new contaminants. |
| PEEK Fixed Tips | Chemically inert material for fixed tips; more resistant to aggressive solvents and easier to clean than stainless steel. |
| Lint-Free Wipes | For external decontamination of pipette shafts and fixed tips to remove splashes or droplets. |
| Digital Pipette Calibration System | Regularly verifies volume accuracy and precision; fundamental to ensuring wash volumes are consistent and effective. |
| Fluorescent Tracer Dye (e.g., Calcein AM) | Used in validation experiments to visually and quantitatively track minute levels of liquid carryover. |
Technical Support Center: Troubleshooting & FAQs
Q1: Our high-throughput cytotoxicity assay shows erratic positive control signals in the outer wells of our 384-well plate. What could be the cause and how do we fix it? A: This is a classic symptom of edge effect or evaporation bias, prevalent in high-density plates. Uneven evaporation alters reagent concentrations, particularly in outer wells, leading to inconsistent cell viability or assay reactions.
- Solution: Implement a guard buffer or moat layout. Fill the outermost perimeter wells with sterile PBS or assay buffer only. This creates a physical buffer against evaporation gradients for the experimental wells. Ensure plate lids are properly sealed and use a humidified incubator if possible.
- Protocol: When plating cells or adding reagents, program your liquid handler to skip columns 1 & 24 and rows A & P in a 384-well plate. Fill these wells with 50-60 µL of buffer.
Q2: We suspect cross-contamination via aerosol during reagent addition is causing false positives in our adjacent wells. How can we modify our plate layout to diagnose and prevent this? A: Use a checkerboard (alternating) layout to diagnose and mitigate aerosol-driven cross-talk.
- Diagnostic Protocol:
- Design a plate map where you alternate a high-concentration test compound (e.g., 100 µM) with buffer-only wells.
- Perform your standard assay workflow.
- Analyze results: If buffer-only wells adjacent to high-concentration wells show anomalous activity, aerosol cross-contamination is likely.
- Preventive Protocol: After confirming the issue, modify your reagent addition order.
- Always add reagents to low-to-high concentration of the critical agent.
- Use non-contact dispensing methods (acoustic dispensing, piezoelectric) where possible.
- If using tips, implement tip change between every well for the critical reagent step, despite the throughput cost.
Q3: How should we strategically position controls in a 96- or 384-well plate to ensure data reliability for statistical analysis? A: Controls must be randomly distributed across the plate to avoid confounding spatial bias with treatment effects. Do not cluster all controls in a single column.
- Protocol for Randomized Control Distribution:
- Determine the number of replicate controls needed (e.g., n=8 for Z'-factor calculation).
- Use a plate map generator software or a random number table to assign control wells across the entire plate surface, avoiding the outer edge buffer.
- Apply the same randomization principle to different treatment conditions.
- Data Presentation: This design allows you to quantify plate-wide uniformity.
Table 1: Impact of Plate Layout on Key Assay Metrics
| Layout Strategy | Primary Purpose | Key Diagnostic Output | Optimal Use Case |
|---|---|---|---|
| Checkerboard (Alternating) | Detect aerosol/liquid handling cross-contamination. | Signal in buffer wells adjacent to high-signal wells. | Troubleshooting sporadic false positives; validating liquid handler precision. |
| Randomized Controls | Account for spatial bias (temperature, evaporation gradients). | Consistent Z' factor and control values across all plate sectors. | All quantitative assays, especially those requiring robust statistical comparison (IC50, EC50). |
| Perimeter Buffer (Moat) | Mitigate edge evaporation effects. | Reduced CV% between inner and outer well controls. | Long-term incubation assays (≥4 hours), cell-based assays sensitive to osmolarity. |
Q4: What is the optimal order of reagent addition for a multiplexed assay measuring cytotoxicity (LDH release) and oxidative stress (ROS) from the same well? A: The order is critical to prevent assay interference. The general rule is to add reagents in order of increasing destructiveness or fixation.
- Detailed Protocol:
- Treat cells with compound.
- Add ROS detection dye (e.g., CellROX) to live cells and incubate according to kit specifications.
- Without removing media, add LDH assay lysis buffer + detection mixture. This simultaneously lyses cells for LDH measurement and fixes the ROS signal.
- Read fluorescence (ROS) immediately after lysis.
- Read absorbance (LDH) after the recommended incubation period (20-30 mins).
- Rationale: ROS dyes often require live-cell metabolism. Adding lysis buffer first would abolish the ROS signal, while measuring ROS first captures the live-cell state before endpoint lysis.
The Scientist's Toolkit: Key Research Reagent Solutions
Table 2: Essential Materials for Contamination-Aware Assay Design
| Item | Function & Relevance to Safety/Contamination |
|---|---|
| Low-Adhesion, Non-Binding Microplates | Minimizes compound adsorption to well walls, reducing carryover and concentration inaccuracies, crucial for checkerboard testing. |
| Sealing Films (Pierceable & Gas-Permeable) | Prevents aerosol escape during shaking and reduces evaporation, directly addressing edge effects and cross-well contamination. |
| DMSO-Only "Vehicle Control" Plates | Used for liquid handler priming and calibration to pre-saturate system surfaces with DMSO, preventing variable solvent absorption that can alter test compound concentrations. |
| Precision Calibration Standards (Fluorescence, Absorbance) | For daily validation of plate reader optics across the entire plate area, identifying reading anomalies that could be mistaken for contamination effects. |
| Liquid Handler with Tip-Change Capability | Essential for implementing low-to-high addition order without cross-contamination, even when using expensive reagents. |
| Interference Check (IC) Assay Buffer | A proprietary solution (from some vendors) added to control wells to mimic the light-scattering or absorbing properties of test compounds, isolating true biological signal from optical interference. |
Experimental Workflow & Logical Diagrams
Diagram 1: Troubleshooting Cross-Contamination Workflow
Diagram 2: Multiplex Assay Reagent Addition Order
Technical Support Center
Troubleshooting Guides & FAQs
Q1: Despite using an anti-contamination lid (ACL), I observe inconsistent cell viability readings in the peripheral wells of my 1536-well plate. What could be the cause? A: This is a common issue related to the "edge effect." While ACLs minimize airborne contamination and evaporation, they can create minor variations in the local microenvironment if not seated perfectly flat. This is exacerbated in high-density arrays.
- Troubleshooting Steps:
- Check Lid Alignment: Use a plate viewer to ensure the lid is perfectly seated without tilting.
- Validate Sealing: Perform an evaporation test by filling perimeter wells with a solution containing a fluorescent dye (e.g., fluorescein) and measuring volume loss after 24h incubation.
- Protocol Adjustment: Increase the humidity in the incubator to >90% to reduce the evaporation gradient. Consider using a plate carrier designed for your specific ACL model.
- Data Normalization: Implement spatial normalization in your data analysis pipeline using control wells distributed across the entire plate.
Q2: My hydrophobic coating on the well walls is repelling aqueous solutions, causing inconsistent droplet dispensation. How can I improve wetting without compromising the anti-cross-contamination function? A: This indicates either an overly thick coating or contamination of the coating with oils.
- Troubleshooting Steps:
- Verify Coating Protocol: Ensure you followed the manufacturer's recommended spin-coating speed (if applicable) and curing time/temperature. An uneven or thick coating increases hydrophobicity.
- Surface Activation: Perform a brief (30-60 second) oxygen plasma treatment. This temporarily increases surface energy for improved wetting during dispensing, while the hydrophobic property recovers over hours, maintaining its barrier function. Method: Use a low-pressure plasma cleaner at 50-100 W.
- Dispenser Calibration: Check your non-contact dispenser's alignment and droplet kinematics. A higher dispensing height or velocity may be needed to overcome surface tension initially.
Q3: After transferring liquid using a nanowell insert, I suspect carryover contamination between wells. How can I diagnose and prevent this? A: Carryover in nanowell systems often stems from insert geometry or robotic handling.
- Troubleshooting Steps:
- Visual Inspection: Use a high-magnification microscope to check for manufacturing defects (burrs, uneven pillars) on the insert.
- Dye Test Protocol:
- Prepare two solutions: Solution A (Donor) with a high-concentration fluorescent dye, Solution B (Receiver) with buffer only.
- Perform the transfer protocol from A to B using the nanowell insert.
- Measure fluorescence in the Receiver solution and the insert's wash bath (if used).
- A signal >0.1% of the donor in the receiver indicates significant carryover.
- Prevention: Implement a more rigorous post-transfer wash cycle for the insert. Optimize the "touch-off" blotting step on a sterile, dry blotting pad to remove residual droplets from the insert feet.
Q4: When combining a hydrophobic well coating with a nanowell insert, I get air bubbles trapped under the insert, disrupting diffusion. How do I resolve this? A: The high hydrophobicity can prevent aqueous media from displacing air during insert placement.
- Troubleshooting Steps:
- Pre-wet the Insert: Before placing the nanowell insert into the destination well, briefly dip its feet into the receiving media or a buffer solution.
- Modified Placement Protocol: Use a slow, angled placement technique rather than dropping the insert vertically. Automated systems should reduce the Z-axis speed during this step.
- Vacuum Degassing: Degas both the media and any buffers prior to the experiment to minimize bubble formation.
Table 1: Performance Comparison of Cross-Contamination Mitigation Technologies
| Technology | Typical Evaporation Reduction (vs. Open Plate) | Max Well Density Supported | Estimated Carryover Risk | Optimal Use Case |
|---|---|---|---|---|
| Standard Gas-Permeable Lid | 40-60% | 384-well | Low-Medium (Aerosols) | Routine cell culture, short-term assays |
| Anti-Contamination Lid (ACL) | 85-95% | 3456-well | Very Low (Aerosols) | Long-term incubations, HTS campaigns |
| Hydrophobic Well Coating | N/A (Localized) | 1536-well | Low-Medium (Liquid Crawl) | Addition-only assays, wash-free steps |
| Nanowell Insert | N/A (Physical) | 96-well (Insert) | Medium-High (Mechanical) | Co-culture, timed stimulation/lysis |
| Combined ACL + Hydrophobic Coating | >90% | 1536-well | Low | Sensitive biochemical assays in high-density formats |
Table 2: Troubleshooting Dye Test Results for Carryover Assessment
| Tested Component | Donor Dye Concentration | Measured Receiver Signal (Mean Fluorescence) | % Carryover Calculated | Pass/Fail (Threshold <0.1%) |
|---|---|---|---|---|
| Standard 200µl Pipette Tip | 100 µM Fluorescein | 850 RFU | 0.85% | Fail |
| Low-Retention Pipette Tip | 100 µM Fluorescein | 95 RFU | 0.095% | Pass |
| Nanowell Insert (Protocol A) | 100 µM Fluorescein | 210 RFU | 0.21% | Fail |
| Nanowell Insert (Protocol B*) | 100 µM Fluorescein | 78 RFU | 0.078% | Pass |
*Protocol B includes an optimized two-step wash and blotting step.
Experimental Protocols
Protocol: Testing Hydrophobic Coating Efficacy via Contact Angle Measurement
- Objective: Quantify the hydrophobicity of a coated microwell surface.
- Materials: Treated microwell plate, sessile drop analyzer or goniometer microscope, deionized water, 1µL precision syringe.
- Method:
- Place the test plate on the goniometer stage.
- Using the syringe, carefully dispense a 1µL droplet of deionized water onto the coated well wall or a representative coated slide.
- Capture a high-resolution side image of the droplet immediately after deposition.
- Use the instrument's software to draw a tangent line at the point where the water meets the solid surface and calculate the contact angle (θ).
- Repeat for n=5 droplets per plate batch.
- Expected Result: A well-applied hydrophobic coating should yield a contact angle θ > 110°. Angles < 90° indicate coating failure or contamination.
Protocol: Validating Anti-Contamination Lid Seal with Evaporation Assay
- Objective: Measure volumetric loss to assess lid sealing performance across the plate.
- Materials: ACL, 384-well plate, fluorescent dye (e.g., 10µM Calcein), non-contact dispenser, plate-reading fluorometer.
- Method:
- Fill all wells of the plate with 50µL of Calcein solution using a non-contact dispenser.
- Apply the ACL according to manufacturer instructions.
- Incubate the sealed plate in a standard cell culture incubator (37°C, 5% CO2) for 48 hours.
- Remove the lid and measure the fluorescence (Ex/Em ~494/517nm) for all wells.
- Compare fluorescence intensity to a freshly prepared, non-incubated control plate. Fluorescence is proportional to dye concentration, which increases with evaporation.
- Plot the % evaporation ((1 - (Fcontrol/Ftest)) * 100) as a heatmap to identify spatial patterns.
- Expected Result: A well-sealed ACL will show <5% evaporation across all wells with no strong edge effect gradient.
Visualizations
Diagram Title: Decision Workflow for Selecting Contamination Barriers
Diagram Title: Contaminant Pathways and Barrier Interception
The Scientist's Toolkit: Research Reagent Solutions
Table 3: Essential Materials for Cross-Contamination Barrier Implementation
| Item | Function & Application | Key Consideration |
|---|---|---|
| Gas-Permeable, Anti-Contamination Lid (ACL) | Creates a semi-sealed vapor barrier over the entire microplate to minimize evaporation and aerosol transfer during incubation. | Ensure compatibility with your imager/reader (optical clarity, working distance). |
| Hydrophobic Slide/Well Coating Kit | Forms a permanent, molecular layer on polystyrene or glass to increase contact angle, preventing liquid from crawling over well walls. | Test with your specific assay buffers; some surfactants can degrade the coating. |
| Polymer Nanowell Insert | A physical, removable barrier placed inside a well to create separate compartments for different cell types or reagents. | Choose pore size (if any) based on the need for molecular diffusion vs. complete separation. |
| Low-Retention, Filtered Pipette Tips | Minimizes protein/nucleic acid adherence to tip surfaces during liquid handling, reducing carryover at the source. | Essential for all dispensing steps, especially in serial dilution protocols. |
| Oxygen Plasma Cleaner | Temporarily activates hydrophobic surfaces for improved wetting prior to nanowell insert placement or cell seeding. | Optimize power and exposure time to avoid damaging the substrate. |
| Non-Contact Liquid Dispenser | Eliminates tip-based cross-contamination by using solenoid valves or acoustic energy to transfer droplets. | Calibrate regularly for droplet volume accuracy across the entire plate map. |
| Fluorescent Tracer Dye (e.g., Fluorescein) | Used in validation protocols to quantitatively measure evaporation, carryover, and mixing between compartments. | Choose a dye stable at assay temperature and pH, and compatible with your detector. |
Technical Support Center
Troubleshooting Guides & FAQs
Q1: We are observing inconsistent cell viability in our 1536-well assay after using ADE to transfer compounds. Could cross-contamination be the cause? A: Inconsistent viability is a classic symptom of cross-contamination. First, perform a negative control transfer. Eject droplets from a source well containing a viability marker (e.g., Trypan Blue) into target wells, followed by ejection from a buffer-only source into adjacent wells. Measure carryover in the buffer wells. If >0.01%, calibrate your instrument. Protocol: 1) Load source plate with dye and buffer. 2) Program ADE to transfer from dye well (A1) to 10 target wells. 3) Without cleaning, transfer from buffer well (A2) to 10 adjacent wells. 4) Measure absorbance in buffer target wells. Expected carryover should be <0.01%.
Q2: Our qPCR data from ADE-dispensed samples shows high CVs and outlier signals in high-density plates. What is the primary troubleshooting step? A: This indicates potential aerosol or liquid borne contamination. Immediately execute a fluorescence-based contamination check protocol. 1) Prepare a source plate with a high-concentration fluorescent dye (e.g., Fluorescein at 100 µM) in alternating wells. 2) Fill all surrounding wells with molecular grade water. 3) Use ADE to eject 5 nL droplets from the dye wells into a corresponding dry assay plate. 4) Image the source plate post-ejection for satellite droplets or mist on well rims. 5) Then, add a universal qPCR master mix to the water wells in the source plate and run a qPCR cycle. Any amplification in water wells confirms contaminant spread. The primary step is to increase the dispense height-to-fluid ratio and ensure the instrument is on a vibration-isolation table.
Q3: After switching to a new biologically inert fluid (Fluorinert FC-40) in our acoustic dispenser, we get frequent misfires. Why? A: Misfires are often due to incorrect acoustic impedance matching. Fluorinert has different density and speed of sound than aqueous solutions. Recalibrate the instrument's acoustic parameters. Focus on the waveform focus setting. Protocol: 1) Perform a "Listen" calibration with the new fluid to determine the optimal acoustic energy. 2) Run a drop visualization routine using the integrated camera to check for consistent droplet formation. 3) Create a new fluid profile in the software, explicitly defining the density (1.86 g/mL) and sound velocity (~580 m/s).
Q4: Can acoustic dispensing induce shear stress and damage sensitive primary cells? How can we test this? A: While ADE is generally low-stress, the acceleration phase can affect sensitive cells. To test, design a comparative viability experiment. Protocol: Prepare a suspension of primary cells (e.g., PBMCs).
- Group 1 (Control): Use a manual pipette to transfer 20 µL.
- Group 2 (ADE): Use ADE to transfer 20 nL droplets (1000 droplets to sum 20 µL).
- Group 3 (ADE Bulk): Use ADE in "single bulk transfer" mode to transfer 20 µL as one droplet. Incubate for 1 hour and measure viability via flow cytometry (Annexin V/PI). Key parameters: percentage of early apoptotic cells.
Table 1: Comparative Cell Viability Post-Transfer (Hypothetical Data)
| Transfer Method | Average Viability (%) | % Early Apoptotic Cells | CV (%) |
|---|---|---|---|
| Manual Pipette | 95.2 | 3.1 | 2.5 |
| ADE (Droplet) | 94.8 | 3.5 | 3.1 |
| ADE (Bulk) | 93.5 | 4.8 | 4.7 |
Q5: What is the single most effective protocol to validate a non-contact dispenser for a cross-contamination-critical assay like CRISPR library screening? A: Implement a "Checkerboard" DNAse/RNAse Challenge Assay. Detailed Protocol:
- Source Plate Prep: Fill alternating wells of a 384-well source plate with two solutions: Solution A: 1 µg/µL of genomic DNA in buffer. Solution B: A sensitive RNAse/DNAse solution.
- Target Plate: Use a 1536-well assay plate prefilled with a qPCR master mix designed to amplify a specific sequence from the genomic DNA.
- Transfer: Program the ADE to transfer from every source well (both DNA and RNAse/DNAse wells) into four corresponding replicate wells in the 1536-plate.
- Incubation & Read: Run the qPCR. Any decrease in amplification efficiency in DNA wells adjacent to RNAse/DNAse transfers indicates functional cross-contamination. Acceptable thresholds: No Ct shift > 0.5 cycles compared to isolated control transfers.
The Scientist's Toolkit: Key Research Reagent Solutions
Table 2: Essential Materials for ADE Cross-Contamination Studies
| Item | Function in Experiment |
|---|---|
| Fluorescein Sodium Salt | High-sensitivity tracer dye for visualizing droplet trajectory and detecting minute aerosol contamination. |
| Fluorinert FC-40 | Biologically inert, non-volatile fluid for acoustic coupling; eliminates risk of well-to-well chemical leaching. |
| PCR-Compatible Surfactant (e.g., Pluronic F-68) | Reduces surface tension in low-volume wells, minimizes adhesion losses, and prevents bubble formation during acoustic ejection. |
| Hydrophobic Coated Source Plates (e.g., cyclo-olefin polymer) | Prevents droplet "creep" on the plate surface, ensuring precise acoustic energy focus and reducing satellite droplets. |
| Quenching Buffer (with 0.1% Triton X-100) | Used in contamination check protocols to lyse any aerosol-transferred cells and release contents for detection. |
| Viability Probe (e.g., Annexin V, CFDA-AM) | For assessing potential cellular stress induced by the acoustic waveform or droplet impact forces. |
Experimental Workflow & Pathway Diagrams
Title: ADE Workflow and Contamination Check Loop
Title: Cross-Contamination Troubleshooting Decision Tree
Diagnosing and Solving Contamination Issues: A Step-by-Step Troubleshooting Workflow
Technical Support Center
Troubleshooting Guides & FAQs
Q1: We observed a radial pattern of high fluorescence intensity in our assay plate. What type of cross-contamination does this indicate and how do we resolve it?
A: A radial gradient pattern, strongest at the edges or center, typically signals aerosol or droplet contamination during plate sealing or liquid handling. This occurs when a fine mist or droplets from a high-concentration well are dispersed during robot pipetting or sealer application.
Mitigation Protocol:
- Immediate Action: Visually inspect and clean the plate sealer roller and pipette head exteriors with 70% ethanol. For manual pipetting, change tips after handling high-concentration samples.
- Validation Experiment: Run a dye distribution test.
- Fill alternating wells with a high-concentration fluorescent dye (e.g., 100 µM fluorescein). Fill intervening wells with buffer.
- Process the plate through your standard sealing and handling protocol.
- Image the plate. A radial pattern confirms aerosol/droplet spread.
- Permanent Fix: Implement a plate sealing pause. After lid placement, pause the robotic handler for 30 seconds before applying roller pressure to allow aerosols to settle.
Q2: Our negative controls show sporadic positive signals in a non-geometric, seemingly random pattern across the plate. What is the source?
A: Random, non-geometric contamination is a classic signature of carryover contamination via contaminated pipette tips or probe heads. A small volume of reagent is physically transferred from a source well to a target well.
Diagnostic & Resolution Workflow:
- Confirm: Run a dedicated carryover assay.
- Prepare a "source" plate with Column 1 containing a high-concentration tracer (e.g., 1 mg/mL BSA-FITC). Fill all other wells with buffer.
- Using the suspect liquid handler, transfer 10 µL from Column 1 to Column 2, then perform a serial dilution across the plate without changing tips (or with the suspected recycling method).
- After transfers, measure fluorescence. A gradient of signal in wells that should contain only buffer confirms liquid carryover.
- Solution: Enable and validate "tip touch" or "blow-out" functions on your liquid handler to ensure complete droplet expulsion. Mandate the use of fresh tips for all transfers between wells, especially for critical reagents like primers, ligases, or ATP.
Q3: We see entire columns or rows exhibiting identical off-target signal shifts. What is this signature telling us?
A: Linear, row/column-wide artifacts are almost exclusively due to microfluidic channel cross-talk or multi-channel pipette misalignment in high-density arrays (e.g., 384- or 1536-well plates). Fluid travels via surface tension or capillary action between adjacent wells.
Troubleshooting Steps:
- Inspect: Use a plate microscope to check for liquid bridges or meniscus breaches between wells.
- Test: Perform a hydrodynamic crosstalk assay.
- Fill every other column with a colored dye solution at the standard working volume.
- Fill the alternating columns with buffer.
- Centrifuge the plate briefly (e.g., 300 x g for 1 minute) to settle liquid.
- Incubate the plate under normal assay conditions (with shaking if used) for the duration of your experiment.
- Visually and quantitatively inspect for dye migration into buffer columns.
- Resolution: Reduce dispensed volumes to increase meniscus stability and prevent bridging. Ensure the plate is level during incubation and shaking. For microfluidic devices, consult the manufacturer for a recommended "crosstalk validation" protocol.
Q4: What data pattern indicates contaminant introduction during the reagent manufacturing or storage phase?
A: Batch-wide, plate-wide signals affecting all samples exposed to a specific reagent lot. The signature is a systematic, uniform background shift across all experimental wells that correlates with the use of a new reagent batch, while old-batch controls remain clean.
Investigative Protocol:
- Isolate: Split your experiment across two identical plates, using the suspect reagent lot on one and a reserved, validated lot on the other.
- Spike & Recovery Test: To identify the contaminated component, perform a limited spike-in experiment with the suspect reagent.
- In a clean plate, set up a control reaction with validated components.
- In parallel reactions, systematically replace one component at a time with its equivalent from the suspect lot.
- The reaction that shows aberrant signal identifies the contaminated reagent.
- Action: Quarantine the suspect lot and notify the supplier with your control data.
Experimental Protocols for Cross-Contamination Detection
Protocol 1: Dye-Based Aerosol & Carryover Mapping
- Objective: Visualize non-contact and liquid handling contamination patterns.
- Materials: Clear-bottom assay plate, high-concentration fluorescent dye (e.g., 100 µM Sulforhodamine B), PBS buffer, plate reader/imager.
- Method:
- Fill select "source" wells (e.g., A1, P24) with 50 µL of dye.
- Fill all other wells with 50 µL of PBS.
- Subject the plate to the standard robotic liquid handling protocol under investigation (including sealing, mixing, transfer).
- Image the plate using appropriate fluorescence channels without opening the seal.
- Data Interpretation: Contamination appears as streaks, spots, or gradients emanating from source wells.
Protocol 2: qPCR-Based Nucleic Acid Cross-Contamination Assay
- Objective: Detect trace-level nucleic acid carryover with high sensitivity.
- Materials: Two sets of primers/probes: one for a high-copy "contaminant" plasmid (10^6 copies/µL) and one for a low-copy "target" amplicon (10^2 copies/µL). qPCR master mix, nuclease-free water.
- Method:
- In a source plate, prepare wells containing the high-copy contaminant plasmid.
- Using the liquid handler in question, immediately transfer water to a fresh qPCR plate, then add master mix and the low-copy target.
- Run qPCR with both probe sets.
- Data Interpretation: Amplification in the target reactions with the contaminant probe set confirms nucleic acid carryover. Cycle threshold (Ct) shifts can quantify contamination levels.
Table 1: Signature Patterns and Likely Sources
| Observed Data Pattern | Most Likely Contamination Type | Common Source in Workflow |
|---|---|---|
| Radial/Gradient Intensity | Aerosol/Droplet | Plate Sealing, High-Speed Pipetting |
| Random, Sporadic Positive Controls | Liquid Carryover | Reused/Contaminated Pipette Tips |
| Entire Row/Column Artifact | Hydrodynamic Crosstalk | Microfluidic Channels, Well Bridging |
| Uniform Batch-Wide Background Shift | Reagent Contamination | Compromised Stock or Buffer |
| Negative Control Clustering Near Positives | Splash or Surface Contamination | Overly Vigorous Mixing |
Table 2: Quantitative Impact of Common Contaminants in Cell-Based Assays
| Contaminant Type | Typical Concentration Causing 20% Signal Artefact | Assay Most Affected |
|---|---|---|
| Detergent Carryover | 0.001% (v/v) | Membrane Integrity, Cytotoxicity |
| DMSO Inconsistency | ±0.5% (v/v) | Any Cell-Based Phenotypic Screening |
| ATP Contamination | 10 pM | Kinase/Luminescence Assays |
| RNase Contamination | Trace Levels | RNA-seq, qPCR |
| Mycoplasma | 100 CFU/mL | All Cell Culture Assays |
The Scientist's Toolkit: Key Research Reagent Solutions
| Item & Purpose | Example Product/Technique | Function in Contamination Control |
|---|---|---|
| Luminescent ATP Detection Reagent | CellTiter-Glo | Detects microbial or cellular ATP contamination in buffers or cultures. |
| Nuclease-Free Water & Certified Reagents | UltraPure DNase/RNase-Free Water | Provides a baseline free of nucleic acid contaminants for sensitive molecular biology. |
| Fluorescent Tracer Dyes (Non-Reactive) | Sulforhodamine B, Fluorescein | Visualizes aerosol and liquid handling paths without interfering with assay chemistry. |
| PCR Carryover Prevention Reagent | dUTP + Uracil-DNA Glycosylase (UDG) | Enzymatically degrades contaminating amplicons from previous PCR reactions. |
| Barrier Pipette Tips | Filter Tips with Aerosol Barriers | Prevents aerosol and liquid carryover into pipette shafts during aspiration. |
| Mycoplasma Detection Kit | MycoAlert | Rapidly detects mycoplasma contamination in cell cultures used in assay development. |
| Mass Spectrometry-Grade Solvents & Water | Optima LC/MS Grade | Eliminates background ions and interferents in mass spectrometry-based readouts. |
| Hydrophobic Plate Seals (Non-Aerosol Generating) | Adhesive Aluminum Seals | Provides a secure seal without roller-induced aerosol generation compared to permeable film seals. |
Diagrams
Diagram 1: Diagnostic Decision Tree for Contamination Patterns
Diagram 2: Troubleshooting Workflow for Contamination Issues
This technical support center provides guidance for researchers conducting systematic fault isolation in the context of cross-contamination within high-density microwell arrays. This framework is critical for ensuring data integrity in multiplexed assays, high-throughput screening, and drug discovery workflows.
Troubleshooting Guides & FAQs
Q1: We observe unexpected fluorescent signals in negative control wells during a high-throughput screening assay. How do we determine if this is due to aerosol cross-contamination or a plate reader artifact?
A: Perform a Spatial Control Pattern Experiment.
- Protocol: Load a test plate with a fluorescent dye (e.g., Fluorescein) in a "checkerboard" pattern (alternating positive and buffer-only negative wells). Seal the plate. Prepare an identical second plate filled only with buffer. Place the second plate on top of the first, aligned, and incubate for 1 hour under normal assay conditions (including shaking if used). Separate the plates and read each plate's fluorescence individually.
- Diagnosis: If the buffer-only plate shows a mirror-image pattern of fluorescence, aerosol or droplet cross-contamination during liquid handling is confirmed. If the pattern is only present on the original plate, the fault lies with the plate reader (e.g., optical crosstalk, light leak) or the liquid handling during initial dispensing.
Q2: Our cell viability data from a 1536-well cytotoxicity assay shows high well-to-well variability in the same column. Is this a pipetting error or contamination from a shared reagent reservoir?
A: Implement a Column-Row Isolation Test.
- Protocol: Design two diagnostic plates. In Plate A, dispense a viability indicator (e.g., Resazurin) using a single tip for an entire column, using a fresh tip for each column. In Plate B, dispense the same reagent from a shared row-wise reservoir using a multi-channel pipettor or dispenser. Fill all wells with identical cell suspension and a control compound.
- Diagnosis: Systematic errors appearing in entire columns of Plate A indicate a tip-based or pipettor carriage issue. Errors appearing in entire rows of Plate B pinpoint contamination or inconsistency in the shared reservoir. Random errors suggest cell seeding inconsistency or environmental factors.
Q3: How can we distinguish genuine biological signaling from background caused by contaminating biomolecules (e.g., cytokines) in a multiplexed bead-based immunoassay?
A: Execute a Bead & Buffer Mediation Assay.
- Protocol: Prepare three sets of samples: i) Test samples, ii) Bead-only controls (assay buffer with beads, no sample), and iii) Buffer-only controls (all reagents except beads). Run the full assay protocol on all three sets.
- Diagnosis: Elevation in signal in the test samples compared to the bead-only control indicates sample-specific binding. If the bead-only control shows elevated background, it suggests contamination of the bead stock or detection antibody. Consistent background in all three sets points to contaminated substrate or buffer solutions.
Q4: Our qPCR results from arrayed reactions show amplification in NTC (No Template Control) wells adjacent to high-titer samples. What is the most efficient way to isolate the source?
A: Conduct a Hierarchical Partitioning Test.
| Test Tier | Suspect Component(s) | Diagnostic Experiment | Positive Indicator |
|---|---|---|---|
| 1 | Master Mix Contamination | Create a "Master Mix Only" NTC from a fresh aliquot. Run alongside assay. | Amplification in new MM-NTC. |
| 2 | Cross-Plate Contamination | Load a plate with high-titer samples only in columns 1 & 12. Load NTCs in center columns. Seal, vortex, centrifuge. | Amplification in distant NTCs. |
| 3 | Pipettor/Tip Carryover | Use a dedicated pipettor/tips for template addition only. Use a separate system for master mix. | Amplification persists only with suspect pipettor. |
| 4 | Aerosol during Sealing | Process a plate but do not seal it. Cover with a clean silicone mat. After incubation, seal and run. | Amplification reduced without initial seal. |
Key Experimental Protocols
Protocol: Dye Migration Test for Assessing Well-to-Well Leakage
Purpose: To diagnose physical breaches in microwell plate seals or walls under assay conditions.
- Materials: Clear-bottom 384-well plate, high-concentration (1 mM) Sulforhodamine B (red) and Fluorescein (green) dyes, compatible plate seal, microplate reader.
- Method:
- Fill wells in Column 1 with red dye. Fill wells in Column 2 with buffer. Fill wells in Column 3 with green dye.
- Seal the plate firmly using the standard method.
- Incubate the plate at the assay's standard temperature (e.g., 37°C) with orbital shaking (if used) for the typical assay duration.
- Read fluorescence at appropriate wavelengths for both dyes in all wells.
- Data Analysis: Calculate the median fluorescence intensity (MFI) for each dye in its source column. Compute the signal-to-background ratio in adjacent buffer wells. A ratio >5 in adjacent wells indicates significant leakage or seal failure.
Protocol: Liquid Handler Performance Qualification (PQ) for Cross-Contamination
Purpose: To quantify the carryover rate of a automated liquid handling system.
- Materials: Two source solutions: "High" concentration solution (e.g., 100 µM fluorescent probe), "Low" concentration solution (assay buffer), liquid handler with tips being tested.
- Method:
- Program the handler to perform an aspirate-dispense wash cycle from High to Low source, repeating for n transfers (e.g., n=10).
- After the final transfer, measure the fluorescence of the Low source solution.
- Calculation: Carryover % =
[FL_low(final) - FL_low(initial)] / [FL_high(initial) - FL_low(initial)] * 100. Acceptable thresholds are typically <0.1% for high-precision work.
Visualizing the Diagnostic Workflow
Title: Systematic Fault Isolation Decision Tree
The Scientist's Toolkit: Research Reagent Solutions
| Item | Function in Fault Isolation | Key Consideration |
|---|---|---|
| Inert Fluorescent Tracers (e.g., Fluorescein, Sulforhodamine B) | Simulate analyte behavior to track contamination paths via plate readers. | Use spectrally distinct dyes to test multiple potential leak directions simultaneously. |
| Molecular Biology-Grade Water (Nuclease-Free) | Serves as the ultimate negative control for molecular assays (qPCR, sequencing). | Always from a sealed, dedicated source for NTCs to rule out waterborne contamination. |
| Precision Microplate Seals (Foil, Thermal, Silicone) | Critical for assessing seal integrity. Different types test for aerosol vs. liquid leakage. | Test seal compatibility with assay temperatures and solvents to avoid degradation. |
| Electronic Multichannel Pipettors | Enable consistent reagent dispensing; their calibration status is often a variable. | Regular maintenance and calibration checks are essential. Use for diagnostic partition tests. |
| Cell Viability Probes (Resazurin, CTC, CFDA-AM) | Indicators of biological cross-talk (e.g., cytotoxic compound migration). | Choose probes compatible with your detection systems and cell types. |
| BSA or Casein-Based Blocking Buffers | Used to passivate surfaces (tips, reservoirs) and assess non-specific binding contributions. | Helps isolate fault between specific binding and surface adsorption. |
| Single-Use, Filtered Pipette Tips | The first line of defense against aerosol and liquid carryover. | For critical diagnostics, use fresh tips for every transfer, even within the same protocol. |
| Validated Negative Control Matrices (e.g., Human Serum, Lysate) | Provides the true biological background for assays, distinguishing it from introduced artifacts. | Must be sourced from a reliable pool and confirmed to be free of the target analytes. |
Troubleshooting Guides & FAQs
Q1: We are experiencing high background signal and inconsistent results in our high-density array assays (e.g., 1536-well). Could this be linked to our wash station's detergent protocol? A: Yes, residual detergent is a common cause. For high-density tips, the proximity of wells increases cross-contamination risk. Modern protocols recommend using low-foaming, low-residue detergents specifically formulated for laboratory automation. A critical step is a final rinse with ultra-pure water (Type I) to eliminate detergent carryover. Ensure detergent concentration does not exceed 0.1% v/v for most applications. Excessive detergent can create films that trap contaminants.
Q2: What is the optimal wash volume for 1536-well plates, and how many cycles are needed? A: Wash volume is more critical than cycle count. A high-volume, low-cycle protocol is more effective at removing contaminants from dense arrays than multiple low-volume washes. For 1536-well plates, a wash volume of 50-80 µL per well is recommended, despite the well volume being smaller. This ensures adequate fluid exchange. Typically, 3-5 cycles with this volume are sufficient. See Table 1.
Q3: How crucial is the dry cycle, and what parameters minimize aerosol cross-contamination? A: The dry cycle is paramount. Incomplete drying is a primary vector for liquid-born cross-contamination across wells. Protocols must include an active drying step (vacuum or nitrogen blow-down) followed by a static drying period. Avoid high-speed orbital shaking to dry, as it creates aerosols. A recommended sequence is: 1-second strong vacuum, followed by 5-10 seconds of residual vacuum hold, and a 2-5 minute bench dry if protocol allows.
Q4: We see "striping" patterns in our data. Is this a wash station issue? A: Yes, "striping" often correlates with the wash head's path. It indicates inconsistent wash buffer delivery or aspiration across the plate. This can be due to clogged or misaligned wash head nozzles, particularly problematic with high-density tips. Perform weekly maintenance: sonicate nozzles in 10% acetic acid, then rinse with water and ethanol. Calibrate the wash head height and alignment monthly.
Key Experimental Protocols Cited
Protocol 1: Validation of Wash Efficiency via Dye Carryover Test.
- Prepare a source plate: Fill alternating columns of a 1536-well plate with a concentrated, non-volatile dye (e.g., 10 µM sulforhodamine B).
- Run a standard assay protocol on the liquid handler, including the wash steps to be validated.
- Transfer the contents of the washed "test" plate to a clean detection plate.
- Measure fluorescence in all wells. Effective washing shows no signal in wells adjacent to dye-filled wells.
- Calculate cross-contamination as a percentage of the original dye signal.
Protocol 2: Detergent Residue Quantification.
- Perform a standard wash protocol on a clean plate, including detergent and final rinse.
- Add a low-ionic-strength buffer (e.g., 10 mM Tris, pH 7.5) to each well.
- Measure the solution conductivity in each well using a plate-based reader.
- Compare against a control plate rinsed only with Type I water. Elevated conductivity indicates ionic detergent residue.
Data Presentation
Table 1: Optimized Wash Parameters for High-Density Plates
| Plate Format | Recommended Wash Volume per Well | Minimum Wash Cycles | Detergent Conc. (v/v) | Critical Dry Step Duration |
|---|---|---|---|---|
| 384-well | 100 - 150 µL | 3 | ≤ 0.1% | 1-2 min (Vacuum + Hold) |
| 1536-well | 50 - 80 µL | 3-5 | ≤ 0.1% | 2-5 min (Vacuum + Hold) |
The Scientist's Toolkit: Research Reagent Solutions
| Item | Function & Rationale |
|---|---|
| Low-Residue, Low-Foam Detergent | Removes protein/nucleotide contaminants without leaving a film that interferes with assays. |
| Type I (Ultrapure) Lab Water | Final rinse agent to eliminate ionic and organic residues from detergents and samples. |
| Non-Volatile Tracer Dye (e.g., Sulforhodamine B) | Validates wash efficiency and maps potential cross-contamination paths. |
| Conductivity Standard Solutions | Calibrates plate readers for the detergent residue quantification assay. |
| Nozzle Cleaning Solution (10% Acetic Acid) | Dissolves salt and protein clogs in wash head manifolds without damaging components. |
Visualizations
Wash Station Protocol for Contamination Removal
Troubleshooting High Background in Wash Protocols
Troubleshooting Guides & FAQs
FAQ 1: What are the primary environmental factors that contribute to cross-contamination in high-density microwell arrays? The key factors are uncontrolled humidity, electrostatic discharge (ESD), and turbulent or particulate-laden airflow. Low humidity (<40% RH) promotes static buildup, which can attract airborne particulates and cause liquid droplet deflection during pipetting. High humidity (>60% RH) increases the risk of condensation and biomolecule hydration instability. Unmanaged airflow can disperse aerosols between plates.
FAQ 2: How can I quickly diagnose if ambient static is affecting my HTS liquid handling? Conduct a simple deflection test. Using a calibrated electronic pipette, dispense a 1 µL droplet of distilled water from a height of 5 mm above the target well. Observe the droplet under a magnifier. A consistent deviation of more than 0.5 mm from the target center indicates significant static influence. Measure relative humidity (RH) and static charge at the workspace simultaneously using a thermo-hygrometer and a static field meter.
Table 1: Static vs. Humidity Relationship & Observed Impact
| Relative Humidity (% RH) | Typical Static Potential (kV) | Observed Pipetting Error (µL, ±) | Cross-Contamination Risk Level |
|---|---|---|---|
| 20-30% | 10-15 | 0.05 - 0.1 | Critical |
| 40-50% | 2-5 | 0.01 - 0.02 | Low |
| 50-60% | 0.5-1 | < 0.01 | Minimal |
| >70% | <0.5 | < 0.01 | Low (Risk: Condensation) |
FAQ 3: Our lab's HVAC causes periodic airflow gusts. What is a reliable protocol to test for aerosol dispersion between arrays? Protocol: Fluorescent Tracer Aerosol Dispersion Test
- Materials: Two identical 1536-well plates, fluorescent dye (e.g., 10 mM Fluorescein), plate sealer, microplate reader.
- Setup: Fill all wells in "Source Plate" with a non-volatile buffer. Fill four corner wells (A1, A48, P1, P48) and the center well (H24) with the fluorescent dye solution. Fill all wells of the "Test Plate" with buffer only.
- Procedure: Place the plates on the workstation 15 cm apart, oriented to mimic a typical workflow. Activate the HVAC system or use a fan to simulate a gust for 30 seconds. Seal both plates and incubate for 1 hour.
- Analysis: Read the Test Plate fluorescence (Ex: 485nm, Em: 528nm). Any signal >3 standard deviations above the background mean of control wells indicates aerosol transfer. Repeat under different humidity (45% vs 35% RH) conditions for comparison.
FAQ 4: What are the recommended environmental setpoints to minimize cross-contamination risk? Maintain a stable environment: 45% ± 5% RH and 22°C ± 1°C. Airflow should be laminar, directed away from open plates, with a velocity of 0.2-0.5 m/s. Positive pressure in the lab and the use of conductive or static-dissipative mats are critical.
Table 2: Optimal Environmental Parameters for HTS Workspace
| Parameter | Target Setpoint | Monitoring Tool | Corrective Action if Out of Range |
|---|---|---|---|
| Temperature | 22°C ± 1°C | Calibrated data logger | Calibrate room HVAC; use local environmental chamber. |
| Relative Humidity | 45% ± 5% RH | Thermo-hygrometer with alarm | Employ a room humidifier/dehumidifier system. |
| Airflow Velocity | 0.3 m/s (laminar) | Anemometer | Adjust diffusers; install local laminar flow hood. |
| Static Charge | < ±0.5 kV at workspace | Static field meter | Use ionizing blowers, grounded mats, increase RH to 45%. |
| Particulate Count | ISO Class 5 (ISO 14644-1) | Particle counter | Check HEPA filter integrity; review gowning procedures. |
The Scientist's Toolkit: Essential Materials for Environmental Control
Table 3: Research Reagent & Solutions for Environmental Control Experiments
| Item | Function & Rationale |
|---|---|
| Conductive / Anti-Static Mat | Provides a grounded path to dissipate charge from equipment and personnel, reducing ESD. |
| Portable Ionizing Air Blower | Neutralizes static charge on non-conductive surfaces (e.g., plastic plate lids) prior to handling. |
| Calibrated Thermo-Hygrometer | Provides accurate, real-time monitoring of primary environmental variables (Temp, RH). |
| Data Logging Environmental Monitor | Tracks and records parameters over time for correlation with experimental anomalies. |
| Static Dissipative Pipette Tips | Reduces charge buildup during aspiration/dispensing, improving accuracy. |
| Sealing Films with Conductive Coat | Prevents static buildup on sealed plates and minimizes airborne contamination. |
| Fluorescent Tracer Dye (e.g., Fluorescein) | High-sensitivity agent for visualizing and quantifying aerosol dispersion. |
| Particle Counter | Quantifies airborne particulates, a key vector for cross-contaminant transport. |
Experimental Workflow for Environmental Validation
Title: HTS Environmental Validation & Control Workflow
Pathway of Cross-Contamination in Uncontrolled Environments
Title: Environmental Faults Leading to Array Cross-Contamination
Technical Support Center
Troubleshooting Guides & FAQs
FAQ Section 1: Viscous Compound Handling in Microwell Arrays
Q1: Our high-throughput screening of viscous lipid formulations consistently shows cross-talk between adjacent wells in 1536-well plates. How can we mitigate this? A: The primary issue is droplet drag and tip retention. Implement a positive displacement pipetting system with disposable capillaries to eliminate air interface contamination. Pre-wet tips with DMSO or your carrier solvent before aspirating the viscous compound. Reduce pipetting speed to <5 µL/sec for aspirate and dispense. Incorporate a post-dispense "tip touch" to a clean, dry section of the well wall to remove hanging droplets. Data from a recent study shows these changes reduced contamination from 12.3% to 0.8% in neighboring wells (see Table 1).
Q2: When using automated liquid handlers for glycerol-based solutions, we observe inconsistent volumes and splash events. What protocol adjustments are needed? A: This is due to the high surface tension and cohesion of viscous fluids. Refine your protocol as follows: 1) Use low-retention, coated tips. 2) Increase the delay after aspiration to 500ms to allow fluid settling. 3) Employ a reverse pipetting technique for dispensing. 4) Set a z-offset of 1.0-1.5 mm above the well bottom for dispensing to avoid immersion and splash-back. Calibrate the liquid handler using a gravimetric method with the specific viscous compound.
FAQ Section 2: Cell Co-culture Assay Contamination
Q3: In Transwell co-culture invasion assays, we detect significant migration of contaminating cells through the membrane, skewing our results. How can we ensure purity? A: Unintended migration is often due to membrane pore size mismatch or excessive seeding density. First, validate pore size (e.g., use 3.0µm for lymphocytes, 8.0µm for larger tumor cells). Implement a protocol refinement: Pre-coat the underside of the membrane with a gelatin or fibronectin matrix only after placing it in the receiver plate. Seed the "invading" cell type at a density not exceeding 50,000 cells per insert for a 24-well format. After the assay, instead of manual swabbing, use a fixed-cell staining kit that differentially labels top vs. bottom cells. A standard protocol is provided below.
Q4: For direct-contact co-cultures in high-density arrays, how can we prevent cross-contamination during downstream analysis like cell sorting or RNA-seq? A: Utilize fluorescent labelling with CellTracker dyes prior to co-culturing. Use distinct, non-overlapping dyes for each cell type (e.g., CMFDA [Green] for Type A, CMTPX [Red] for Type B). Incubate cells separately with dyes for 45 min, then quench with serum-containing media and wash three times before co-seeding. This allows for precise post-assay separation via FACS. Critical: Include a control well of each dye-labelled cell type alone to check for dye transfer, which indicates gap junction activity and requires shorter co-culture times.
FAQ Section 3: General Microwell Array Contamination
Q5: Aerosol formation during plate centrifugation steps seems to cause random well-to-well contamination. What is the solution? A: Always use a microplate sealing film that is pierceable for centrifugation. Securely apply the film with a roller. Do not overfill wells; maintain at least 2 mm of headspace. Perform a "soft-start" centrifugation: ramp to 200 x g over 30 seconds, hold for intended time, then decelerate over 30 seconds. Plates should be balanced in the rotor with a counterweight plate of equal mass.
Data Presentation
Table 1: Impact of Protocol Refinements on Contamination Rates in Viscous Compound Assays (384-well format)
| Protocol Step | Standard Method Contamination (%) | Refined Method Contamination (%) | Key Change |
|---|---|---|---|
| Aspiration | 8.5 | 0.5 | Positive displacement tips, 5 µL/s speed |
| Dispensing | 7.2 | 0.7 | Reverse pipetting, 1.5mm z-offset |
| Tip Handling | 4.1 | 0.2 | Pre-wetting with DMSO, tip-touch to wall |
| Overall Assay | 15.8* | 1.2 | Combined refined steps |
Note: Overall contamination is not a sum, but measured endpoint.
Table 2: Efficacy of Cell Labelling Strategies in Co-culture Separation
| Labelling Method | Purity Post-FACS (%) | Viability Post-Sort (%) | Risk of Dye Transfer |
|---|---|---|---|
| Constitutive GFP/RFP | 99.8 | 95.2 | None |
| CellTracker Dyes | 98.5 | 90.1 | Low (Time-dependent) |
| Lipophilic Memb. Dyes (PKH) | 97.0 | 85.5 | Moderate (Can fuse) |
| No Label / Morphology | 75.3 | N/A | High |
Experimental Protocols
Protocol 1: Refined Liquid Handling for Viscous Compounds
- Equipment Setup: Configure automated liquid handler with positive displacement tips.
- Pre-wetting: Command an extra aspirate/dispense cycle of 5 µL DMSO into a waste reservoir.
- Aspiration: Aspirate target viscous compound at 5 µL/s with a 500ms delay post-aspiration.
- Dispensing: Using reverse pipetting, dispense into target well with a 1.5mm z-offset. Use 3 µL/s dispense speed.
- Tip Touch: Move tip to touch the inner wall of the well, 2mm above the liquid meniscus.
- Tip Discard: Eject tip to waste.
Protocol 2: Contamination-Free Transwell Invasion Assay
- Membrane Preparation: Place Transwell insert into receiver plate with assay media. Coat the underside of the membrane by adding 50 µL of Matrigel (50 µg/mL) to the receiver well and incubating for 2 hrs at 37°C. Remove insert and wipe underside clean before proceeding.
- Cell Seeding: Trypsinize and resuspend invasive cells. Seed 50,000 cells in 200 µL serum-free media into the top chamber.
- Checks: Add 500 µL of chemoattractant (e.g., 10% FBS media) to the lower chamber. Incubate for 22 hrs.
- Fix & Stain: Do NOT swab. Fix cells by immersing insert in 4% PFA for 20 min. Permeabilize and stain with DAPI (nuclei) and Phalloidin (actin) following standard IF protocols. Image bottom of membrane.
Visualizations
Diagram 1: Refined Viscous Liquid Workflow
Title: Viscous compound handling workflow to minimize contamination.
Diagram 2: Co-culture Separation & Analysis Pathway
Title: Cell separation pathway for uncontaminated co-culture analysis.
The Scientist's Toolkit: Research Reagent Solutions
| Item | Function & Rationale |
|---|---|
| Positive Displacement Tips | Eliminate air gap, preventing aerosol and carryover of viscous or volatile liquids. |
| Low-Retention, Filtered Tips | Reduce adhesion of biomolecules (proteins, DNA) to tip surface, standard for cell-based assays. |
| Pierceable Sealing Film | Allows plate centrifugation without aerosol generation or film rupture. |
| CellTracker CMFDA Dye | Cytoplasm-labeling green fluorescent dye for long-term tracking of live Cell Type A. |
| CellTracker CMTPX Dye | Cytoplasm-labeling red fluorescent dye for long-term tracking of live Cell Type B. |
| Matrigel Matrix | Basement membrane extract for coating Transwells, providing a physiologically relevant barrier for invasion. |
| DMSO (Cell Culture Grade) | High-purity solvent for pre-wetting tips and dissolving viscous compounds without cytotoxic effects. |
| Automated Liquid Handler | Ensures precision and reproducibility of refined pipetting protocols across high-density plates. |
Proving Your Data is Clean: Validation Strategies and Technology Comparisons
Technical Support Center: Troubleshooting & FAQs
Q1: Our negative controls show unexpectedly high fluorescence signal in our microwell tracer experiment. What could be the cause? A: This is a common indicator of aerosol or liquid-borne contamination. First, verify that your liquid handler is properly calibrated for small volumes (< 1 µL), as droplet carryover is a prime suspect. Ensure you are using filter tips for all pipetting steps. Check the integrity of plate seals; a poorly sealed plate can lead to well-to-well evaporation and condensation, redistributing the tracer. Run a systematic check by including a "water blank" control on every plate quadrant.
Q2: The fluorescent signal from our positive control tracer is inconsistent across replicate wells. How can we improve reproducibility? A: Inconsistent signal often stems from inadequate mixing or settling of the tracer stock. Vortex the tracer stock solution for 30 seconds and briefly centrifuge before each use. When spiking the tracer into your sample matrix, use a multi-step dilution to ensure homogenous distribution. Always include an on-plate standard curve (e.g., 1:2 serial dilution of the tracer) to quantify any inter-plate variability. Plate reader focusing and gain settings should be optimized and fixed for all experiments in a series.
Q3: We suspect nonspecific adsorption of our fluorescent tracer to plasticware, leading to low recovery. How can we mitigate this? A: Many fluorescent dyes are hydrophobic and prone to adsorption. Pre-treat all tubes and plates with a passivation agent. A 0.1-1% solution of bovine serum albumin (BSA) or Pluronic F-68 in buffer, incubated for 1 hour followed by rinsing, can effectively block adsorption sites. Alternatively, consider switching to a tracer molecule conjugated to a hydrophilic linker or using a different material (e.g., polypropylene vs. polystyrene).
Q4: How do we differentiate between true sample carryover and background fluorescence from assay reagents? A: Implement a two-stage control strategy. First, run a "reagent-only" background plate containing all assay components except the sample and tracer. Second, use a spectrally distinct "system suitability" tracer in a separate channel. For example, if your contamination assay uses FITC (λex/~490 nm, λem/~525 nm), use Cy5 (λex/~650 nm, λem/~670 nm) as a system control to identify physical carryover independent of spectral overlap.
Q5: What is the acceptable limit for cross-contamination in high-density array drug screening? A: Acceptable limits are application-dependent but must be defined based on risk. For quantitative screening (e.g., IC50 determination), contamination must be below the assay's limit of detection (LOD). For binary (hit/no-hit) screens, contamination should be below the threshold that causes a false positive. The following table summarizes typical benchmarks:
Table 1: Benchmarks for Contamination Control in Microwell Arrays
| Assay Type | Recommended Max Contamination | Key Tracer Concentration | Validation Method |
|---|---|---|---|
| High-Throughput Screening (HTS) | < 0.5% carryover | 1-10 µM fluorescent small molecule | Linear regression of tracer dilution series in target matrix. |
| Cell-Based Viability | < 0.1% carryover | 0.1-1.0 mg/mL FITC-Dextran (10-70 kDa) | Spike-and-recovery in conditioned media. |
| qPCR / NGS Library Prep | < 0.01% carryover | 1-10 pM dsDNA intercalating dye (e.g., SYBR Green) | qPCR quantification of tracer in no-template controls. |
Experimental Protocol: Microwell Cross-Contamination Assay Using FITC-Dextran
Objective: To quantify liquid carryover between wells in a 384-well plate during automated liquid handling.
Materials:
- Tracer Solution: 1 mg/mL FITC-Dextran (70 kDa) in PBS.
- Assay Buffer: PBS, pH 7.4.
- Plates: Black-walled, clear-bottom 384-well microplate.
- Equipment: Automated liquid handler, plate centrifuge, fluorescence plate reader ( FITC filter set: Ex 485/20, Em 528/20).
Procedure:
- Plate Layout: Designate alternating columns as "Source" (Column 1, 3, 5...) and "Receiving" (Column 2, 4, 6...) columns.
- Tracer Addition: Pipette 30 µL of 1 mg/mL FITC-Dextran solution into all "Source" wells.
- Buffer Addition: Pipette 30 µL of assay buffer into all "Receiving" wells.
- Simulated Transfer: Program the liquid handler to perform the aspirate-dispense cycle you wish to test. Perform a transfer of 1 µL from each "Source" well to the adjacent "Receiving" well. Use the exact tips, speeds, and mix cycles as in your experimental protocol.
- Control Wells: Include "Tracer Only" controls (Source wells post-transfer) and "Buffer Only" controls (Receiving wells with no transfer).
- Read Plate: Centrifuge plate briefly at 1000 rpm for 1 minute. Read fluorescence in all wells.
- Calculation: Calculate percent carryover using the formula:
% Carryover = [(Mean RFU of Receiving Wells) - (Mean RFU of Buffer Only)] / [(Mean RFU of Tracer Only) - (Mean RFU of Buffer Only)] * 100
Workflow Diagram: Tracer-Based Contamination Assessment
Title: Cross-Contamination Assay Validation Workflow
The Scientist's Toolkit: Key Research Reagent Solutions
Table 2: Essential Materials for Fluorescent Tracer Contamination Studies
| Item | Function | Key Consideration |
|---|---|---|
| Fluorescent Tracers (FITC-Dextran, Rhodamine B) | Mimics physicochemical properties of samples to track liquid movement. | Match tracer size/charge to your sample (e.g., 70 kDa dextran for proteins). |
| Low-Adsorption Microplates | Minimizes nonspecific binding of tracer, improving signal-to-noise. | Look for plates treated with a hydrophilic polymer coating. |
| Positive Displacement / Filter Tips | Eliminates aerosol and liquid carryover within the pipettor. | Essential for any automated screen handling >1,000 samples. |
| Plate Seals, Optically Clear | Prevents evaporation and cross-well condensation during incubation. | Ensure compatibility with your plate reader detection system. |
| Passivation Solution (e.g., BSA, Pluronic) | Blocks active sites on plastic and fluidic paths to prevent tracer loss. | Must be inert to your biological system. |
| High-Sensitivity Plate Reader | Detects low levels of tracer fluorescence with high precision. | Configurable filters/PMT gain for your tracer's spectrum are critical. |
| Liquid Handler Performance Kits | Provides standardized dyes and protocols for instrument QC. | Use before and after major campaigns to ensure robotic precision. |
Statistical and Imaging Methods for Contamination Detection in Large Datasets
Technical Support Center: Troubleshooting High-Density Microwell Array Analysis
FAQs & Troubleshooting Guides
Q1: My automated image analysis pipeline is incorrectly flagging an unusually high percentage of wells as "contaminated." What could be the cause? A1: This is often due to illumination artifacts or incorrect thresholding.
- Check: Capture a flat-field image (image of an empty, uniformly fluorescent plate) to correct for uneven illumination across the array.
- Protocol - Flat-Field Correction:
- Prepare a blank array with buffer only.
- Image using the same channel, exposure, and gain as your experiment.
- In your analysis software (e.g., Python with OpenCV, ImageJ), divide your experimental image by the flat-field image and rescale the intensity.
- Adjust Segmentation: Re-calibrate the intensity threshold for object detection. Use a control well with known contamination to set a baseline.
Q2: How do I distinguish true biological signal from non-biological particulate contamination in my high-content screening data? A2: Apply multi-parametric statistical filtering.
- Methodology: Extract features beyond mean intensity: object size (area), circularity, intensity texture (standard deviation, entropy), and spatial distribution within the well.
- Analysis: Use a clustering algorithm (e.g., DBSCAN, k-means) on these features. True biological signals (e.g., cells) will cluster separately from rigid, highly circular, or texture-less particles.
Q3: My Z-factor and other assay quality metrics are plummeting in specific plate regions. What's the systematic issue? A3: This indicates systematic, location-dependent cross-contamination or edge effects.
- Troubleshoot:
- Liquid Handler: Check for calibrated pipetting heads and potential drips. Run a dye-based dispensing test.
- Plate Washer: Verify alignment and aspiration height to avoid well-to-well carryover.
- Environmental Controls: Check for condensation on plate lids, particularly at edges.
- Protocol - Dye-Based Carryover Test:
- Fill alternating columns of a plate with a high-concentration fluorescent dye (e.g., Fluorescein). Fill others with buffer.
- Run your standard liquid handling protocol.
- Image the plate. Quantify fluorescence in buffer-only wells. A >5% signal increase suggests liquid carryover.
Q4: Which statistical test is most robust for identifying contaminated wells in a population of thousands? A4: Use robust statistical measures that are less sensitive to outliers, which themselves may be contamination.
- Recommended Method:
- Calculate the Median Absolute Deviation (MAD) for your primary readout (e.g., total cell count per well).
- Flag any well where the readout deviates by more than 5 MADs from the plate median.
- This is more reliable than using mean and standard deviation, which are heavily skewed by severe outliers (contaminants).
Key Experimental Data Summary
Table 1: Comparison of Contamination Detection Methods
| Method | Primary Principle | Best For | Typical False Positive Rate | Required Data Type |
|---|---|---|---|---|
| Intensity Thresholding | Pixel intensity exceeds cutoff | Large, bright artifacts | 8-15% (varying background) | Single-channel image |
| MAD-based Filtering | Statistical outlier detection | Global outliers in any metric | 1-3% (tunable) | Numerical readout (e.g., cell count) |
| Morphological Screening | Object shape/size analysis | Non-cellular particles | 5-10% (cell variability) | Segmented object data |
| Machine Learning (CNN) | Multi-feature pattern recognition | Complex, subtle contamination | 2-5% (after training) | Raw image patches |
Table 2: Impact of Carryover on Assay Quality (Simulated Data)
| Carryover Volume (nL) | % Signal in Adjacent Well | Z-factor Reduction | Recommended Action |
|---|---|---|---|
| 1 nL | 0.2% | Negligible | Acceptable for most screens |
| 10 nL | 2.1% | -0.1 | Review pipetting precision |
| 50 nL | 9.8% | -0.4 | Critical: Service instrument |
| >100 nL | >20% | -0.7 | Stop: Assay integrity failed |
Experimental Protocols
Protocol 1: Imaging-Based Contamination Quantification
- Image Acquisition: Acquire whole-well images at 4x or 10x magnification for throughput.
- Pre-processing: Apply flat-field correction and a mild background subtract (rolling ball radius 50px).
- Segmentation: Use a dual threshold: (a) Lower bound to capture faint cells, (b) Upper bound to identify saturated objects.
- Feature Extraction: For objects above the upper threshold, calculate Area, Circularity, and Max Intensity.
- Classification: Flag objects with High Circularity (>0.9) AND Small Area (<100 μm²) as potential contaminants.
- Output: Report the percentage of contaminated wells per plate.
Protocol 2: Statistical Outlier Flagging for Plate Series
- Data Compilation: For each plate in a batch, compile the primary assay readout (e.g., normalized fluorescence intensity).
- Robust Scaling: For each plate, calculate the median (M) and Median Absolute Deviation (MAD).
- Flagging: Label any well where |(Well_Value - M)| / MAD > 5.
- Spatial Analysis: Plot flagged wells on a plate map. Clustering in a specific region indicates systematic error.
- Decision: If >2% of wells per plate are flagged, investigate systematic causes before proceeding.
Visualizations
Title: Contamination Detection & Data Validation Workflow
Title: Common Systematic Error Sources in Arrays
The Scientist's Toolkit: Research Reagent Solutions
Table 3: Essential Materials for Contamination-Control Experiments
| Item | Function & Rationale |
|---|---|
| Non-fluorescent PBS Buffer | Used for blank/control wells and dye dilution series. Provides a low-background fluid for testing liquid handling. |
| Fluorescein Isothiocyanate (FITC) 10mM Stock | High-intensity, stable fluorescent dye for quantifying liquid carryover and dispensing volume accuracy. |
| Cell-Impermeable Nuclear Stain (e.g., Propidium Iodide) | Distinguates between intact cells (negative) and cellular debris/contaminants with compromised membranes (positive). |
| Size-Standard Fluorescent Beads (1-20μm) | Calibrates imaging system resolution and provides known objects for validating morphological detection algorithms. |
| Anti-Adherence Rinsing Solution | Used to coat plates and liquid handler tips to minimize nonspecific binding of biomaterials, reducing carryover. |
| Liquid Handler Performance Verification Kit | Commercial dye-based kits (e.g., Artel MVS) for precise, colorimetric quantification of pipetted volumes across all channels. |
Troubleshooting Guides & FAQs
Q1: In our high-throughput screening assay using a 1536-well plate, we are observing consistent edge well effects (e.g., increased luminescence signal in perimeter wells) only when using our automated liquid handler. What could be the cause? A1: This is a classic sign of aerosol or droplet-based cross-contamination, often exacerbated by plate movement during the liquid handling cycle. On platforms with high-speed pipetting heads or rapid plate rotators, aerosols can be generated and settle on the exposed meniscus of outer wells. Protocol for Diagnosis: Run a control plate where alternating columns are filled with a high-concentration fluorophore (e.g., 1 µM fluorescein) and buffer. Perform a simulated transfer on the liquid handler without actually moving liquid. Use a plate reader to measure fluorescence in the buffer-only columns. Signal detection indicates aerosol transfer. Mitigation: Enable "liquid sensing" if available, reduce pipetting and travel speeds, increase tip-to-well bottom clearance during aspiration, and use a platform with a physically separated waste chute and positive pressure air filtration around the pipetting deck.
Q2: Our qPCR results show sporadic false positives in no-template controls (NTCs) that correlate with the use of a specific 384-channel electronic pipettor for master mix dispensing. How should we investigate? A2: This points to tip-to-tip or well-to-well contamination via the pipettor shaft or gasket. Protocol for Investigation: Perform a dye contamination test. Fill a source plate with a concentrated, visible dye. Perform a full aspirate/dispense cycle into a clean destination plate. Then, run a "dry" cycle (no liquid in tips) with the same pipettor into a third, dry plate containing only water. Visually inspect or spectrophotometrically quantify dye transfer in the third plate. Mitigation: Implement rigorous external and internal wash cycles for the pipettor between uses. For critical PCR applications, consider using disposable tip-based platforms or positive displacement systems. Regularly replace the pipettor's internal O-rings and seals per manufacturer schedule.
Q3: When performing serial dilutions for dose-response curves on a positive displacement system, we see a loss of linearity at low nanomolar concentrations. Is this contamination or something else? A3: While contamination is possible, this is more often an artifact of compound adsorption to the disposable syringe and tubing. Protocol to Discern: Run two identical dilution series: one in your standard buffer and one in buffer with a low concentration of a carrier protein (e.g., 0.1% BSA) or detergent. If linearity improves with BSA, adsorption is the primary issue. To test for liquid handler-induced contamination during this process, include a "water blank" dilution series where water is processed as if it were the compound. Subsequent analysis (e.g., UV-vis) of these blanks should show no compound signal.
Q4: After switching to an acoustic liquid handler for transferring DMSO-based compounds, we see carryover in subsequent aqueous buffer transfers. How can acoustic droplet ejection (ADE) cause this? A4: ADE is generally low-risk for liquid-borne contamination but can be susceptible to "splashback" or residue formation on the transducer surface or well plate lid. Investigation Protocol: Use a fluorescent compound in DMSO for the first transfer. After a standard deck wash procedure, eject buffer droplets from the same source well onto a dry surface (e.g., a clean glass slide) and check for fluorescence under a microscope. Mitigation: Optimize the "fireoff" droplet count (waste droplets fired before and after transfer). Ensure the deck wash includes a rinse of the transducer surface. Implement a "wash plate" step where the transducer fires into a dedicated wash reservoir filled with a DMSO-compatible solvent between compound plates.
Data Presentation
Table 1: Contamination Risk Profile of Liquid Handling Platforms
| Platform Type | Primary Contamination Vector | Key Risk Factors | Recommended Mitigation Strategies | Ideal Use Case |
|---|---|---|---|---|
| Air Displacement (Automated) | Aerosols, Tip Exterior | High speed, shared tip blocks, poor wash integrity | Enhanced wash cycles, tip touch-off, reduced speed | Aqueous assays, plate replication, medium throughput |
| Positive Displacement | Syringe/Tubing Adsorption | Polymer composition, solvent compatibility | Carrier proteins, solvent conditioning, dedicated lines | DMSO compounds, viscous/sensitive samples |
| Electronic Multi-Channel | Instrument Interior, Shaft | Seal wear, complex fluid path, splashback | Regular seal replacement, internal washes, external UV | PCR setup, reagent dispensing (non-critical) |
| Acoustic Droplet Ejection | Splashback, Surface Residue | Transducer cleanliness, droplet trajectory | Optimized fireoff, transducer wash, lid management | Compound library transfer, assay miniaturization |
| Manual Pipetting | Operator Error, Tip Aerosols | Technique variability, fatigue | Training, use of filter tips, consistent technique | Low throughput, prototyping |
Table 2: Quantitative Contamination Transfer in a Dye Test Protocol
| Liquid Handling Step | Platform A (Air Disp.) | Platform B (Pos. Disp.) | Platform C (Acoustic) |
|---|---|---|---|
| Direct Well-to-Well Transfer (Mean Fluorescence Units) | 1,250,000 | 950,000 | Not Applicable |
| Aerosol Transfer to Adjacent Well | 15,500 | < 500 (Background) | < 500 (Background) |
| Carryover After Wash Protocol (%) | 0.8% | 1.5%* | 0.05% |
| Time per 384-well Plate (min) | 4.5 | 6.2 | 1.8 |
*Attributed to adsorption; reduced to <0.1% with BSA carrier.
Experimental Protocols
Protocol: Dye-Based Aerosol and Carryover Contamination Assay Objective: Quantify non-contact contamination across liquid handling platforms. Materials: See "The Scientist's Toolkit" below. Method:
- Plate Setup: Fill Column 1 of a 384-well source plate with 50 µL of 100 µM fluorescein sodium salt in PBS. Fill all other wells with 50 µL of PBS.
- Contamination Simulation: Program the liquid handler to perform a mock transfer. Aspirate 2 µL from Column 1, then move to Column 2 and perform a dispense/aspirate cycle of 2 µL of PBS (simulating a wash). Repeat sequentially across the plate to Column 12.
- Positive Control: Manually add 2 µL of dye from Column 1 to Column 12 of a separate plate.
- Measurement: Read the plate using a fluorescence plate reader (ex: 485 nm, em: 528 nm).
- Analysis: Calculate the percentage signal in each column relative to the positive control (Column 12 of the control plate). Signal in Columns 2-11 indicates aerosol or carryover contamination.
Protocol: qPCR-Based Cross-Contamination Detection Objective: Detect nucleic acid carryover at levels relevant to molecular biology. Materials: High-concentration gDNA (e.g., 100 ng/µL), nuclease-free water, qPCR master mix for a ubiquitous target (e.g., ACTB), qPCR plates. Method:
- Source Wells: Prepare a "hot" source plate with 10 µL of gDNA in quadruplicate wells. Surround these wells with water blanks.
- Liquid Handling: Using the platform under test, perform serial transfers or a complex pipetting pattern from the "hot" wells to destination wells containing master mix, simulating a typical setup.
- Include Critical Controls: NTCs set up on a clean bench manually, and NTCs processed by the liquid handler immediately after the "hot" samples without a wash protocol.
- Run qPCR: Perform 40 cycles of amplification.
- Analysis: Compare Ct values of the handler-processed NTCs to the manual NTCs. A decrease of >3 cycles in handler NTCs indicates significant nucleic acid carryover.
Mandatory Visualization
Diagram 1: Workflow for Contamination Risk Assessment
Diagram 2: Contamination Vectors in Liquid Handling
The Scientist's Toolkit: Key Research Reagent Solutions
| Item | Function in Contamination Studies |
|---|---|
| Fluorescein Sodium Salt | A highly fluorescent, water-soluble tracer dye used to visualize and quantify liquid aerosolization and micro-droplet carryover. |
| Ribogreen / Picogreen Assay | Ultra-sensitive fluorescent nucleic acid stains. Used to detect minute, biologically relevant levels of DNA/RNA cross-contamination. |
| BSA (Bovine Serum Albumin) | A carrier protein added to dilution buffers (0.1-0.5%) to prevent adsorption of biomolecules (proteins, compounds) to liquid handler surfaces. |
| DMSO with Tracer Dye | Dimethyl sulfoxide mixed with a DMSO-soluble dye (e.g., tartrazine) to test for compound adsorption and solvent compatibility in positive displacement systems. |
| Nuclease-Free Water | Critical for molecular biology workflows. Used as a negative control matrix to test for nucleic acid contamination in qPCR/NGS setups. |
| PCR Inhibition Monitor | An internal control (e.g., exogenous DNA template with unique primers) added to reactions to distinguish between contamination (false positive) and inhibition (false negative). |
| Dedicated Wash Solutions | Platform-specific solutions (e.g., 10% ethanol for acoustics, 5% Contrad 70 for air displacement) for effective decontamination of internal and external paths. |
Technical Support Center
Troubleshooting Guides
Issue: High Well-to-Well Variability in Cell-Based Assays
- Potential Cause: Inconsistent surface treatment or coating across the plate, leading to uneven cell attachment.
- Solution: Verify the lot number and manufacturer's certification. Perform a pre-experiment quality control by seeding a control cell line in a checkerboard pattern and measuring attachment after 24 hours using a viability stain. Consider switching to a plate from a manufacturer with more rigorous post-production QC (e.g., 100% inspection vs. batch sampling).
Issue: Elevated Background Signal in Fluorescence Assays
- Potential Cause: Plate material autofluorescence or non-specific binding of assay components to the well surface.
- Solution: Use plates specifically treated for low-autofluorescence (e.g., black plates with a clear bottom). For non-specific binding, select plates with a surface treatment designed to minimize protein adsorption, such as a hydrophilic polymer coating. Always run a no-cell/analyte control on the same plate type.
Issue: Suspected Cross-Contamination Between Adjacent Wells
- Potential Cause: "Crosstalk" due to poor optical isolation in fluorescence readings, or physical aerosol transfer during pipetting.
- Solution: For optical crosstalk, ensure you are using plates with optically opaque, well-isolated walls (often white for luminescence, black for fluorescence). For physical transfer, use plates with raised rims and a semi-skirted or full-skirted design to prevent plate warping during handling. Always use proper pipetting technique and change tips between wells.
Issue: Poor Adhesion of Primary Cells
- Potential Cause: The surface treatment is not optimal for the specific extracellular matrix proteins required.
- Solution: Switch from standard tissue culture-treated plates to plates pre-coated with specific substrates (e.g., collagen I, poly-D-lysine, fibronectin). Refer to Table 1 for adhesion performance. Always benchmark new primary cells on a small batch of different coated plates before full-scale experiments.
Frequently Asked Questions (FAQs)
Q1: How do I choose between standard tissue culture-treated, high-binding, and low-binding plates? A1: The choice depends on your sample and assay. Use standard TC-treated for general mammalian cell culture. Use high-binding (often plasma-treated or charged) for immobilizing proteins, antibodies, or DNA in ELISA or pull-down assays. Use low-binding (often hydrophilic polymer-grafted) to minimize loss of precious proteins, stem cells, or spheroids.
Q2: What is the practical impact of plate "skirts" (none, semi, full)? A2: This impacts automation and contamination risk. No-skirt plates are less rigid but fit all thermal cyclers. Semi-skirted offer moderate rigidity and automation compatibility. Full-skirted provide maximum rigidity, prevent warping (reducing cross-contamination risk), and have room for labeling; they are ideal for automated high-throughput screening systems.
Q3: We observe edge effects (evaporation) in our 384-well assays. How can plate design mitigate this? A3: Look for plates with advanced edge design or "evaporation rings." Some manufacturers incorporate a peripheral moat or raised outer rim. Using a plate sealant designed for long-term incubation is also critical. Consider plates from manufacturers that advertise uniform evaporation control across the entire plate.
Q4: Are there performance differences between polystyrene and cyclo-olefin (COP/COC) plates? A4: Yes. Polystyrene is standard, cost-effective, and suitable for most cell-based and biochemical assays. Cyclo-olefin polymers/copolymers offer lower autofluorescence, higher clarity, and better resistance to many organic solvents, making them superior for high-sensitivity fluorescence and imaging applications.
Q5: How many times can I re-use a coated specialty plate? A5: It is not recommended. Coating integrity degrades with each sterilization (e.g., ethanol wash) and use cycle, leading to increased well-to-well variability and elevated risk of cross-contamination from residual materials. For consistent, publication-quality results, use all plates as single-use items.
Data Presentation: Quantitative Plate Performance Benchmarks
Table 1: Adhesion Efficiency of Common Surface Treatments for U2OS Cells (24h Post-Seeding)
| Surface Treatment/Coating | Manufacturer A | Manufacturer B | Manufacturer C | Key Application |
|---|---|---|---|---|
| Standard TC-Treated | 95% ± 3% | 92% ± 5% | 98% ± 2% | General cell culture |
| Collagen I (Pre-coated) | 99% ± 1% | 97% ± 2% | 99% ± 1% | Primary cell culture |
| Poly-D-Lysine (Pre-coated) | 98% ± 2% | 95% ± 3% | 97% ± 2% | Neuronal cells |
| Ultralow Attachment | 5% ± 4% | 8% ± 6% | 3% ± 2% | Spheroid formation |
Table 2: Assay Performance Metrics Across Plate Types (Fluorescence Intensity, Background)
| Plate Type (Black Wall) | Assay Background (RFU) | Signal-to-Background Ratio | Optical Crosstalk (Adjacent Well Signal %) | Best For |
|---|---|---|---|---|
| Standard Polystyrene | 450 ± 50 | 25:1 | 1.5% | Routine fluorescence |
| Low-Binding Polystyrene | 420 ± 40 | 28:1 | 1.2% | Low protein assays |
| Cyclo-Olefin (COP) | 150 ± 20 | 85:1 | 0.8% | High-sensitivity detection |
| White Polystyrene (Luminescence) | 30 ± 10 (Lum) | 500:1 | 2.0%* | Luminescence (e.g., Luciferase) |
*Luminescence crosstalk is typically higher due to light scattering.
Experimental Protocols
Protocol 1: Standardized Cross-Contamination Test (Dye Transfer) Purpose: To empirically benchmark the physical barrier integrity of different plate types against aerosol/droplet cross-contamination. Materials: PBS, Green fluorescent dye (e.g., Fluorescein), Clear plate seal, Microplate reader. Method:
- Fill all wells in Row A of the test plate with 100 µL of PBS.
- Fill all wells in Row H with 100 µL of PBS.
- To only well A1, add 1 µL of concentrated fluorescent dye. Mix thoroughly.
- Seal the plate with an adhesive seal.
- Place the plate on a plate shaker and agitate vigorously at 1000 rpm for 5 minutes to simulate stressful transport/processing conditions.
- Carefully remove the seal and measure the fluorescence in all wells (ex/em ~485/535 nm).
- Analysis: Calculate the percentage of signal transfer from well A1 to all other wells, with special attention to adjacent wells (A2, B1) and distant control wells (H12). Lower transfer indicates better physical isolation.
Protocol 2: Surface Hydrophilicity/Hydrophobicity Quality Control Purpose: To verify batch-to-batch consistency of surface treatments by measuring contact angle (spread) of a water droplet. Materials: Test plates, Deionized water, Precision pipette, Macro lens/camera setup, Contact angle analysis software (optional). Method:
- Place the plate on a flat, level surface under consistent lighting.
- Using a clean tip, carefully dispense a 2 µL droplet of water onto the dry well bottom surface in at least 12 non-edge wells per plate type/batch.
- Immediately capture a high-resolution, side-profile image of the droplet.
- Measure the droplet's base diameter or contact angle. A smaller diameter/higher contact angle indicates a more hydrophobic surface. For standard TC-treated plates, the droplet should spread significantly (large diameter, low contact angle <30°), indicating hydrophilic treatment.
- Compare the mean spread diameter across different plate lots or manufacturers to identify inconsistencies.
Visualizations
Title: Plate Selection and QC Workflow
Title: Cross-Contamination Pathways in Microwells
The Scientist's Toolkit: Research Reagent Solutions
| Item | Function & Relevance to Benchmarking |
|---|---|
| Luminescent Cell Viability Assay (e.g., ATP-based) | Quantifies cell adhesion and health across different plate surfaces without interference from plate color. Critical for Table 1 data. |
| Recombinant Human Fibronectin | A defined, consistent substrate for pre-coating plates to test performance in specialized adhesion assays, reducing batch variability. |
| BSA, Molecular Biology Grade | Used to block non-specific binding sites on low-binding or assay-specific plates during benchmarking. |
| Fluorescent Tracer Dye (e.g., Fluorescein) | Essential for the cross-contamination protocol to visually and quantitatively track well-to-well transfer. |
| Automation-Compatible Plate Seal | Provides a consistent seal during agitation steps in contamination tests; adhesive seals are preferred over heat seals for this QC. |
| Contact Angle Measurement System | Gold-standard for quantitatively assessing the hydrophilicity of surface treatments, though a simplified imaging protocol can suffice. |
| Precision Multichannel Pipette | Ensures consistent liquid handling across a high-density plate, reducing operator-induced variability during benchmarking. |
Technical Support Center
Troubleshooting Guides & FAQs
Q1: Our high-density microwell array (e.g., 1536-well) is showing a spatial pattern of failed positive controls, suggesting cross-contamination between wells. What are the most likely causes and immediate steps?
- A: This is a classic sign of aerosol or droplet transfer during liquid handling.
- Immediate Actions:
- Halt the run and quarantine the plate.
- Audit your liquid handler: Check and clean the dispenser heads, tips, and manifold for any visible contamination or carryover. Perform a water dye test to visualize droplet formation and splash.
- Review protocol: Identify steps with high-velocity dispensing or rapid plate movements.
- Likely Causes: Improperly calibrated acoustic dispensers, worn seals on positive displacement heads, overfilled wells leading to capillary bridging, or insufficient deck vibration damping during rapid moves.
- Immediate Actions:
Q2: We are observing intermittent bacterial/fungal growth in long-term cell culture assays within spheroid formation plates, but only in peripheral wells. What could be the source?
- A: This edge effect often points to environmental, not liquid handler, contamination.
- Investigation Protocol:
- Sterility Controls: Run media-only plates incubated alongside your assay plates.
- Environmental Monitoring: Use settle plates (open agar plates) in the biosafety cabinet and incubator to check for airborne contaminants.
- Check Incubator: Inspect the incubator's HEPA filters, water reservoirs (for humidity), and sealing gaskets. Contamination often enters via compromised seals when plates are loaded/unloaded.
- Solution: Implement routine decontamination cycles for incubators and use plate lids with condensation rings. Consider using sterile adhesive membrane seals for assays >24 hours.
- Investigation Protocol:
Q3: After switching to a more sensitive detection reagent (e.g., for luminescence), we now see high background and signal carryover from adjacent high-concentration wells. How can we diagnose and mitigate this?
- A: Increased sensitivity exposes subtle optical or physical cross-talk.
- Diagnostic Experiment:
- Create a "checkerboard" control plate. Fill alternating wells with a high-concentration luminescent substrate (or fluorescent dye) and buffer only.
- Image the plate immediately using your standard detection settings.
- Analyze the signal in the buffer-only wells adjacent to high-signal wells. Elevated signal indicates optical bleed-through (light leakage) or evaporation/condensation-mediated transfer.
- Mitigation: Use plate reader optics with superior well-to-well crosstalk specifications (e.g., <0.01%). For evaporation issues, use a humidified chamber during assay steps or opt for plates with an optically clear, sealed lid.
- Diagnostic Experiment:
Q4: Our qPCR data from nanoliter reactions in microarray chips shows amplification in NTCs (No Template Controls) that are downstream of high-copy-number samples on the liquid handler deck. How do we trace this?
- A: This suggests amplicon contamination, a severe issue for molecular assays.
- Containment & Tracing Protocol:
- Segregate Pre- and Post-PCR Areas: This is non-negotiable. Physically separate liquid handlers used for setting up reactions from those handling amplified products.
- UV Decontamination: Ensure your liquid handler has a UV lamp in its deck and uses it for a sufficient cycle (e.g., 15-30 minutes) between runs.
- Liquid Handler Maintenance: Replace all tubing and seals on the affected dispenser. For contact dispensers, implement a rigorous decontamination wash protocol with 10% bleach followed by RNase/DNase-free water flushes.
- Validation Test: Run a contamination check plate where NTCs are placed in positions likely to receive carryover from a previous run's high-titer samples.
- Containment & Tracing Protocol:
The Scientist's Toolkit: Research Reagent Solutions
| Item | Function & Rationale |
|---|---|
| Nuclease-Inactive Liquid Handler Reagents | Pre-mixed buffers and dyes treated to remove RNase/DNase activity, critical for setting up sensitive molecular assays without background degradation. |
| PCR Plate Sealing Films (Adhesive, Optical) | Provide a vapor-tight seal to prevent well-to-well evaporation/condensation, which can transfer material. Optical grade ensures no interference with detection. |
| Dedicated, Low-Binding Pipette Tips & Microfluidic Cartridges | Tips treated to minimize protein/DNA adhesion reduce carryover between dispenses. Single-use cartridges eliminate tubing contamination. |
| Liquid Handler Wash/Decon Solutions (e.g., 10% Bleach, 70% EtOH, UNIQ) | Validated cleaning solutions for automated decks. Bleach degrades nucleic acids, EtOH disinfects, and specialized detergents remove lipids/proteins. |
| Fluorescent Tracers (e.g., Fluorescein) | Added to control solutions to visually track droplet formation, splash, and potential contamination paths using a plate reader's fluorescence settings. |
| Settle Plates (TSA, TSB Agar) | Used for passive air monitoring in cabinets and incubators to quantify bioburden and identify contamination sources in the lab environment. |
Experimental Protocols
Protocol 1: Liquid Handler Droplet Contamination Diagnostic Test
Objective: To visualize and quantify aerosol/droplet generation during high-throughput dispensing.
- Materials: Empty 1536-well plate, water-sensitive paper (cut to fit plate dimensions), multichannel or array liquid handler, fluorescent dye (optional).
- Method:
- Place a sheet of water-sensitive paper (turns blue on contact with liquid) over the top of an empty microplate.
- Program the liquid handler to perform a simulated assay protocol, including all mixing, dispensing (with water or dyed water), and plate movement steps.
- Execute the program.
- Remove and scan the paper. Any blue spots outside the expected well locations indicate droplet escape.
- For quantification, use a fluorescent dye in the source liquid and image the paper under a fluorescence scanner to measure intensity of stray droplets.
Protocol 2: Quantitative Cross-Talk Measurement for Plate Readers
Objective: To determine the optical crosstalk percentage of a microplate reader for a given assay volume and plate type.
- Materials: 384-well or 1536-well plate, concentrated fluorescent dye (e.g., Fluorescein), assay buffer, plate reader.
- Method:
- Fill all wells of the plate with buffer.
- In a central well (e.g., well D8 in a 384-well plate), replace the buffer with a high-concentration fluorescent dye solution.
- Read the plate using the fluorescence settings for your target assay (excitation/emission, gain, resolution).
- Export the raw fluorescence values for all wells.
- Calculation: Identify the signal (
S_adjacent) in the four or eight wells directly adjacent to the source well. Identify the signal (S_background) in wells far from the source. - Crosstalk % =
[ (Avg(S_adjacent) - Avg(S_background) ) / S_source ] * 100.
Data Presentation
Table 1: Cost-Benefit Analysis of Contamination-Prevention Technologies
| Technology | Initial Investment (USD) | Annual Maintenance/Cost (USD) | Contamination Event Reduction (Estimated) | Cost per Saved Assay Run* (USD) | Key Benefit |
|---|---|---|---|---|---|
| Advanced Acoustic Liquid Handler | $250,000 - $350,000 | $15,000 | >95% (vs. contact tips) | $2,500 - $3,500 | Non-contact, eliminates tip-based carryover and seals. |
| UV-C Deck Decontamination System | $10,000 - $20,000 (add-on) | $500 (lamp replacement) | 70-80% (for amplicons) | $200 - $400 | Automated nucleic acid degradation between runs. |
| Humidified Environmental Enclosures | $5,000 - $15,000 | $1,000 | ~90% (evaporation-mediated issues) | $80 - $150 | Stabilizes nanoliter volumes, prevents condensation. |
| Automated Plate Sealer | $8,000 - $12,000 | Minimal | ~60% (vs. manual) | $150 - $250 | Consistent, vapor-tight seals reduce edge effects. |
| High-Spec Plate Reader (Low Crosstalk) | $80,000 - $150,000 | $8,000 | 100% (of optical crosstalk) | N/A (Capability) | Enables use of ultra-HTS formats without data corruption. |
*Assumes a value of $10,000 per saved high-content screening run (reagents, labor, lost opportunity).
Table 2: Impact of Contamination on Experimental Outcomes
| Contamination Type | Typical Detection Method | Assay Stage Affected | Direct Consequence | Probable Cost per Event (Reagents & Labor) |
|---|---|---|---|---|
| Aerosol/Droplet (Liquid Handler) | Spatial failure patterns, high CVs | Assay Setup | False positives/negatives, invalidated plate | $1,000 - $5,000 |
| Amplicon (qPCR/NGS) | NTC amplification | Post-Amplification Handling | Invalidated entire study batch, publication risk | $5,000 - $25,000+ |
| Microbial (Cell Culture) | Cloudy media, pH shift | Long-term Incubation | Lost cell lines & weeks of time, treatment artifacts | $2,000 - $10,000+ |
| Evaporation/Condensation | Edge/pattern-based signal drift | Incubation | Concentration artifacts, inaccurate dose-response | $500 - $3,000 |
| Carryover (Protein/Compound) | High background in low [ ] wells | Liquid Transfer | Skewed IC50/EC50, reduced dynamic range | $1,000 - $8,000 |
Visualizations
Title: Impact Pathway of HTS Contamination on ROI
Title: Prevention Technology Investment ROI Pathway
Conclusion
Effective management of cross-contamination in high-density microwell arrays is not merely a technical detail but a fundamental prerequisite for data integrity in modern high-throughput screening. By first understanding the multifaceted sources and significant impacts (Intent 1), researchers can implement robust methodological defenses (Intent 2). A proactive, systematic troubleshooting mindset (Intent 3) allows for the rapid diagnosis and resolution of issues, while rigorous validation and comparative assessment (Intent 4) provide the necessary confidence in results. The future of ultra-miniaturized assays and complex phenotypic screenings demands even greater vigilance. Embracing a holistic contamination-control strategy, integrating both established best practices and emerging non-contact dispensing technologies, will be critical for accelerating reliable drug discovery and advancing translational biomedical research. The investment in rigorous contamination control directly translates to more reproducible science, reduced costly assay repeats, and faster progression of viable therapeutic candidates.